• 概要
  • レビュー (2)
  • コメント (6)
  • 最新情報

Tetris for MT5

4

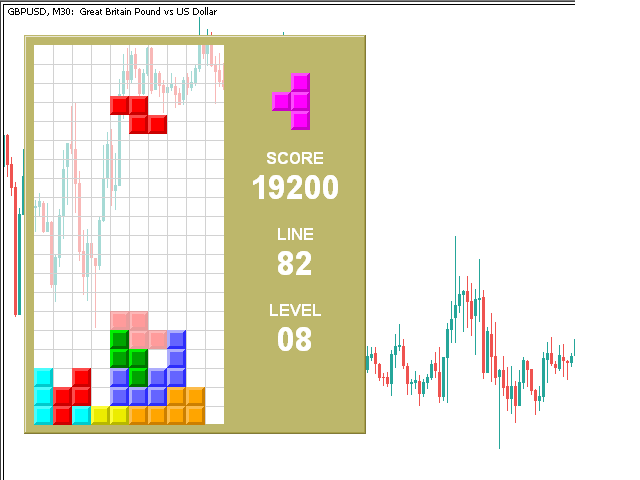
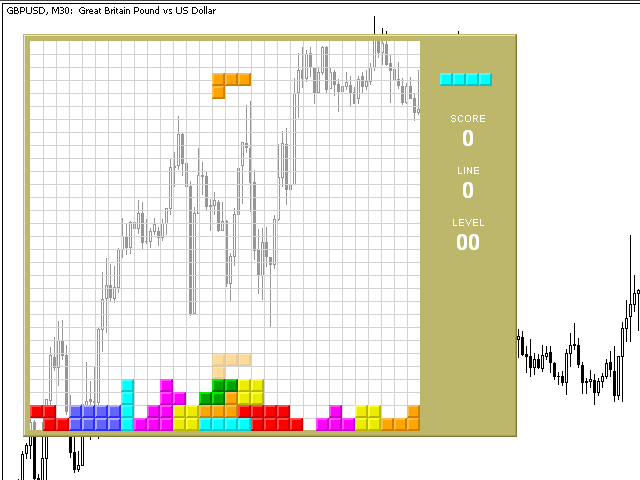
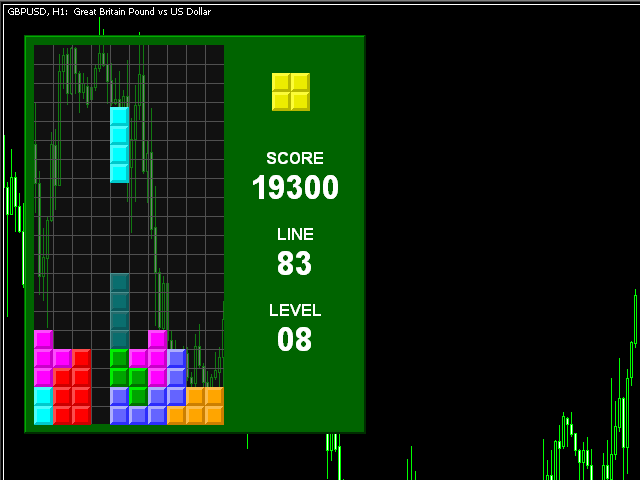
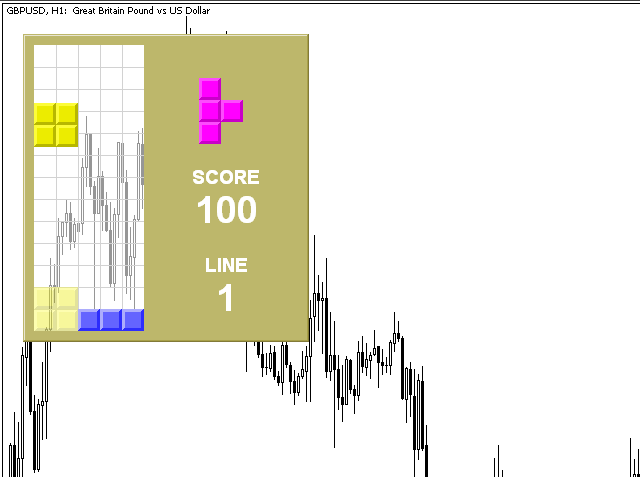
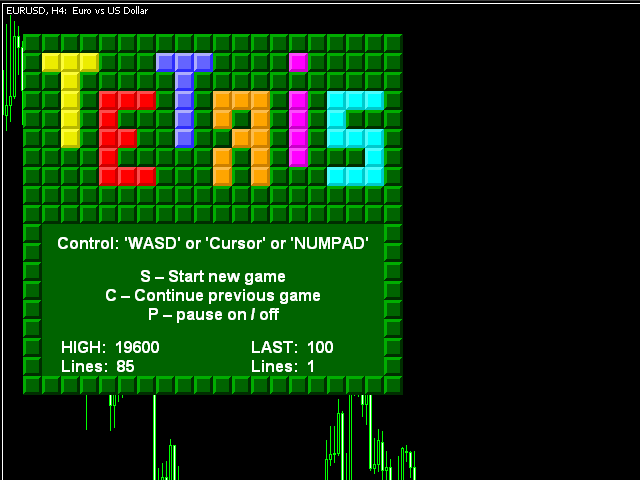
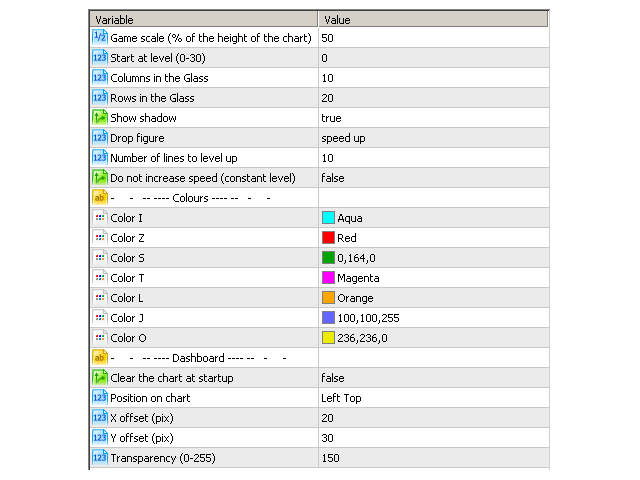
The Tetris — the most famous time killer is now on MT. Game develops active logic, attention and speed of decision making. This is a classic version of the game, no frills, but you can still adjust the size of the glass, the scale of the game, the color of the figures, and the desired speed. The game is made as an indicator.

Control Keys:

  • 'W,A,S,D' or 'Cursor' or 'NumPad'.
  • S — Start new game.
  • C — Continue previous game.
  • P — pause on / off.
  • Space  — drop a figure.
  • Esc — exit to menu.
    レビュー 2
    kakou
    67
    kakou 2021.06.30 17:25 
     

    Absolutely awesome. useless but awesome :)

    おすすめのプロダクト
    Follow The Line MT5
    Oliver Gideon Amofa Appiah
    4.42 (31)
    This indicator obeys the popular maxim that: "THE TREND IS YOUR FRIEND" It paints a GREEN line for BUY and also paints a RED line for SELL. (you can change the colors). It gives alarms and alerts of all kinds. IT DOES NOT REPAINT and can be used for all currency pairs and timeframes. Yes, as easy and simple as that. Even a newbie can use it to make great and reliable trades. NB: For best results, get my other premium indicators for more powerful and reliable signals. Get them here: https://www.m
    FREE
    Free automatic Fibonacci is an indicator that automatically plots a Fibonacci retracement based on the number of bars you select on the BarsToScan setting in the indicator. The Fibonacci is automatically updated in real time as new highest and lowest values appears amongst the selected bars. You can select which level values to be displayed in the indicator settings. You can also select the color of the levels thus enabling the trader to be able to attach the indicator several times with differe
    FREE
    Donchian Channel is an indicator created by Richard Donchian. It is formed by taking the highest high and the lowest low of the last specified period in candles. The area between high and low is the channel for the chosen period. Its configuration is simple. It is possible to have the average between the upper and lower lines, plus you have alerts when price hits one side. If you have any questions or find any bugs, please contact me. Enjoy!
    FREE
    Are you tired of drawing trendlines every time you're analyzing charts? Or perhaps you would like more consistency in your technical analysis. Then this is for you. This indicator will draw trend lines automatically when dropped on a chart. How it works Works similar to standard deviation channel found on mt4 and mt5. It has 2 parameters: 1. Starting Bar 2. Number of bars for calculation The   starting bar   is the bar which drawing of the trend lines will begin, while the   number of bars for c
    FREE
    The idea of the system is to indentify the reversal patterns using the calculation of the composite candle. The reversal patterns is similar to the "Hammer" and "Hanging Man" patterns in Japanese candlestick analysis. But it uses the composite candle instead the single candle and doesn't need the small body of the composite candle to confirm the reversal. Input parameters: Range - maximal number of bars, used in the calculation of the composite candle. Minimum - minimal size of the composite can
    FREE
    Easy GOLD MT5
    Franck Martin
    4.27 (22)
    Easy Gold is the latest addition to the BotGPT family. It is surprising and very powerful. It is ideal for beginners due to its simplicity.  There is absolutely nothing to do, it's 100% automated, simply indicate the percentage of risk you want to take per trade and the EA is ready. Whatever your capital, the EA takes care of everything. Optimized on (XAUUSD).  Unleash all the power with the professional version (AGI Gold) and its connection to the neural network, available in my store. My othe
    FREE
    The indicator is based on Robert Miner's methodology described in his book "High probability trading strategies" and displays signals along with momentum of 2 timeframes. A Stochastic oscillator is used as a momentum indicator. The settings speak for themselves period_1 is the current timeframe, 'current' period_2 is indicated - the senior timeframe is 4 or 5 times larger than the current one. For example, if the current one is 5 minutes, then the older one will be 20 minutes The rest of the
    FREE
    Donchian Pro
    Paulo Henrique Faquineli Garcia
    5 (2)
    The Donchian Channel Channels are among the most popular tools of technical analysis, as they visually convey to the analyst the limits within which most price movement tends to occur. Channel users know that valuable information can be obtained at any time, whether prices are in the central region of a band or close to one of the border lines. One of the best known techniques to explore these concepts is Bollinger Bands. However, John Bollinger was not the only one to research the applicatio
    FREE
    Rainbow MT5
    Jamal El Alama
    4.33 (3)
    Description : Rainbow MT5 is a technical indicator based on Moving Average with period 34 and very easy to use. When price crosses above MA and MA changes color to green, then this is a signal to buy. When price crosses below MA and MA changes color to red, then this is a signal to sell. The Expert advisor ( Rainbow EA MT5 ) based on Rainbow MT5 indicator is now available here . MT4 version is available here .
    FREE
    Important Lines
    Terence Gronowski
    4.88 (26)
    This indicator displays Pivot-Lines, preday high and low, preday close and the minimum and maximum of the previous hour. You just have to put this single indicator to the chart to have all these important lines, no need to setup many single indicators. Why certain lines are important Preday high and low : These are watched by traders who trade in a daily chart. Very often, if price climbs over or falls under a preday low/high there is an acceleration in buying/selling. It is a breakout out of
    FREE
    Second Level Candles And Alligator Indicators 每12秒产生一个K线,而且自带Alligator指标,对超短线选手交易非常有帮助。程序启动时可能不成功,是因为MT5 MqlTick 数据加载少的原因。可以通过修改显示的数据参数避免,比如display=100,程序正常之后再将参数调大 display=300 。如果数据不正常,也可以采用重新加载的方式解决。 如果您对这个指标有任何建议,请联系作者。  Second Level Candles And Alligator Indicators  produced a candle per 12 seconds,include Alligator, it's helpful to Short-Term Trading。You'd better reload the indicator every start MT5 or change display parameter to reslove data bug. Please attach author when  you had some su
    FREE
    Tabajara V5
    Flavio Javier Jarabeck
    4.88 (41)
    Metatrader 5 version of the famous Andre Machado's Tabajara indicator. If you don't know Andre Machado's Technical Analysis work you don't need this indicator... For those who need it and for those several friend traders who asked this porting from other platforms, here it is... FEATURES 8-period Moving Average 20-period Moving Average 50-period Moving Average 200-period Moving Average Colored candles according to the inflexion of the 20-period MA SETTINGS You can change the Period of all M
    FREE
    トレンドキャッチャー: アラートインジケーター付きのトレンドキャッチャーストラテジーは、市場トレンドやポテンシャルなエントリーポイントやエグジットポイントを特定するのに役立つ多目的な技術分析ツールです。動的なトレンドキャッチャーストラテジーを備えており、市場状況に適応してトレンドの方向を明確に視覚化します。トレーダーは、自身の好みやリスク許容度に合わせてパラメーターをカスタマイズできます。このインジケーターはトレンドの識別を支援し、ポテンシャルなリバーサルをシグナルし、トレイリングストップのメカニズムとして機能し、市場への迅速な対応のためのリアルタイムアラートを提供します。 特徴: - トレンドの識別:上昇トレンドと下降トレンドをシグナルします。 - トレンドのリバーサル:ローソク足の色が上昇から下降に変わった場合やその逆の場合に、ポテンシャルなリバーサルを警告します。 - リアルタイムアラート:新しいトレンドの識別に対するアラートを生成します。 推奨事項: - 通貨ペア:EURUSD、AUDUSD、XAUUSDなど... - タイムフレーム:H1。 - アカウン
    FREE
    The Penta-O is a 6-point retracement harmonacci pattern which usually precedes big market movements. Penta-O patterns can expand and repaint quite a bit. To make things easier this indicator implements a twist: it waits for a donchian breakout in the right direction before signaling the trade. The end result is an otherwise repainting indicator with a very reliable trading signal. The donchian breakout period is entered as an input. [ Installation Guide | Update Guide | Troubleshooting | FAQ | A
    FREE
    Bollinger Bands B
    Flavio Javier Jarabeck
    5 (3)
    John Bollinger created this indicator in 2010 as a way to read the original indicator (Bollinger Bands) in a more "technical" way, shown as an oscillator. The typical range of the Bollinger Bands %B is 0 - 0.5 - 1.0, where "0" represents the lower band, the "0.5" the middle band, and "1" the upper band. The line on the indicator represents the Closing prices. As simple as that. SETTINGS Bollinger Bands period of analysis Standard Deviation multiplier Shift Price type to be analyzed If you
    FREE
    Pivot MT5
    Dmitrij Isaenko
    5 (1)
    The indicator draws daily support and resistance lines on the chart, as well as the Pivot level (reversal level). Adapted to work in MT5 The standard timeframe for calculating support and resistance levels is D1. You can choose other timeframes according to your strategy (for example, for M1-M15, the optimal timeframe for calculations is H1) The function for calculating support and resistance levels has been updated; in this calculation option, fibonacci levels are taken into account, res
    FREE
    無限からの通貨の強さを測定するためのこの革新的な指標は、長い間取引されているダフ屋やトレーダーにとって不可欠な助手です。 通貨の強さ/弱さを分析するためのシステムは、世界の主要なトレーダーによって市場で長い間知られており、使用されてきました。 任意の裁定取引は、この分析なしでは完全ではありません。 私たちの指標は、互いに関連して基本通貨の強さを簡単に決定します。 これは、インスタント分析を可能にし、最強のエントリポイントを検索し、すべてまたは現在の通貨ペアの折れ線グラフが表示されます。 インジケータは直感的で、すぐに見つけて任意のペアに切り替えることができ、地下室とメインチャートの両方に配置できるモバイルパネルがあります。 通貨の強さの変化の通知のタイマーモードは、トレーダーに電話で通知を受け取る機会を与えます。  通貨パワーメーターインフィニティ指標を使用するためのいくつかの戦略: 1. 通貨の強さの線形表示のチャートを使用して、交差点を新興トレンドの信号として検索します 2. トレンド反転信号が表示された後、強い通貨の方向に頭皮 3. 通貨の強さの発散分析を使用して、
    FREE
    Weis Waves
    Flavio Javier Jarabeck
    3.15 (26)
    The original author is David Weis, an expert in the Wyckoff Method. The Weis Wave is a modern adaptation of the 1930's Wyckoff Method, another expert in Tape Reading techniques and Chart Analysis. Weis Waves takes market volume and stacks it into waves according to price conditions giving the trader valuable insights about the market conditions. If you want to learn more about this subject you can find tons of videos in YouTube. Just look for "The Wickoff Method", "Weis Wave" and "Volume Spread
    FREE
    This is a free version of the indicator, the period between the vertical lines is always 30 bars. In the paid version the period can be set by user, so a configuration with many ThreePointsChannel indicators with different periods is possible. The principle of construction - on top of any number of bars set by the user, a channel is constructed with maximum and minimum lines so that the bars touch the maximum and minimum of the channel at exactly three points. The name of the indicator follows
    FREE
    Dual RSI
    Paul Conrad Carlson
    Indicator alerts for Dual Relative strength index rsi. Large rsi preset at 14 is below 30 small rsi preset at 4 is below 10 for buy bullish signals . Large rsi preset are 14 is above 70 small rsi preset at 4 is above 90 for sell bearish signals . Includes mobile and terminal alerts. draws lines when alerts. This indicator can help identify extremes and then the tops or bottoms of those extremes .
    FREE
    A professional tool for trading - the divergence indicator between the  Stochastic and the price, which allows you to receive a signal about a trend reversal in a timely manner or catch price pullback movements (depending on the settings). The indicator settings allow you to adjust the strength of the divergence due to the angle of the  Stochastic peaks and the percentage change in price, which makes it possible to fine-tune the signal strength. The indicator code is optimized and is tested ver
    FREE
    SX Theme Setter is intended for changing chart appearance in 2 modes: - Gradient background mode: In this mode, the indicator creates a gradient background for your chart. Colors, steps and gradient type can be selected by user. - Color theme: Color theme mode provides more than 50 built-in different color themes which can be selected from a list. Most of these themes are converted from official color themes of real trading platforms of the past and present. Try them out and see if they sui
    FREE
    This indicator is a zero-lag indicator and displays  strength of trend change . True Trend  Oscillator Pro works best in combination with True Trend Moving Average Pro that displays exact trend as is. Oscillator value is exact price change in given direction of the trend. True Trend Moving Average Pro: https://www.mql5.com/en/market/product/103586 If you set PERIOD input parameter to 1 this indicator becomes a sharpshooter for binary options. Developers can use True Trend Oscillator in E
    FREE
    Spike Catch Pro 22:03 release updates Advanced engine for searching trade entries in all Boom and Crash pairs (300,500 and 1000) Programmed strategies improvements Mx_Spikes (to combine Mxd,Mxc and Mxe), Tx_Spikes,   RegularSpikes,   Litho_System,   Dx_System,   Md_System,   MaCross,   Omx_Entry(OP),  Atx1_Spikes(OP),   Oxc_Retracement (AT),M_PullBack(AT) we have added an arrow on strategy identification, this will help also in the visual manual backtesting of the included strategies and see h
    FREE
    MACD Colored ZeroLag
    Farzin Sadeghi Bonjar
    4.14 (7)
    It is the MQL5 version of zero lag MACD that was available for MT4 here: https://www.mql5.com/en/code/9993 Also there was a colored version of it here but it had some problems: https://www.mql5.com/en/code/8703 I fixed the MT4 version which has 95 lines of code. It took me 5 days to write the MT5 version.(reading the logs and testing multiple times and finding out the difference of MT5 and MT4!) My first MQL5 version of this indicator had 400 lines of code but I optimized my own code again and n
    FREE
    RSI RH Divergence Scanner
    Usiola Oluwadamilol Olagundoye
    You can run this Tool in the Visual Strategy Tester. Indicator version coming soon. If you want this built into a Custom EA for you, send me a message. The Metatrader 5 RSI regular and hidden divergence scanner is a powerful tool designed to identify potential trading opportunities based on divergences between the RSI indicator and price action. With its intuitive interface and advanced scanning capabilities, this scanner helps traders pinpoint instances where price movements may be diverging f
    FREE
    Value Chart Candlesticks
    Flavio Javier Jarabeck
    4.67 (9)
    The idea of a Value Chart indicator was presented in the very good book I read back in 2020 , " Dynamic Trading Indicators: Winning with Value Charts and Price Action Profile ", from the authors Mark Helweg and David Stendahl. The idea is simple and the result is pure genius: Present candlestick Price analysis in a detrended way! HOW TO READ THIS INDICATOR Look for Overbought and Oversold levels. Of course, you will need to test the settings a lot to find the "correct" one for your approach.
    FREE
    The indicator identifies when a divergence occurs between price and an indicator or oscillator. It identifies both regular and hidden divergences. Combined with your own rules and techniques, this indicator will allow you to create (or enhance) your own powerful system. Features Can detect divergences for the following oscillators/indicators:   MACD, OsMA, Stochastics, RSI, CCI, RVI, Awesome, ADX, ATR, OBV, Composite index, MFI and Momentum. Only one oscillator/indicator can be selected. Draws
    FREE
    Combining the best of Price Action , Directional Movement , and Divergence/Convergence analysis, Candle Color Trend is a easy and reliable way to identify trend direction. The indicator automatically paints the candles according to the assumption that an uptrend is defined by prices that form a series of higher highs and higher lows. In contrast, a downtrend is defined by prices that form a series of lower highs and lower lows. Additionally, ADX Wilder indicator is used to measure trend weakness
    FREE
    ET1 for MT5 is new and completely free!! ET1 for MT5 v4.20 Updated!! Now use on XAUUSD(Gold) !!  The success rate is more than 75%   !!! important update: Merge ET9 's breakout strategy Warning!! You can use ET1 completely free, but we do not guarantee ET1 stability, It is recommended that the more powerful ET9 for MT5 version includes the ET1 strategy and guarantees complete and stable returns. The Best Expert Advisor  on   XAUUSD   any timeframes  ET9  for MT5 Updated v4.70 !!  https:/
    FREE
    このプロダクトを購入した人は以下も購入しています
    Trade Assistant MT5
    Evgeniy Kravchenko
    4.39 (175)
    取引 ごとのリスクの 計算、新規注文 の 簡単 な 設置、部分的 な 決済機能 を 持 つ 注文管理、 7 種類 のトレーリングストップなど 、便利 な 機能 を 備 えています 。 注意、アプリケーションはストラテジーテスターでは機能しません。 説明ページからデモ版をダウンロードできます  Manual, Description, Download demo ライン機能 チャート上にオープニングライン、ストップロス、テイクプロフィットを表示します。この機能により、新規注文を簡単に設定することができ、注文を出す前にその特徴を確認することができます。   リスク計算 リスク計算機能は、設定されたリスクとストップロス注文のサイズを考慮して、新規注文のボリュームを計算します。ストップロスの大きさを自由に設定できると同時に、設定したリスクを守ることができます。 Lot calc ボタン - リスク 計算 を 有効 / 無効 にします 。 Risk フィールドでは 、必要 なリスクの 値 を 0 から 100 までのパーセンテージまたは 預金通貨 で 設定 します 。 設定」 タブで 、
    価格が一瞬で変わる可能性のある市場では、注文はできるだけ簡単にすべきだと思いますか? Metatraderでは、注文を開くたびに、開始価格を入力し、損失を止めて利益を得るウィンドウと、取引サイズを開く必要があります。金融市場の取引では、初期預金を維持し、それを増やすために資本管理が不可欠です。それで、あなたが注文をしたいとき、あなたはおそらくあなたがどれくらいの大きさの取引を開くべきか疑問に思いますか?この単一の取引であなたの預金の何パーセントを危険にさらすべきですか?この取引からどれだけの利益を得ることができますか?また、リスクに対する利益の比率はどのくらいですか?トレードサイズを設定する前に、トレードサイズがどうあるべきかという質問に対する答えを得るために必要な計算を行います。 これらすべてを自動的に行うツールがあると想像してみてください。チャートを開き、市場分析を行い、エントリーポイント、ディフェンスポイント(ストップロス)、ターゲット(テイクプロフィット)を水平線でマークし、最後にリスクのレベルを定義します。利用可能な資本の%として、このトランザクションで負担することができ、こ
    TradePanel MT5
    Alfiya Fazylova
    4.86 (117)
    Trade Panel は、多機能の取引アシスタントです。 このアプリケーションには手動取引用の 50 以上の機能が含まれており、ほとんどの取引アクションを自動化できます。 購入する前に、デモ アカウントでデモ バージョンをテストできます。 デモは こちら から。 詳しい手順は こちら をご覧ください。 取引。 ワンクリックで基本的な取引操作を実行できます。 未決の注文とポジションをオープンする 注文のグリッドを開く 未決の注文とポジションを決済する ポジションの反転(買いを閉じて売りをオープンする、または売りを閉じて買いをオープンする) ポジションをロックする(反対のポジションをオープンすることで、売りポジションと買いポジションの量を等しくします) すべてのポジションを部分的に決済します。 すべてのポジションのテイクプロフィットやストップロスを共通のレベルに設定します。 すべてのポジションのストップロスを損益分岐点レベルに設定します。 注文とポジションをオープンする際に、次のことが可能になります。 確立されたリスクに応じて取引量の自動計算を使用します。 ワンクリックで複数の注文を開き
    The product will copy all telegram signal to MT5 ( which you are member) , also it can work as remote copier.  Easy to set up, copy order instant, can work with almost signal formats, image signal,  s upport to translate other language to English Work with all type of channel or group, even channel have "Restrict Saving Content", work with  multi channel, multi MT5 Work as remote copier: with signal have ticket number, it will copy exactly via ticket number. Support to backtest signal. How to s
    Local Trade Copier EA MT5
    Juvenille Emperor Limited
    5 (66)
    Local Trade Copier EA MT5 による、驚くほど高速な取引コピーを体験してください。1分で簡単にセットアップできるこの取引コピー機は、同じWindowsコンピュータまたはWindows VPS上の複数のMetaTrader端末間で取引をコピーすることができ、0.5秒未満の高速コピースピードを実現します。 初心者であろうとプロのトレーダーであろうと、 Local Trade Copier EA MT5 には、あなたの特定のニーズに合わせてカスタマイズするための幅広いオプションが用意されています。これは、利益の可能性を高めたい人にとって究極のソリューションです。 今すぐ試してみて、これが市場で最も速くて簡単なトレードコピー機である理由を理解してください。 ヒント: デモアカウントで Local Trade Copier EA MT5 デモバージョンをダウンロードして試すことができます: ここ ダウンロードした無料のデモ ファイルを MT5 >> ファイル >> データ フォルダを開く >> MQL5 >> Experts フォルダに貼り付けて、ターミナルを再起動し
    Trade Manager は、リスクを自動的に計算しながら、取引を迅速に開始および終了するのに役立ちます。 過剰取引、復讐取引、感情的な取引を防止する機能が含まれています。 取引は自動的に管理され、アカウントのパフォーマンス指標はグラフで視覚化できます。 これらの機能により、このパネルはすべてのマニュアル トレーダーにとって理想的なものとなり、MetaTrader 5 プラットフォームの強化に役立ちます。多言語サポート。 MT4バージョン  |  ユーザーガイド + デモ Trade Manager はストラテジー テスターでは機能しません。 デモについてはユーザーガイドをご覧ください。 危機管理 % または $ に基づくリスクの自動調整 固定ロットサイズを使用するか、ボリュームとピップに基づいた自動ロットサイズ計算を使用するオプション RR、Pips、または価格を使用した損益分岐点ストップロス設定トレーリングストップロス設定 目標に達したときにすべての取引を自動的に終了するための 1 日あたりの最大損失 (%)。 過度のドローダウンからアカウントを保護し、オーバートレードを防ぎます
    MT5 to Telegram Signal Provider は、Telegramのチャット、チャンネル、またはグループに 指定された シグナルを送信することができる、完全にカスタマイズ可能な簡単なユーティリティです。これにより、あなたのアカウントは シグナルプロバイダー になります。 競合する製品とは異なり、DLLのインポートは使用していません。 [ デモ ] [ マニュアル ] [ MT4版 ] [ Discord版 ] [ Telegramチャンネル ] セットアップ ステップバイステップの ユーザーガイド が利用可能です。 Telegram APIの知識は必要ありません。必要な全ては開発者から提供されます。 主な特長 購読者に送信する注文の詳細をカスタマイズする機能 例えば、Bronze、Silver、Goldといった階層型のサブスクリプションモデルを作成できます。Goldサブスクリプションでは、すべてのシグナルが提供されます。 id、シンボル、またはコメントによって注文をフィルターできます 注文が実行されたチャートのスクリーンショットが含まれます 追加の
    Tired of complex order placement and manual calculations? Trade Dashboard is your solution. With its user-friendly interface, placing orders becomes effortless, by a single click, you can open trades, set stop loss and take profit levels, manage trade lot size, and calculate risk to reward ratios, allowing you to only focus on your strategy. Say goodbye to manual calculations and streamline your trading experience with Trade Dashboard. Download   demo version   right now. You can find   deta
    あなたがメンバーである任意のチャネルから(プライベートおよび制限されたものを含む)シグナルを直接あなたのMT5にコピーします。  このツールは、トレードを管理し監視するために必要な多くの機能を提供しながら、ユーザーを考慮して設計されています。 この製品は使いやすく、視覚的に魅力的なグラフィカルインターフェースで提供されています。設定をカスタマイズして、数分で製品を使用を開始できます! ユーザーガイド + デモ  | MT4版 | Discord版 デモを試してみたい場合は、ユーザーガイドにアクセスしてください。 Telegram To MT5 受信機は、ストラテジーテスターで動作しません! Telegram To MT5の特徴 複数のチャネルから一度にシグナルをコピー プライベートおよび制限されたチャネルからシグナルをコピー BotトークンまたはChat IDは必要ありません   (必要に応じて使用することができます) リスク%または固定ロットを使用して取引 特定のシンボルを除外 すべてのシグナルをコピーするか、コピーするシグナルをカスタマイズするかを選択 すべてのシグナ
    Set price targets, and leave everything else to HINN Lazy Trader! This tool is designed for automatic position sizing from specified levels to designated targets. Using a VPS is recommended (*). The demo version   limited in functionality, be sure to watch this video before using -->  https://youtu.be/2NE8COr9-Bk  and this -->  https://youtu.be/Yv9gid3bMxE A community for users, product discussion, update news, and first line of support are organized in a free Discord: https://discord.gg/zFhEZc
    MT5 to Discord Signal Provider は、Discord へ直接トレーディングシグナルを送信するために設計された、使いやすく完全にカスタマイズ可能なユーティリティです。このツールは、あなたのトレーディングアカウントを効率的なシグナルプロバイダーに変えます。 スタイルに合わせてメッセージフォーマットをカスタマイズ!利便性を考え、事前にデザインされたテンプレートから選択し、メッセージのどの要素を含めるか除外するかを選択できます。 [ デモ ] [ マニュアル ] [ MT4 バージョン ] [ Telegram バージョン ] セットアップ 簡単なセットアップのために、私たちの詳細な ユーザーガイド に従ってください。 Discord API の事前知識は必要ありません。必要なツールはすべて提供されます。 主な特徴 購読者の更新のための注文詳細をカスタマイズ。 ブロンズ、シルバー、ゴールドなど、各レベルで異なるシグナルアクセスを提供する階層的サブスクリプションモデルを実装。 注文が実行されたチャートのスクリーンショットを添付。 これらのスクリーンショットに表
    The top-selling EAs on the market cost a lot and one day they are suddenly gone. This is because one strategy will not work in the forex market all the time. Our product is unique from all others in the MQL Marketplace because our EA comes with 34+ built-in indicators that allow develop strategies every time.  You build your strategy and keep updating it. If one strategy does not work, simply build another all using only one EA. This is All-In-One EA   in this market place. You can use as trade
    ATTENTION the expert does not work in strategy tester, for a trial version visit my profile. " Launch offer : throughout the month of June, purchase our product for only 100 USD instead of 150 USD!" Manual RiskGuard Management   RiskGuard management was born with the idea of ​​helping traders from their initial journey to becoming expert and aware traders. Written completely with native MetaTrader 5 functions without any use of external libraries, it is perfectly compatible with any operatin
    Trade copier MT5
    Alfiya Fazylova
    4.34 (29)
    Trade Copierは、取引口座間の取引をコピーして同期するように設計された専門的なユーティリティです。 コピーは、同じコンピューターまたはvps にインストールされている、サプライヤーのアカウント/端末から受信者のアカウント/端末に行われます。 購入する前に、デモ アカウントでデモ バージョンをテストできます。 デモ版 こちら 。 詳細な説明は こちら 。 主な機能と利点: MT5ネッティングアカウントを含む、MT5> MT5、MT4> MT5、MT5> MT4のコピーをサポートします。 高いコピー速度(0.5秒未満)。 ベンダーモードと受信者モードは同じ製品内に実装されています。 チャートから直接リアルタイムでコピーを制御できる、簡単で直感的なインターフェイス。 接続が切断されたり、端末が再起動されたりしても、設定と位置が失われることはありません。 コピーするシンボルを選択できます。また、受信者のシンボルを置き換えることもできます(例:EURUSD> USDJPY)。 バックコピーをサポートします。 特定の注文のみのコピーを有効にする機能。 取引開始価格の最大差と最大遅延時間を
    Trade Assistant 38 in 1
    Makarii Gubaydullin
    4.88 (16)
    多機能ツール 搭載機能: ロット計算機、プライスアクション、リスク/リワードレシオ、トレードマネージャー、需要供給ゾーンなどをはじめ65以上の機能。 バージョ:デモ版   |   ユーザーマニュアル   |    MT5版 このユーティリティはストラテジー テスターでは機能しません。 ここからデモ   バージョンをダウンロードして製品をテストできます。 ご不明な点や改善提案、バグの発見などございましたら、 連絡してください 。 取引プロセスを簡素化、高速化、自動化します。このダッシュボードで標準端末機能を拡張します 1. 新しい取引を開始します : ロット / リスク / RR の計算 1. Lot計算機(リスクサイズに基づく取引量計算 2. リスク計算機(ロットサイズに基づくリスク量) 3. リスク/リワードレシオ (R/R) 4. 注文のアクティベーション トリガー + Buy StopLimit / Sell StopLimit 5. 仮想 SL / TP レベル (隠しSL、TP: ブローカーには見えない) 6.  Smart SL / エントリー レベル: バ
    Pro Arbitrage EA   trades based on Arbitrage Strategy. The strategy is like a scalping technology but on three cross currency pairs at the same time. Each trade basket involves three pairs (all open at the same time) and they will close at once when any desired profit reaches. The strategy has no SL technically because all opened currencies are hedged. SL can happen if high slippages on order execution on the broker side. So the strategy is one of the safest ones in the world. Using the EA : U
    -25% discount ($149 -> $111) Everything for chart Technical Analysis indicator mt5 in one tool Draw your supply demand zone with rectangle and support resistance with trendline and get alerts to mobile phone or email alert -  Risk reward indicator mt5 Video tutorials, manuals, DEMO download   here .   Find contacts on my   profile . 1.   Extended rectangles and trendlines Object will be extended to the right edge of the chart when price will draw new candles on chart. This is rectangle extend
    Exp COPYLOT CLIENT for MT5
    Vladislav Andruschenko
    3.95 (21)
    MT5のトレードコピー機は、МetaТrader5プラットフォームのトレードコピー機です 。 それは間の 外国為替取引をコピーします   任意のは 、MT5 - MT5、MT4 - MT5   COPYLOT MT5版の アカウント (またはを MT4 - MT4   MT5 - MT4   COPYLOT MT4版用) 信頼できるコピー機! MT4のバージョン 完全な説明   +DEMO +PDF 購入する方法 インストールする方法     ログファイルの取得方法     テストと最適化の方法     Expforex のすべての製品 МТ4ターミナルでトレードをコピーすることもできます(   МТ4   -   МТ4、МТ5   -   МТ4   ):   MT4のCOPYLOT CLIENT このバージョンには、端末間 МТ5   -   МТ5、МТ4   -   МТ5が含まれ ます。 ディールコピー機は、2/3/10端末間でディール/ポジションをコピーするために作成されます。 デモ口座と投資口座からのコピーがサポートされています。 プログラムは、複数の端末
    ワンクリックで取引できるトレーディングパネル。ポジションと注文の操作!チャートまたはキーボードから取引。 当社の取引パネルを使用すると、チャートから直接シングルクリックで取引を実行でき、標準の MetaTrader コントロールよりも 30 倍高速に取引操作を実行できます。 パラメータと関数の自動計算により、トレーダーにとって取引がより速く、より便利になります。 グラフィックのヒント、情報ラベル、取引取引に関する完全な情報はチャート MetaTrader にあります。 MT4のバージョン 完全な説明   +DEMO +PDF 購入する方法 インストールする方法     ログファイルの取得方法     テストと最適化の方法     Expforex のすべての製品 手動取引用の取引パネル。チャート(チャートウィンドウ)またはキーボードから取引できます。  開閉、リバース、ロックポジションと注文を処理する МetaТrader5 のメインオーダーのトレーディングコントロールパネル:売買、売却、売却、売却、売却、閉じる、削除、修正、トレーリングストップ、ストップロス、takep
    EA DIDI アラート - ATM システム検針器 金融市場で最高の取引機会を活用するのに役立つツールをお探しですか? 次に、ATM SystemsのDIDI Alert - Agulhadas Detectorは、DIDI INDEXを通じてDidi Aguiarの強力なNeedles Setup取引戦略を使用する市場で唯一のアドバイザーであり、この戦略の他の専任アドバイザーとは異なり、利用可能なさまざまなリソースを備えていることを知っておく必要があります。非常に完成度が高く、機能的で実用的です。ボリンジャーバンドのニーズ、トレンド、空き状況を特定し、「完全なニーズ」が検出されると、プッシュ通知や電子メールを介してアラートを発します。また、ボリンジャーバンドの結果を迅速かつ簡単に表示するための直感的なグラフィカルダッシュボードも提供します。分析。 DIDI Alert は最先端の人工知能を使用して開発され、コードのすべての行が最適化および洗練され、最大限のパフォーマンスと精度を保証します。さらに、DIDI Alert は、世界最大かつ最も信頼できる取引コミュニティである MQ
    Unlimited Trade Copier Pro MT5 is a tool to copy trade remotely to multiple MT4, MT5 and cTrader accounts at different computers/locations over internet. This is an ideal solution for you if you are a signal provider and want to copy your trades to other receivers globally on your own rules. One provider can copy trades to multiple receivers and one receiver can get trade from multiple providers as well. The provider can even set the subscription expiry for each receiver, so that receiver will n
    Botトークンや管理者権限の必要なしに、メンバーであるすべてのチャンネルからシグナルをコピーして、MT5に直接送信します。 多くの機能を提供しながら、ユーザーを考慮して設計されています この製品は、使いやすい視覚的に魅力的なグラフィカルインターフェースで提供されています。設定をカスタマイズして、数分で製品を使用開始できます! ユーザーガイド + デモ  | MT4バージョン | Telegramバージョン デモを試してみたい場合は、ユーザーガイドを参照してください。 DiscordからMT5への変換は、ストラテジーテスターで動作しません。 DiscordからMT5への変換の特長 メンバーである任意のチャンネルからコピーします。BotトークンやチャットIDは不要です リスク%または固定ロットを使用して取引 特定のシンボルを除外 すべてのシグナルをコピーするか、コピーするシグナルをカスタマイズします すべてのシグナルを認識するための単語やフレーズを設定します(デフォルトは99%のシグナルプロバイダーに適用されます) コピーするタイミングと日時の設定をカスタマイズします 一度に
    DrawDown Limiter
    Haidar, Lionel Haj Ali
    5 (18)
    Drawdown Limiter EA You are in the right place if you were searching for Drawdown control, Drawdown limiter, Balance protection, Equity Protection or Daily Drawdown Limit related to Prop Firm, FTMO, or Funded account trading, or if you want to protect your trading account. Have you suffered from controlling your drawdown when trading funded accounts? This EA is meant for you. Prop firms usually set a rule called “Trader Daily Drawdown”, and if it is not respected, you are disqualified.  I am an
    取引パネルは注文の管理に限定されています - ボタンを使用して開かれたものと、ユーザーによって開かれたものの両方です。 シンプルで便利なコレクション。 バイヤーを補完します。 Gold Stuff インジケーターと併用することをお勧めします。 単一注文として取引を設定し、距離のあるグリッドを構築します。 標準グリッドを作成するには、10000 などの大きな距離を設定するだけです。 リアルタイム結果はこちらからご覧いただけます。 設定と個人的なボーナスを得るために、購入後すぐに私に連絡してください!   設定 新しいシリーズを開く - 注文の新しいシリーズのオン/オフの開始。 Lot miltiplier - 次の注文のロット乗数。 TP - ピップで利益を得る。 SL - 最初の注文からのピップ単位のストップロス。 トレイル スタート - トレーリング ストップの有効化。 トレイル ステップ - トレーリング ストップを有効にしたときの価格からの距離。 DD 削減アルゴリズム - 利益のある最後の注文が損失のある最初の注文シリーズでクローズされる場合のドローダウン削減
    -25% discount ($199 -> $149) Advanced trading tool: One click smart orders that execute under your conditions Developed by trader for trading community:  position size calculator (lot size), open position after price action, strategy builder, set and forget trading, mobile notifications... Risk Management -  Risk percentage position size calculator, gain percentage, target risk reward ratio, spread and commissions are included in calculations 7 Advanced order types  - Set and forget trading w
    Ultimate MT5 to Telegram (UMT) sends controlled trades (via symbol, magic, comment) to your telegram channel. It sends open and closed trades, including pending orders and TP/SL modifications, along with chart screenshots, to any telegram channel. Additionally, you can send trade reports of open trades and summary profit/pip reports for day, week, or month. You can customize the design of the trade actions or reports with variables and emoticons.  A beautiful panel allows you to visualize all
    Grid Manual MT5
    Alfiya Fazylova
    4.85 (13)
    「Grid Manual」は、注文のグリッドを操作するための取引パネルです。 ユーティリティはユニバーサルで、柔軟な設定と直感的なインターフェイスを備えています。 それは、損失を平均化する方向だけでなく、利益を増やす方向でも注文のグリッドで機能します。 トレーダーは注文のグリッドを作成して維持する必要はありません。 すべてが「Grid Manual」によって行われます。 注文を開くだけで十分であり、「Grid Manual」は注文のグリッドを自動的に作成し、非常に閉じるまでそれに付随します。 完全な説明とデモバージョン ここ。 ユーティリティの主な機能と機能 ユーティリティは、モバイル端末から開かれた注文を含め、あらゆる方法で開かれた注文を処理します。 「制限」と「停止」の2種類のグリッドで機能します。 グリッド間隔の計算には、固定と動的(ATRインジケーターに基づく)の2つの方法で機能します。 オープンオーダーグリッドの設定を変更できます。 チャート上の各注文グリッドの損益分岐点を表示します。 各注文グリッドの利益率を表示します。 ワンクリックでグリッドから収益性の高い注文を閉じるこ
    YuClusters
    Yury Kulikov
    4.93 (43)
    Attention: You can view the program operation in the free version  YuClusters DEMO .  YuClusters is a professional market analysis system. The trader has unique opportunities to analyze the flow of orders, trade volumes, price movements using various charts, profiles, indicators, and graphical objects. YuClusters operates on data based on Time&Sales or ticks information, depending on what is available in the quotes of a financial instrument. YuClusters allows you to build graphs by combining da
    Trader Evolution
    Siarhei Vashchylka
    5 (3)
    " Trader Evolution " - A utility designed for traders who use wave and technical analysis in their work. One tab of the utility is capable of money management and opening orders, and the other can help in making Elliott wave and technical analysis. Manual (Be sure to read before purchasing) | Version for MT4 Advantages 1. Trading in a few clicks. Immediate and pending orders are available in the panel 2. Money management. The program automatically selects the appropriate lot size 3. Simpli
    Local Trade Copier EA は、MAMまたはPAMMアカウントを必要とせずに、外部ソースからのトレードシグナルを実行する必要がある、または同時に複数のアカウントを管理する必要がある個々のトレーダーまたはアカウントマネージャー向けのソリューションです。最大8つのマスターアカウントから無制限のスレーブアカウントにコピーします [ インストールガイド | アップデートガイド | トラブルシューティング | FAQ | すべての製品 ] 100%セルフホスト インストールと使用が簡単 インストーラー、構成ファイル、サーバー、メモリパイプ、DLLは使用されていません EAを永久に使用するための1000回のアクティベーション ローカル実行、ネットワーク遅延なし それはあなたがこれまでに必要とするすべての機能を実装します: 最大8つのマスターアカウントと無制限のスレーブアカウント すべてのブローカーおよびDD / NDD / ECN / STP実行で動作します 異なる口座通貨の口座で動作します ライブアカウントとデモアカウントの間で区別なく機能します マスターアカ
    作者のその他のプロダクト
    Multi-currency and multitimeframe Heikin Ashi indicator. Shows the current state of the market. On the scanner panel you can see the direction, strength and number of bars of the current trend. The Consolidation/Reversal candles are also shown using color. You can specify any desired currencies and periods in the parameters. Also, the indicator can send notifications when the trend changes or when reversal and consolidation candles (dojis) appear. By clicking on a cell, this symbol and period wi
    Multicurrency and multi-timeframe indicator Inside Bar (IB). In the parameters, you can specify any desired currencies and timeframes. The panel displays the last found Inside Bar (and Mother Bar) pattern, the current price position and the breakout of the levels of the Mother and Inside Bars. You can set the size and color for bars and text in the cells. The indicator can also send notifications when levels are broken. By clicking on a cell with a period, the specified symbol and period will b
    Multi-currency and multitimeframe Heikin Ashi indicator. Shows the current state of the market. On the scanner panel you can see the direction, strength and number of bars of the current trend. The Consolidation/Reversal candles are also shown using color. You can specify any desired currencies and periods in the parameters. Also, the indicator can send notifications when the trend changes or when reversal and consolidation candles (dojis) appear. By clicking on a cell, this symbol and period wi
    Multicurrency and multitimeframe modification of the Fractals indicator. Displays the last two fractals — their sequence (and which one is broken), or the distance between them. You can specify any desired currencies and timeframes in the parameters. Also, the panel can send notifications on a fractal's breakout. By clicking on a cell with a period, this symbol and period will be opened. This is MTF Scanner. The key to hide the dashboard from the chart is "D" by default. Parameters Calculatio
    相対力指数 (RSI) インジケーターのマルチ通貨およびマルチタイムフレームの変更。パラメータで任意の通貨とタイムフレームを指定できます。また、パネルは買われすぎレベルと売られすぎレベルを越えたときに通知を送信できます。ピリオドのあるセルをクリックすると、このシンボルとピリオドが開きます。これが MTF スキャナーです。 ダッシュボードをチャートから非表示にするキーは、デフォルトでは「D」です。 通貨強度メーター (CSM) と同様に、ダッシュボードは、指定された通貨を含むペア、またはその通貨を基本通貨とするペアを自動的に選択できます。インジケーターは、「ペアのセット」で指定されたすべてのペアで通貨を検索します。他のペアは無視されます。そして、これらのペアに基づいて、この通貨の合計 RSI が計算されます。そして、その通貨がどれだけ強いか弱いかを確認できます。 パラメータ RSI Period — 平均期間。 RSI Applied price — 価格タイプ。 Clear the chart at startup — 起動時にチャートをクリアします。 Set of
    This is an indicator of trading sessions  that can display all levels (Open-High-Low-Close) for four sessions. The indicator can also predict session levels. Sessions can be drawn with lines or rectangles (empty or filled), lines can be extended to the next session. You can easily hide/show each session by pressing hotkeys (by default '1', '2', '3', '4'). You can see ASR (Average Session Range) lines  (default hotkey 'A'). This is similar to the ADR calculation, only it is calculated based on t
    Multicurrency and multitimeframe modification of the Commodity Channel Index (CCI) indicator. You can specify any desired currencies and timeframes in the parameters. Also, the panel can send notifications when crossing overbought and oversold levels. By clicking on a cell with a period, this symbol and period will be opened. This is MTF Scanner. The key to hide the dashboard from the chart is "D" by default. Parameters CCI Period — averaging period. CCI Applied price — price type. Clear
    Time Scale for MT5
    Taras Slobodyanik
    4.88 (17)
    The indicator draws the time scale on the chart. You can specify the time offset, adjust the size and font to display on the chart ( it is displaying your local time on your chart instead of MT time ). You can also select the desired format for displaying the date and time. You may be interested in my other product , which contains a more advanced version of the Time Scale . Parameters Hours (time shift) — time shift (hours); Minutes (time shift) — time shift (minutes); Show time on mouse — sh
    FREE
    ストキャスティクス オシレーターのマルチ通貨およびマルチタイムフレームの変更。パラメータで任意の通貨とタイムフレームを指定できます。パネルには、シグナルとメイン (ストキャスティクス クロスオーバー) のラインの現在の値と交差点が表示されます。また、インジケーターは、買われすぎレベルと売られすぎレベルを横切るときに通知を送信できます。ピリオド付きのセルをクリックすると、このシンボルとピリオドが開きます。これが MTF スキャナーです。 通貨強度メーター (CSM) と同様に、ダッシュボードは、指定された通貨を含むペア、またはその通貨を基本通貨とするペアを自動的に選択できます。インジケーターは、「ペアのセット」で指定されたすべてのペアで通貨を検索します。他のペアは無視されます。これらのペアに基づいて、この通貨の合計ストキャスティクスが計算されます。そして、その通貨がどれだけ強いか弱いかを確認できます。 ダッシュボードをチャートから非表示にするキーは、デフォルトでは「D」です。 パラメータ %K Period — K ラインの期間。 %D Period — D ラインの期間。
    Stochastic Oscillator displays information simultaneously from different periods in one subwindow of the chart. Parameters %K Period — K-period (number of bars for calculations). %D Period — D-period (period of first smoothing). Slowing — final smoothing. Method — type of smoothing. Price field — stochastic calculation method . Timeframes for Stochastic — list of periods, separated by a space or comma or semicolon. Number of bars for each period — the number of bars displayed for each period.
    ZigZag Lines MTF
    Taras Slobodyanik
    4.27 (11)
    Multi timeframe ZigZag indicator. It displays the support/resistance horizontal lines and their breakouts, as well as draws the current targets of the market. It can also display lines of the Fractals indicator and candles from other periods (up to Quarterly).  The indicator redraws the last (current) point, and in some cases can change the last 2-3 points. All lines are drawn as objects (not indicator buffers, but there is a possibility to receive the data for the EA ). When used in an Exp
    News Dashboard MT4
    Taras Slobodyanik
    4.43 (7)
    This dashboard displaying current news from ForexFactory.com (calendar FFC) and from the Investing.com website . You can sort news by impact and by country, and display them on the chart with one click. By holding down the 'Ctrl' key, you can select several different 'currencies' or 'impacts' to sort. Also, this utility shows not only the forecast, but also the actual values ​​after they appear on the site. You can set a separate notification for each news. You can read the news using your EA
    ADX Dashboard
    Taras Slobodyanik
    5 (4)
    ADX インジケーターは、トレンドとその強さを判断するために使用されます。価格の方向は +DI と -DI の値で示され、ADX 値はトレンドの強さを示します。+DI が -DI より上であれば、市場は上昇傾向にあり、反対であれば下降傾向にあります。ADX が 20 より下であれば、明確な方向性はありません。インジケーターがこのレベルを突破するとすぐに、中程度の強さのトレンドが始まります。40 を超える値は、強いトレンド (下降トレンドまたは上昇トレンド) を示します。 平均方向性指数 (ADX) インジケーターの複数通貨および複数時間枠の変更。パラメータで任意の通貨と時間枠を指定できます。また、インジケーターは、トレンドの強さのレベルが交差したとき、および +DI と -DI のラインが交差したときに通知を送信できます。ピリオドの付いたセルをクリックすると、このシンボルと期間が開きます。これが MTF スキャナーです。 通貨強度メーター (CSM) と同様に、ダッシュボードは、指定された通貨を含むペア、またはその通貨を基本通貨とするペアを自動的に選択できます。インジケーター
    Multi timeframe ZigZag indicator. It displays the support/resistance horizontal lines and their breakouts, as well as draws the current targets of the market. It can also display lines of the Fractals indicator and candles from other periods (up to Quarterly).  The indicator redraws the last (current) point, and in some cases can change the last 2-3 points. All lines are drawn as objects (not indicator buffers, but there is a possibility to receive the data for the EA ). When used in an Exp
    Lines Profit Loss
    Taras Slobodyanik
    4.82 (22)
    インジケーターは現在のシンボルの利益(損失)を表示します。 線を自由にドラッグ&ドロップして現在の損益を表示できます。 パラメーター Calculation in money or in points — 損益をポイントまたは金額で計算します。 Add pending orders to calculate — 計算では未決注文を考慮します。 Magic Number (0 - all orders on symbol) — 特定の注文を評価する必要がある場合のマジック ナンバー。 Offset for first drawing (points from the average price) — 最初の開始時の平均価格からのラインのオフセット。 Decimal places for calculating the Sum — 合計を表示するための小数点以下の桁数。 Decimal places for calculating the Percentage — パーセンテージを表示するための小数点以下の桁数。 Tuning チューニング Color of the
    FREE
    This is an indicator of trading sessions  that can display all levels (Open-High-Low-Close) for four sessions . The indicator can also predict session levels. Sessions can be drawn with lines or rectangles (empty or filled), lines can be extended to the next session. You can easily hide/show each session by pressing hotkeys (by default '1', '2', '3', '4'). You can see ASR (Average Session Range) lines  (default hotkey 'A'). This is similar to the ADR calculation, only it is calculated based on
    Multicurrency and multi-timeframe indicator Inside Bar (IB). In the parameters, you can specify any desired currencies and timeframes. The panel displays the last found Inside Bar (and Mother Bar) pattern, the current price position and the breakout of the levels of the Mother and Inside Bars. You can set the size and color for bars and text in the cells. The indicator can also send notifications when levels are broken. By clicking on a cell with a period, the specified symbol and period will b
    インジケーターは現在のシンボルの利益(損失)を表示します。 線を自由にドラッグ&ドロップして現在の損益を表示できます。 パラメーター Calculation in money or in points — 損益をポイントまたは金額で計算します。 Add pending orders to calculate — 計算では未決注文を考慮します。 Magic Number (0 - all orders on symbol) — 特定の注文を評価する必要がある場合のマジック ナンバー。 Offset for first drawing (points from the average price) — 最初の開始時の平均価格からのラインのオフセット。 Decimal places for calculating the Sum — 合計を表示するための小数点以下の桁数。 Decimal places for calculating the Percentage — パーセンテージを表示するための小数点以下の桁数。 Tuning チューニング Color of the
    FREE
    Multicurrency and multitimeframe modification of the Fractals indicator. Displays the last two fractals — their sequence (and which one is broken), or the distance between them. You can specify any desired currencies and timeframes in the parameters. Also, the panel can send notifications on a fractal's breakout. By clicking on a cell with a period, this symbol and period will be opened. This is MTF Scanner. The key to hide the dashboard from the chart is "D" by default. Parameters Calculati
    ADX インジケーターは、トレンドとその強さを判断するために使用されます。価格の方向は +DI と -DI の値で示され、ADX 値はトレンドの強さを示します。+DI が -DI より上であれば、市場は上昇傾向にあり、反対であれば下降傾向にあります。ADX が 20 より下であれば、明確な方向性はありません。インジケーターがこのレベルを突破するとすぐに、中程度の強さのトレンドが始まります。40 を超える値は、強いトレンド (下降トレンドまたは上昇トレンド) を示します。 平均方向性指数 (ADX) インジケーターの複数通貨および複数時間枠の変更。パラメータで任意の通貨と時間枠を指定できます。また、インジケーターは、トレンドの強さのレベルが交差したとき、および +DI と -DI のラインが交差したときに通知を送信できます。ピリオドの付いたセルをクリックすると、このシンボルと期間が開きます。これが MTF スキャナーです。 通貨強度メーター (CSM) と同様に、ダッシュボードは、指定された通貨を含むペア、またはその通貨を基本通貨とするペアを自動的に選択できます。インジケーター
    Multicurrency and multitimeframe modification of the ZigZag indicator. Displays the current direction of the market, the height of the last movement, the number of bars in this movement and the breaking of the previous point of the ZigZag (horizontal line). This is MTF Scanner. You can specify any desired currencies and timeframes in the parameters. Also, the panel can send notifications when the ZigZag changes direction or when there was a breakthrough of the previous point. By clicking on a
    Multicurrency and multitimeframe modification of the ZigZag indicator. Displays the current direction of the market, the height of the last movement, the number of bars in this movement and the breaking of the previous point of the ZigZag (horizontal line). This is MTF Scanner. You can specify any desired currencies and timeframes in the parameters. Also, the panel can send notifications when the ZigZag changes direction or when there was a breakthrough of the previous point. By clicking on a
    Symbol Manager or Grid Manager, designed to group orders into one position (by symbol and by direction). This utility will be useful to multi-currency traders, who can have multiple orders on several pairs. You will be able to see the total number of lots, the total profit, and set virtual stop loss and virtual take profit. To set a real TP (or SL), you must first set the virtual value, and then enter the command in this cell: "set". If you want to set real TP/SL for all orders at once, then en
    This dashboard displays current news from three sources: from the ForexFactory.com website (FFC calendar), from the Investing.com website and the Economic Calendar from mql5.com. You can sort news by impact and by country, and display them on the chart with one click. By holding down the 'Ctrl' key, you can select several different 'currencies' or 'impacts' to sort. Also, this utility shows not only the forecast, but also the actual values ​​after they appear on the site. You can set a separate
    MA Dashboard
    Taras Slobodyanik
    4.5 (2)
    移動平均 (MA) インジケーターのマルチ通貨およびマルチタイムフレームの変更。ダッシュボードでは、インジケーターの現在の状態 (Fast MA と Slow MA のブレイクアウトとタッチ (価格別)、および MA ライン同士の交差 (移動平均クロスオーバー)) を確認できます。パラメーターでは、任意の通貨とタイムフレームを指定できます。また、インジケーターは、価格がラインに触れたことやラインが交差したことについて通知を送信できます。ピリオド付きのセルをクリックすると、このシンボルと期間が開きます。これは MTF スキャナーです。チャート上で複数のダッシュボードを実行できます。 インジケーターは、現在のチャートに Fast MA と Slow MA ラインを表示します。チャートの MA タイムフレームを選択し、他のタイムフレーム (MTF MA) から MA を監視できます。2 セットの MA のホットキーは、デフォルトでは「1」と「2」です。 ダッシュボードをチャートから非表示にするキーは、デフォルトでは「D」です。 パラメーター Fast MA Averag
    Multicurrency and multitimeframe modification of the indicator Bollinger Bands. On the dashboard you can see breakouts and touches of the Bollinger Bands. In the parameters you can specify any desired currencies and timeframes. The indicator can also send notifications when the price touches the Bollinger Bands, when the current volatility changes (expands or falls), and when the price touches all the bands. By clicking on a cell with a period, this symbol and period will be opened. This is MTF
    ストキャスティクス オシレーターのマルチ通貨およびマルチタイムフレームの変更。パラメータで任意の通貨とタイムフレームを指定できます。パネルには、シグナルとメイン (ストキャスティクス クロスオーバー) のラインの現在の値と交差点が表示されます。また、インジケーターは、買われすぎレベルと売られすぎレベルを横切るときに通知を送信できます。ピリオド付きのセルをクリックすると、このシンボルとピリオドが開きます。これが MTF スキャナーです。 通貨強度メーター (CSM) と同様に、ダッシュボードは、指定された通貨を含むペア、またはその通貨を基本通貨とするペアを自動的に選択できます。インジケーターは、「ペアのセット」で指定されたすべてのペアで通貨を検索します。他のペアは無視されます。これらのペアに基づいて、この通貨の合計ストキャスティクスが計算されます。そして、その通貨がどれだけ強いか弱いかを確認できます。 ダッシュボードをチャートから非表示にするキーは、デフォルトでは「D」です。 パラメータ %K Period — K ラインの期間。 %D Period — D ラインの期間。
    Multi-currency and multi-timeframe indicator MACD. The dashboard can display both the Traditional (true) MACD and the MACD which is built into MetaTrader. On the panel you can see the current state of the indicator — the direction of movement of the MACD lines, their intersection and a pop-up window with the indicator chart. In the parameters you can specify any desired pairs-symbols and timeframes. The scanner can also send notifications about lines crossing each other and about lines crossing
    相対力指数 (RSI) インジケーターのマルチ通貨およびマルチタイムフレームの変更。パラメータで任意の通貨とタイムフレームを指定できます。また、パネルは買われすぎレベルと売られすぎレベルを越えたときに通知を送信できます。ピリオドのあるセルをクリックすると、このシンボルとピリオドが開きます。これが MTF スキャナーです。 ダッシュボードをチャートから非表示にするキーは、デフォルトでは「D」です。 通貨強度メーター (CSM) と同様に、ダッシュボードは、指定された通貨を含むペア、またはその通貨を基本通貨とするペアを自動的に選択できます。インジケーターは、「ペアのセット」で指定されたすべてのペアで通貨を検索します。他のペアは無視されます。そして、これらのペアに基づいて、この通貨の合計 RSI が計算されます。そして、その通貨がどれだけ強いか弱いかを確認できます。 パラメータ RSI Period — 平均期間。 RSI Applied price — 価格タイプ。 Clear the chart at startup — 起動時にチャートをクリアします。 Set of
    Multicurrency and multitimeframe indicator of the Standard Deviation Channel. Displays the current direction of the market. On the panel, you can see breakouts and touches (by price) of the levels of the linear regression channel. In the parameters, you can specify any desired currencies and timeframes. Also, the indicator can send notifications when levels are touched. By clicking on a cell, this symbol and period will be opened. This is MTF Scanner. The key to hide the dashboard from the char
    フィルタ:
    Chukwuka Nwadei
    17
    Chukwuka Nwadei 2023.11.02 20:44 
     

    Good conversion of the popular Original Tetris. You are lacking two keys for rotation of the moving blocks! You must add two keys for rotating the blocks. One for Clockwise rotation and the other for Anti-Clockwise rotation. How soon can modify and release the upgrade?

    Taras Slobodyanik
    65465
    開発者からの返信 Taras Slobodyanik 2023.11.02 21:08
    Hello. In this case, the word 'must' is not appropriate here. You should say 'could you please' :)
    kakou
    67
    kakou 2021.06.30 17:25 
     

    Absolutely awesome. useless but awesome :)

    レビューに返信
    バージョン 1.40 2023.08.19
    1) Some code optimization.
    バージョン 1.30 2020.07.03
    1) Added checking Esc key to exit the menu.
    2) Added check for simultaneous pressing of the cursor keys.
    バージョン 1.20 2020.07.01
    1) Fixed canvas binding to the right corner of the chart.
    バージョン 1.10 2020.07.01
    1) Code optimization.