Currency Market Health
- インディケータ
- Cuong Le Van
- バージョン: 1.1
- アクティベーション: 5
This indicator includes:
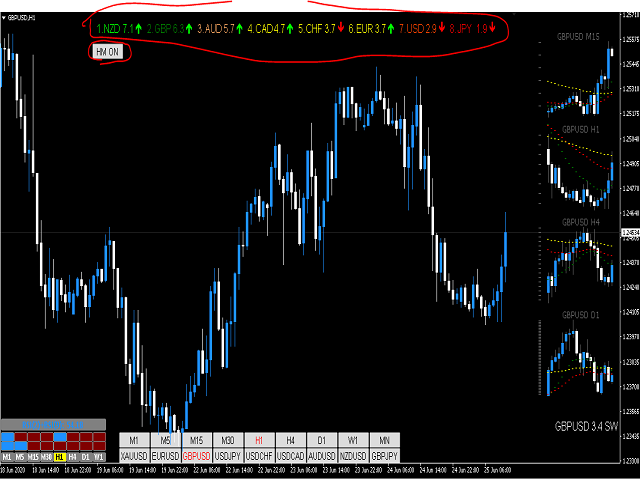
- Currency Strength Meter
My currency strength meter gives you a quick visual guide to which currencies are currently strong, and which ones are weak. The meter measures the strength of all forex cross pairs and applies calculations on them to determine the overall strength for each individual currency.
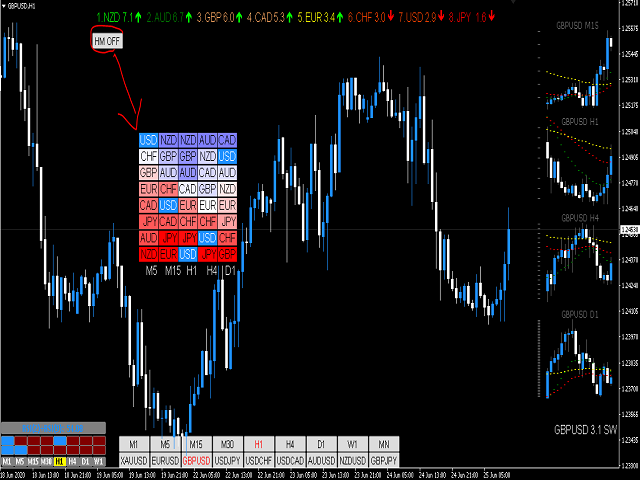
- Live Heat Map — Multiple time frame
Heat Map makes it easy to spot strong and weak currencies in real-time.Get an overview of how world currencies are traded against each other.