AnaliTickDemo
- ユーティリティ
- Aleksandr Prozorov
- バージョン: 1.0
AnaliTickDemo is a demo version of AnaliTick.
AnaliTIck is a financial instrument analysis and testing program based on the Metatrader5 platform. The object of analysis is the sequence of changes in the prices of Bid and Ask - ticks. The program may be useful to developers of scalping advisers and strategies, those who work on the news.
The demo version differs from the full one in fewer filters and strategies. The analyzed period is one - the current trading day and two previous days. The strategies have disabled the ability to organize a trailing stop. The program does not work in the Strategy Tester. Like the full version, the program is placed in the terminal’s Experts folder and installed on a real or demo account.
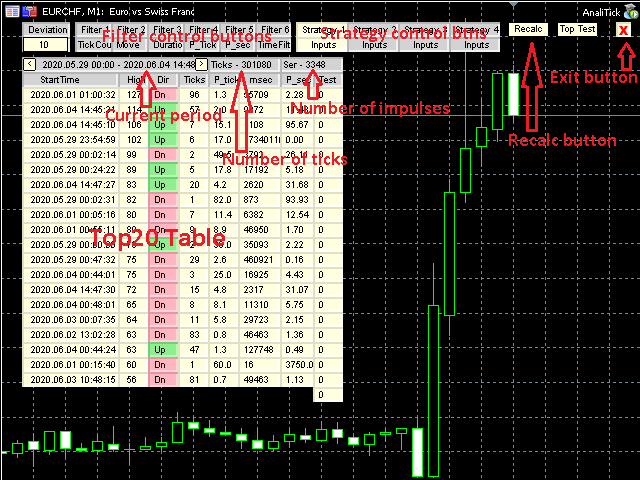
When the program is loaded, an array of ticks for the financial instrument, on the chart of which the program is installed, is filled for the current period. The analyzed period is 4 trading days. On this period, impulses are determined - a series of consecutive ticks, representing the movement of the price up or down in a short period of time. The 20 strongest pulses are generated in the Top20 table.
To configure images and texts, use the input parameters CellSize and Font_Size.
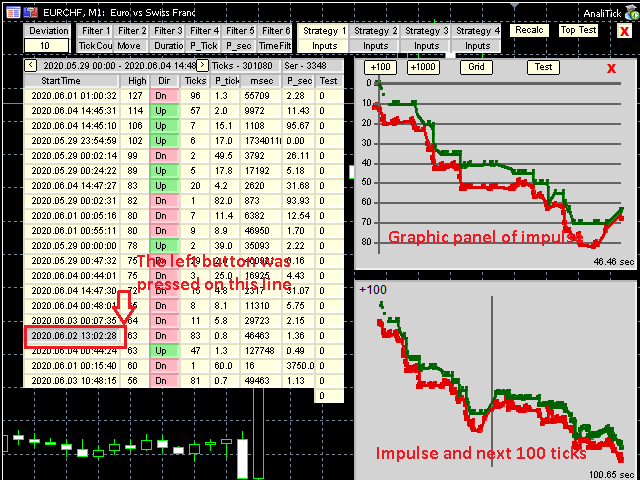
Each impulse from Top20 can be viewed as a time chart of Bid and Ask prices. To do this, move the cursor to the corresponding line and press the left mouse button. A panel with a Bid and Ask price chart will appear to the right of the table. The panel has 4 control buttons.
+ 100 - show momentum and 100 next ticks
+ 1000 - show momentum and 1000 next ticks
Grid - turns on / off the grid.
Test - impulse testing (more about tests will be discussed below).
To go to the previous and next period, use the <and> keys in the table header.
In the upper left corner of the table is a cell labeled Deviation, and below it is an editable field. This deviation is the permissible deviation from the direction of the pulse as a percentage of the pulse. Suppose the program found an impulse at which the price increased by 50 points, a deviation - 10. If one or more ticks appear now, lowering the price by no more than 5 points, then the impulse will still be considered upward.
The user is given the opportunity to use up to 3 pulse filters, setting the maximum and minimum value of one of the pulse parameters. To activate the filters, move the cursor to the name of the filter - Filter1, Filter2, etc. Click the left mouse button. To change filter parameters, click the button below the filter name. Purpose of filters:
- Filter1 - Number of ticks per pulse
- Filter2 - Change in price in an impulse
- Filter3 - Pulse duration in seconds
After changing the deviation and filters, it is necessary to recalculate the pulses. To do this, use the Recalc key on the right side of the table header.
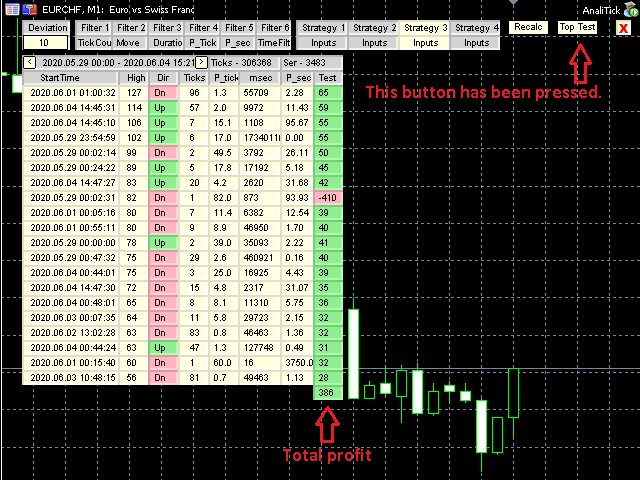
The generated pulses from Top20 can be tested individually or all together. First you need to select and configure a strategy. At the top of the table there are four cells with the names of strategies - Strategy1 and Strategy2 .. To select a strategy, move the cursor to its name and left-click. Impulse testing consists in opening positions or placing pending orders.
Strategy1 - A position is opened against the direction of the impulse.
Strategy2 - A position is opened in the direction of the impulse.
In both strategies, you can set StopLoss and TakeProfit, the values of which can be determined in points or percent of the momentum. Test results are given as the number of points in plus or minus. To set the parameters, press the Inputs key under the name of the strategy. Single testing is performed by pressing the Test key on the graphical pulse panel. Group testing is done by pressing the TopTest key at the top of the screen. Group test results are displayed in the Test column of the pulse table.
All attached screenshots explain the full version. The demo is missing some of the graphic and control elements.

