Comparator
- インディケータ
- Stanislav Korotky
- バージョン: 1.6
- アップデート済み: 24 11月 2021
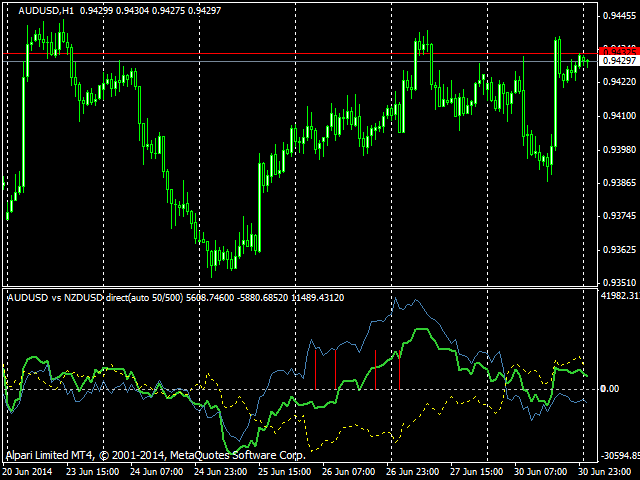
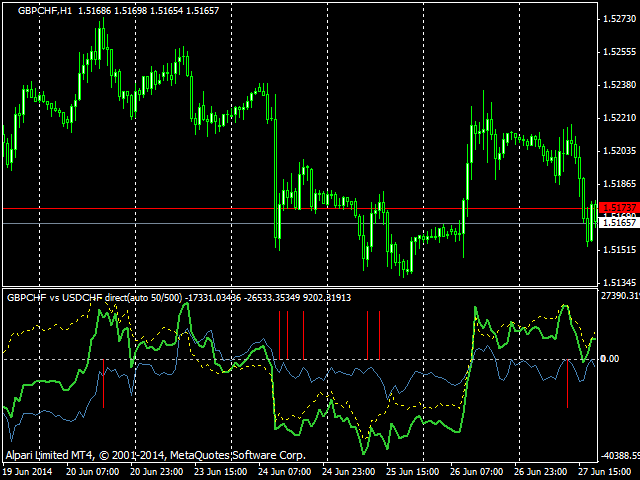
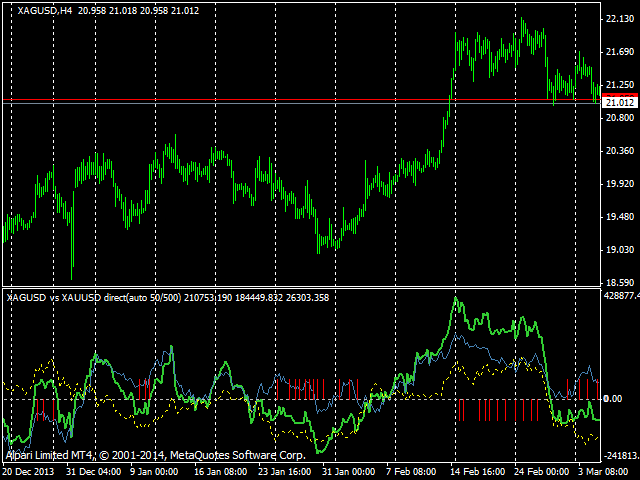
This indicator compares the price changes during the specified period for the current symbol and other reference symbol. It allows to analyze the similar movements of highly correlated symbols, such as XAUUSD and XAGUSD, and find their occasional convergences and divergences for trading opportunities.
The indicator displays the following buffers:
- light-green thick line - price changes of the current symbol for TimeGap bars;
- light-blue thin line - price changes of the reference symbol (LeadSymbol) for TimeGap bars;
- yellow dotted line - the difference between these two lines;
- red histogram - buy (positive) or sell (negative) signals on bars where the difference is greater than the value of PriceGap points of the current symbol;
Price changes are calculated as value/profit/loss (in the account currency, or in USD if not connected) of buying 1 lot of the current symbol between TimeGap bars ago and the current bar.
Parameters
- LeadSymbol - the reference symbol to compare with the current; default - empty string - comparison is not performed;
- TimeGap - time period (number of bars) to use in the analysis of joint movement; default - 50;
- PriceGap - threshold for buy and sell signals, when the difference between current and reference symbol price changes exceeds the value of PriceGap points for 1 lot of current symbol; the value of the specified PriceGap points is output to the log;
- Inverse - enable/disable explicit inversion of the reference symbol prices; default - false; if true - overrides the Autodetect setting;
- Autodetect - enable/disable automatic detection of direct or inverse relation of current symbol and reference symbol; default - true;
- ScalingMode allows to additionally scale the chart of the reference symbol according to the ratio of the monthly volatilities of the symbols (1) or required margins ratio (2); When ScalingMode is set to 3, the scaling mode based on the ratio of the price change percentage is used; when the mode 3 is enabled, the minimum difference between the symbols in percents (for example, 0.01 for 1%) should be specified in the ScalingHint parameter as the threshold for signal generation. It is also possible to set a custom scaling coefficient in the ScalingHint parameter, where a hint on scaling is initially displayed. For this to work, the ScalingMode must be equal to 4;
- MA, if not 0, enables the use of smoothing of the specified period during the price calculation of the TimeGap bar. By default, MA=0, and the bar closing prices are used, similar to the first version;
- Notification parameters for the formation of new signals (red histogram) and zero level crossing by the difference lines (yellow dotted): EnableNotifications (enable/disable flag), SignalSound (sound file name), ZeroCrossingSound (sound file name). If the sound files are not specified (blank), an Alert is displayed. If the sound file is specified, it is played instead of the alert. Signals are generated on newly closed first bars.
Please note, that comparison of most Forex symbols will effectively display their crosses (if they exist). Thus, comparison only makes sense for the pairs that are interdependent, i.e. the dependent symbol repeats the movements of the reference symbol (to some extent). During the analysis of such pairs, make sure to select the correct analysis direction, i.e. the indicator is located on the chart of the dependent symbol and the leading symbol is selected as the reference symbol and not vice versa. Otherwise, inverted signals will be received.












FANTASTIC INDICATOR HAS GREAT POTENTIAL - SOME OTHER AUTHORS CHARGE USD200 FOR THE SAME THING!