BlueDigitsFx Easy 1 2 3 System MT5
- インディケータ
- Ziggy Janssen
- バージョン: 1.26
- アップデート済み: 12 9月 2020
- アクティベーション: 6
Telegram Channel & Group : https://t.me/bluedigitsfx
V.I.P Group Access: Send Payment Proof to our Inbox
Recommended Broker: https://eb4.app/BDFXOsprey
*All In One System Indicator, Breakthrough solution for any Newbie or Expert Trader!
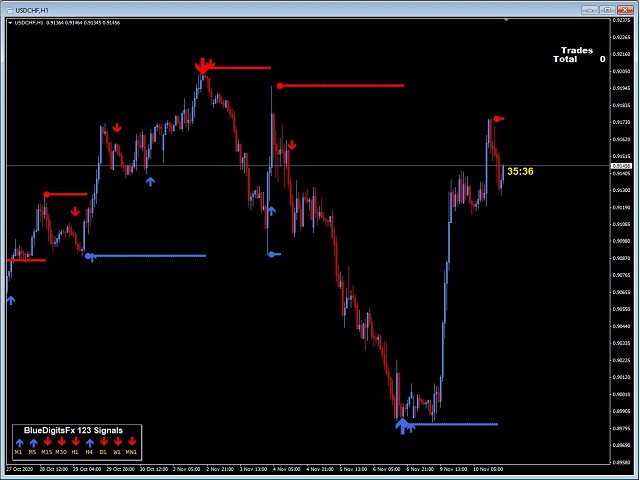
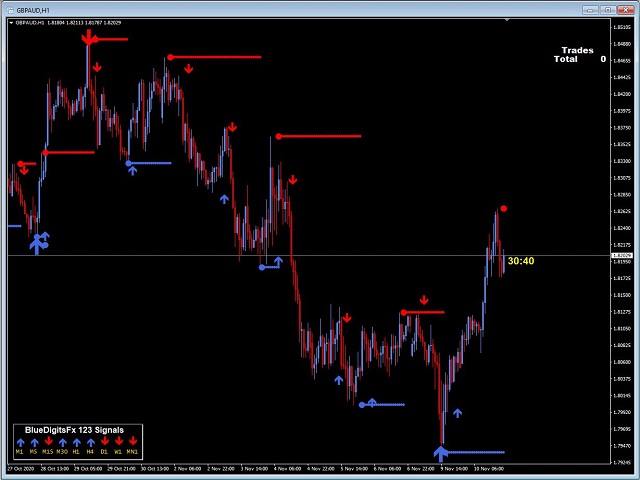
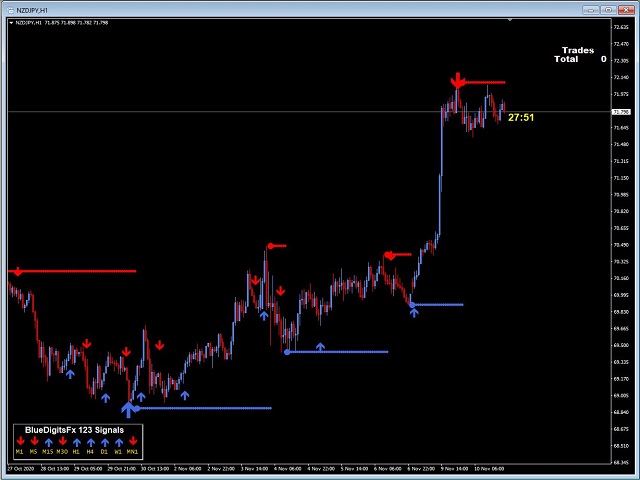
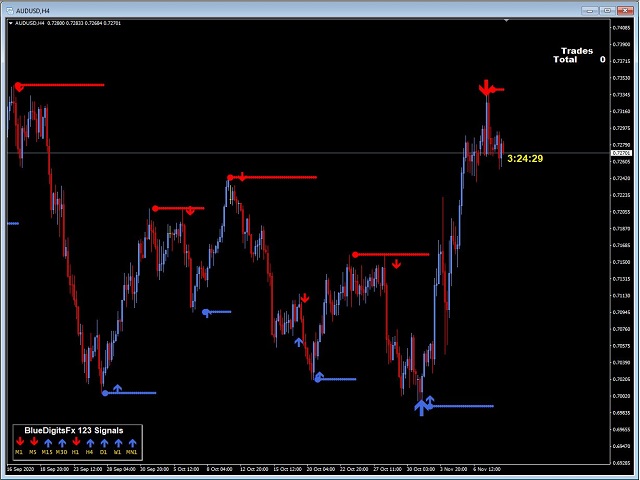
The BlueDigitsFx Easy 123 System makes it easy to identify important areas of market structure. It alerts you to changes in market structure which typically occur when a reversal or major pullback are about to happen.
The indicator identifies breakouts and price momentum. Every time a new high is formed near a possible exhaustion point the indicator draws a Big Arrow Indicating Step #1 of the 123 System.
It then alerts you when price shifts the opposite direction and breaks through that area of structure, creating a breakout and start of a possible reversal of the trend or indicating a pullback.
The BlueDigitsFx 123 System has been developed to provide a super convenient & effective charting solution and visual for Newbie and Expert Traders!
Features
- Big Arrow - will pinpoint strong zigzag levels for potential reversals.
- Little Arrow - 100% Non Repaint Trend Indicator with Super Accurate Signals.
- Support and Resistance Dots - Identify Strong SR zones within seconds. (with MultiTimeFrame option)
- All Indicators have an ON/OFF option
- Works on all Symbols and Timeframes
- Integrated Desktop, Mobile and Email alerts built in
- Perfect For Newbie Traders And Expert Traders
Strategy & How To Trade With The BlueDigitsFx Easy 123 System
- Swing Traders
- Put the settings for Daily Timeframe Support / Resistance dots
- Then go down to the 4h or the 1h timeframe and trade away from the formed dots
- (Close Profits as you please, or close profits at lower low, or higher high, or wait for opposite arrow signal for exit)
- Intra Day Traders
- Put the settings for 4 hour Timeframe Support / Resistance dots
- Then go down to the 1 hour or the 15m timeframe and trade away from the formed dots
- (Close Profits as you please, or close profits at lower low, or higher high, or wait for opposite arrow signal for exit)
- Scalpers
- Put the settings for 15 minutes Timeframe Support / Resistance dots
- Then go down to the 5m or the 1m timeframe and trade away from the formed dots
- (Close Profits as you please, or close profits at lower low, or higher high, or wait for opposite arrow signal for exit)
Stoploss and Take Profit
Your stop should always go just above the most recent high or below the most recent low. If the 123 system is correctly identifying a shift in market structure price will rarely move back above/below the most recent peak. The size of your stop will be dependent on how aggressive the last move to create the recent high was.
Take profit is up to the individual but using a 1.5:1 or 2:1 risk to reward is easily achievable. Entering 2 trades and having one to trail trail along with price just above/below new breakouts as they are drawn on the chart can achieve 5:1 and higher risk reward.
Download the free demo for the EURUSD and AUDUSD symbol and experience it before you buy it!
See how BIG some of the moves are after the 123 formation has been triggered!
Free MT4 Demo download : https://www.mql5.com/en/market/product/47431
Always Follow The Higher Timeframes of the 123 Algorithm for a higher accuracy rate.
Ps: This Is An Extremely Powerful System Combined with our Spike And Strike Indicator for swing traders and scalpers.


This is a great following indicator for trend following, and the author was fast on his response! just a reminder if you want to purchase this indicator, you as a trader have to do your own diligence to study the market, and find what works best for you! This indicator just makes your job a lot easier, and it has worked for me!