• 概要
  • レビュー (19)
  • コメント (40)
  • 最新情報

Trading box Rectangle extender

5

Place price Alerts on extended Rectangles and Trendlines - Risk reward indicator mt4

Extend Rectangles & Trendlines to the right edge

Mark your supply demand zones with extended rectangle and draw support resistance lines with extended trendline.

Find detailed manuals here. Find contacts on my profile.

MT4 Rectangle extender indicator will simplify and make it easier for you to analyze markets and stay notified about important events. When you extend rectangle or trendline the action buttons will be shown (Alert, Engulf, Risk Reward). You will receive alert and mobile push notification when price touch or break (engulf) rectangle or trendline.


Smart Rectangle Extender or Zone Extender

Rectangles and Trendlines will be extended into future with one click. Rectangle pip size, name and prices will be displayed around rectangle


Price Alert and Engulf Alert

Price Alert and Engulf detection in Rectangle extender are supported with MT4 mobile push notifications and email alert. Phone alert or smartphone alert for price level alert  Trendline alert and line alert. rectangle reader indicator


Flat trendline

Button that will change trendline to horizontal flat trendline


Show object name

Text button that gives options to display rectangle or trendline text in all possible spots around or inside object. This works for non-extended rectangles and trendlines where we would like to have object name displayed in suitable place around or inside object. (rectangle indicator, rectangle zone)


Risk reward ratio calculation

You can enable Risk Reward (RR) calculation with click on button Buy RR or Sell RR. Horizontal line will be displayed, and it will show Risk Reward ratio and pip distance between extended rectangle and horizontal RR line. You can select and move horizontal RR line to get your risk reward calculation information


Pip distance in brackets

It calculates pip difference between Bid and object price and display it at the right side of extended object


Timeframe colors for extended rectangle and trendline (multi timeframe analysis support)

User can define different colors for timeframe groups (separately for rectangles or trendlines):

Color 1: M1, M5, M15

Color 2: M30, H1, H4

Color 3: D1, W1, MN


Indicator customization

Trader can customize MT4 rectangle extender indicator with input properties. You can change colors, font size, element display position and some other features


Input property Description
Bring Alerted chart to the top True or false
Show pip distance in brackets True or false
Show object prices Show or hide prices on the right side of rectangle or trendline
Show buttons Show or hide buttons on the right side of selected rectangle or trendline
Show rectangle pip size Show or hide rectangle pip size
Fill extended rectangle When you extend rectangle, it will be filled with background color if variable is set to true
Supply rectangle color Default color for rectangles that are extended above bid price
Demand rectangle color Default color for rectangles that are extended below bid price
Extended trendline color We can set default color of extended trendline
Extended trendline style We can set default line style of extended trendline
Risk Reward text alignment We can display Risk Reward ratio calculation on left or right side of chart


レビュー 19
prequest01
584
prequest01 2022.12.27 14:28 
 

Excellent tool, very versatile and powerful for your TA. The author is very responsive and takes personal feedback to quickly implement. A must have indicator in your trading arsenal.

Gaved
229
Gaved 2022.02.01 20:45 
 

Great work. Recommended.

Lungisa Gina
38
Lungisa Gina 2021.12.22 11:43 
 

I trade Support & Resistance Zones and this tool is a game-changer for me.

おすすめのプロダクト
Oscillator helps determine the direction of the market Shows the direction of the price movement and is painted in the appropriate color. Allows you to conduct trend and counter trend trading It works on all timeframes, on any currency pairs, metals and cryptocurrency Can be used when working with binary options Distinctive features Does not redraw; Simple and clear settings; It works on all timeframes and on all symbols; Suitable for trading currencies, metals, options and cryptocurrency (Bitco
FREE
The indicator shows De Mark patterns and gives trading signals in the form of arrows and alerts. Shows De Mark lines on the history of quotes. Has a multiframe., Can show DeMark patterns of higher timeframes on lower timeframes. Has a switchable function for displaying fractals. Trading signals are accompanied by sound alerts, as well as sending them to mail and mobile devices.
The Nihilist 5.0 Indicator includes Forexalien and Nihilist Easy Trend trading strategies and systems. It is composed of an MTF Dashboard where you can analyze the different input possibilities of each strategy at a glance. It has an alert system with different types of configurable filters. You can also configure which TF you want to be notified on your Metatrader 4 platform and Mobile application The indicator has the option to view how could be a TP and SL by using ATR or fixed points, even
NAM Divergences
NAM TECH GROUP, CORP.
5 (1)
MT4マルチタイムフレームの発散と売られ過ぎ/売られ過ぎの検出インジケーター。 特徴 -チャートコントロールパネルで完全にカスタマイズ可能で、完全な相互作用を提供します。 -必要な場所でコントロールパネルを表示および非表示にします。 -資本化されていない発散に関するリアルタイムの情報。 -売られ過ぎ/売られ過ぎの状況に関するリアルタイム情報。 -定期的な発散に関するリアルタイムの情報。 -隠れた発散に関するリアルタイム情報。 -発散検出に使用できる発振器:AO、RSI、CCI、MACD、STOCH、RMI、TDI、RSIOMA。 -通知サービス(画面アラート|プッシュ通知)。 概要 発散取引を使用すると、弱体化傾向や勢いの逆転を見つけるのに役立ちます。トレンドが続くためのシグナルとして使用できる場合もあります。私たちのツールは、チャートを可能な限りクリーンに保つために、表示と非表示の可能性を備えた驚くほど快適で直感的なコントロールパネルで、すべての時間枠で同時に発散検出を提供します。 選択した履歴期間に、買われ過ぎと売られ過ぎの
Bermaui Channel
Muhammad Elbermawi
5 (27)
This is a price channel that shows five important price levels on the chart. Those levels are: 1. The Highest High (HH) of the previous x bars. 2. The Highest Low (HL) of the previous x bars. 3. The Center Line. 4. The Lowest High (LH) of the previous x bars. 5. The Lowest Low (LL) of the previous x bars. How does Bermaui Channels Captures Overbought  area Think of the distance between HH and HL levels as an overbought area. When the price candles or bars crosses the HL to the upside this
Master Phi is an indicator based on Fibonacci numbers. It analyzes the percentage values returning the proportion of the Golden Section. You can customize values and set custom levels so you will create your personal Trading. The attention on the minimums and the maximums of timeframes allows accurate analysis in order to intercept very precisely the trading levels after the various impulse movements. Input Values Time_Frame to analyze LEVELS SETTINGS 9 levels (in percentage) 9 colors LINE SET
Algo Trading Indicaor  With this indicator , you’ll have zones and trends that hight probability the price will reverse from it. so will gives you all the help that you need  Why should you join us !?  1-This indicator is logical since it’s working in previous days movement , to predict the future movements. 2-Algo trading indicator will help you to draw trends which is special and are too strong than the basics trend , trends will change with the frame time that you work on . 3-We can
Global Trend Indicator, shows the signals for entry. Displays both entry points and the trend itself. Shows statistically calculated moments for entering the market with arrows. When using the indicator, the risk factor can be optimally distributed. Settings: Uses all one parameter for settings. Choosing a parameter, it is necessary to visually resemble it so that the appropriate graph has a projection of extremes. Parameters: Length - the number of bars for calculating the indicator.
Colored indicator of the linear channel based on the Fibonacci sequence. It is used for making trading decisions and analyzing market sentiment. The channel boundaries represent strong support/resistance levels, as they are the Fibonacci proportion levels. Users can select the number of displayed lines of channel boundaries on the chart by means of the input parameters. Attaching multiple instances of the indicator to the chart with different calculation periods leads to displaying a system of c
CMI - Profit from trending and ranging markets. The CMI indicator is a two-part system used to trigger both trend and counter-trend trades, that has been introduced by Daniel Fernandez in an article published in Currency Trading Magazine (August 2011 issue). It is a simple, yet effective indicator, which gauges whether the market has behaved in a choppy (non-directional) manner or trending (directional) manner. CMI calculates the difference between the most recent bar's close and the close n bar
Heikin-Ashi-Sniper is a perfect addition to your portfolio. It is meant to be traded on EURUSD on H1 Timeframe. It uses Heikin-Ashi High and Low/High of Monthly timeframe to determine optimal entry signals while having a reasonably low drawdown More EA´s will be published shortly to complete the Portfolio. The EA Trades not very frequently it waits for the right chance and places the order. The rest of the time, your capital is free to be traded on other strategies Please see backtest results
FREE
Description  Fibo Retracement  is an indicator that automatically plots  Fibonacci  levels in the main chart based on Close prices , which distinguishes it from the Fibo Levels indicator that plots levels based on High/Low prices. Thus, using both indicators provides the trader with the opportunity of determining support and resistance zones by Fibonacci! The levels are calculated and plotted over a certain interval using the number of bars specified by the user. The user can display Fibonacci l
Professional 0 Lag MAs Trend Sensor Indicator MAtsi is a trend sensor indicator , where 2 MA-s operates simultaneously . It is designed to cover a wider range of dynamic trends, where MAi is not so effective. Included averages are described in MAi indicator code section. MAtsi indicator can run many instances, for all time frames at once, so you can test and compare results with different settings. It is very fast and has, like all our indicators, a built-in " slider history testing " techn
Indicator. Zones of support and resistance levels The most reliable tool in the hands of any technical analyst is support and resistance levels.It is these levels that magically work in the market, because the price then bounces off them, on the contrary, gaining maximum acceleration, punching them and striving for a new price point.However, in practice, many beginners face enormous difficulties in building them.This is due to the fact that the price may react quite differently to them, and ofte
Summary This indicator is based on RSI and Momentum indicators. It also considers moving averages of these two indicators. The three indicators have adjustable settings. The arrows do not repaint since the indicator only uses confirmed values and waits for the candle to close before painting an arrow. The indicator is also able to alert when arrows appear. There are 3 types of alerts - Popup, Email and Mobile Push Notifications. The arrows can be used in the EA and the inputs can also be optimiz
FREE
Introducing our innovative trading indicator, designed to transform the way you analyze price movements. The [Indicator Name] goes beyond traditional methods by dynamically drawing two distinct trends on the chart. The space between these trends acts as a unique reflection surface, providing valuable insights into potential market reversals and trend continuations. Key Features: Dual Trend Drawing: Automatically draws two trends on the chart, creating a visually distinctive analysis of price mov
KFX Symbol Changer
Peter Kariuki Thande
4.67 (3)
KFX SMA: Symbol Changer + Moving Average (3x) + ATR + RSI + Candle Timer. This indicator allows you to create a Symbol list and change between symbols of the current chart or Timeframe by selecting the appropriate button. On Chart there are three(3) multi timeframe Moving Averages shown (selected by you), ATR Value MTF ( selected by you -  helps with setting SL and TP), RSI Value MTF (selected by you) and a Candle Timer.   Features: - Symbol Changer : Change Symbol and Timeframe of Chart.   (
FREE
️️ Attention:      The price will soon be raised to what it was before ($500).      Please go to the comments to see daily signals charts from the indicator. And contact me on tel gram to show you how it work.       No more losses with this indicator, test it for years ago and see if there is losses in one day results. but before testing it please see the explaining video down here.    FxBears Powers is working on all forex pairs, metals, commodities, futures, indices, energies, crypto, and ev
The  Market Sessions Indicator for MT4 helps you predict market turnarounds  by detecting major supply and demand areas. These pivot points tend to occur after a new session has started and the previous one is still open. It is also used to gauge how many points or pips the market moves on average during a session. This helps us to place better our take profits and stop losses. The indicator works on all forex pairs, gold, silver, commodities, stocks, indices and any other instrument that your b
Japanese Candlesticks Monitor scans Japanese candlesticks. It shows a vertical line and a name of a probable candlestick pattern. The indicator is constantly updated, and new patterns are added. Your feedback is most welcome. I have just started working on the indicator, and your opinions are highly appreciated . The indicator does not work on history data . If the indicator has not been launched at a candle opening, that candle is not considered. This means that the indicator works in real time
-25% discount ($149 -> $111) Everything for chart Technical Analysis indicator mt4 in one tool Draw your supply demand zone with rectangle and support resistance with trendline and get alerts to mobile phone or email alert -  Risk reward indicator Video tutorials, manuals, DEMO download   here .  Find contacts on my   profile . 1.   Extended rectangles and trendlines Object will be extended to the right edge of the chart when price will draw new candles on chart. This is rectangle extender or
「一目均衡表」の専門的な使い方は、一目均衡表を正しく解釈してグラフを分析することです! はトレーダーが価格グラフ上の指定された点間の比率を素早く簡 単に測定できるようにするグラフィックプログラムです。この時間と価格の指標は、MT4 プラットフォームの一目の戦略に従って図表を分析するための基本的なツールです。この ツールを使用すると、 非常に短期間での価格波だけでなく、時間波の洞察に満ちた完全な 分析も可能になります。分析の実行に費やされる労力は、エクセルを使用して実行される 同様の測定および計算と比較して、何度も最小限に抑えられます。指標は、一目均衡表戦 略を使用するトレーダーの知識と経験、およびそれらの期待を考慮して設計されています。 提示されたツールは私たちの仕事の結果です。 指標のモジュール構造により、論理的な順序で分析を実行できます。このプロセスは過去 の波に関するデータを収集することから始まり、それが将来の市場の動きを計算するため の基礎となります。 計算で考慮されるデータは、予測の正確さにとって非常に重要です。 この操作は最小限に抑えられ、即座に測定値が得られます。 この測
GreenBoxインディケーター とは、 ダウ理論 を用いリアルタイムに 高値・安値を分析 し、 ダウ理論に基づいたトレンドラインを自動描画 したり、 押し安値や戻り高値をブレイク後の到達予測地点をBox形式で自動描画 するインディケーターです。FXやGoldなどの様々な銘柄で機能します。 高値・安値はnBarsパラメーター(初期値=5)で決まりますが、対応する移動平均線(nBarsの4~5倍のSMAやEMA)を同時に表示するとトレンド転換の様子がより分かり易くなります。 (無料のGreenBoxのデモ版をダウンロードして、 いつもトレードで利用している移動平均線 と それに対応するnBars値(=移動平均線÷(4~5))のGreenBox で効果があるか試してみて欲しいです。) nBars=5 -> 20SMA, 21EMA, 25SMA, 25EMA nBars=13 -> 55EMA, 52SMA nBars=34 -> 144EMA, 136SMA <参考> ver.1.9で大幅に改善した通知機能を活用することで、 音声実況解説(GreenBoxがリアルタイムに各種分析
A top-quality from the famous XSuper Trend indicator. It is completely loyal to the original algorithm, and implements many useful features Which includes Trend Indicators as Filters like MACD,CCI and Alligator. The Chefs Super Trend Plus Indicator is a great way to identify the current market trend. The indicator shows a clear distinction between uptrends and downtrends. The indicators has optional filters for sound signal. Suitable for the following trending pairs: EUR/USD, GBP/USD, USD/JPY,
Considering the main theories of Forex (Dow Theory, support lines, chart patterns, and Fibonacci retracements), It tells you the price range where whales (large investors) are likely to appear. You can trade at the price points that professionals also aim for. You no longer have to warry about where to aim next. We are live-streaming the actual operation of the system. Please check for yourself if it is usable. Please check it out for yourself. https://www.youtube.com/@ganesha_forex We do no
The indicator draws trend lines based on Thomas Demark algorithm. It draws lines from different timeframes on one chart. The timeframes can be higher than or equal to the timeframe of the chart, on which the indicator is used. The indicator considers breakthrough qualifiers (if the conditions are met, an additional symbol appears in the place of the breakthrough) and draws approximate targets (target line above/below the current prices) according to Demark algorithm. Recommended timeframes for t
This indicator is specially made for binary options trading. The indicator works well with seven currency pairs. EURUSD, AUDCAD, GBPUSD,  AUDUSD, EURGBP, EURJPY, NZDUSD. The indicator works with online daily quotes on mt4 as well as offline OTC quotes for weekend trading. Provided your options broker offer OTC facility for weekend trading. It is profitable with or without martingale. But more profitable with martingale of 6 steps maximum. It work on 1 minute, 5 minutes, 15 minutes and 30 minutes
Moving indicator. It is written so that it doesn't signal when two moving averages cross. Easy to operate.  It performed well on European and Asian currencies. Designed for long-term and medium-term types of trading.  Индикатор мувингов. Написан так что даёт сигнал при пересечении двух скользящих. Прост в управлении.   Хорошо себя показал на европейских и азиатских валютах.  Рассчитан  на долгосрочный тип торговли. 
FREE
Индикатор рисует уровни Фибоначчи с выделенными Ценовыми метками.При установке индикатора на график необходимо создать трендовую линию с именем указанным в поле" Unique name of trend line to place fib on ". По умолчанию имя=" Unique name of trend line to place fib on"  =     "+"    .В индикаторе можно заменить уровни фибоначчи по своему усмотрению.Также меняются цвет,стиль,толщина линий и т. д.
FREE
Trend Transition is a hybrid indicator, as it is based on signals from several well-known products: RSI and MA. MA is a trend indicator of the average true range, which determines the range of minimum and maximum price fluctuations, as well as closing prices. RSI is an indicator of the family of oscillators. The indicator helps to calculate the oversold and overbought levels of a trading instrument. When a trend changes, the Trend Transition indicator uses a color alarm: blue - when changing
このプロダクトを購入した人は以下も購入しています
現在26%オフ 初心者やエキスパートトレーダーに最適なソリューション! このインジケーターは、独自の機能と新しい計算式を取り入れた、ユニークで高品質、かつ手頃な価格のトレーディングツールです。たった1枚のチャートで28の為替ペアの通貨強度を読み取ることができます。新しいトレンドやスキャルピングチャンスの引き金となるポイントを正確に特定することができるので、あなたのトレードがどのように改善されるか想像してみてください。 ユーザーマニュアルはこちら  https://www.mql5.com/en/blogs/post/697384 これが最初の1本、オリジナルだ! 価値のないクローンを買わないでください。 特別な サブウィンドウの矢印で強い通貨の勢いを表示 GAPがあなたのトレードを導く! 基準通貨や気配値が売られすぎ・買われすぎのゾーン(外相フィボナッチレベル)にあるとき、個別チャートのメインウィンドウに警告表示。 通貨がレンジの外側から反落した場合、プルバック/リバーサルのアラート。 クロスパターンの特別なアラート 複数の時間枠を選択可能で、トレンドを素早く
74% discount for the next 10 buyers (original price $605): 1 left Get a 50% bonus by buying (or even renting) any of our products. After buying (or renting), send a message for more information. 3 Indicators in 1 indicator Strategy based on price action Made specifically for the best forex currency pairs Can be used in the best time frame of the market at a very reasonable price This indicator is basically 3 different indicatos . But we have combined these 3 indicators in 1 indicator so th
まず第一に、この取引インジケーターは再描画されず、再描画されず、遅延しないことを強調する価値があります。これにより、手動取引とロボット取引の両方に理想的なものになります。 ユーザーマニュアル:設定、入力、戦略。 アトミックアナリストは、価格の強さとモメンタムを利用して市場でより良いエッジを見つけるためのPA価格アクションインジケーターです。ノイズや誤ったシグナルを除去し、取引ポテンシャルを高めるための高度なフィルターを備えています。複雑なインジケーターの複数のレイヤーを使用して、アトミックアナリストはチャートをスキャンし、複雑な数学的計算をシンプルなシグナルと色に変換します。これにより、どのような初心者トレーダーでも理解して使用し、一貫した取引の決定を行うことができます。 「アトミックアナリスト」は、新規および経験豊富なトレーダー向けにカスタマイズされた包括的な取引ソリューションです。プレミアムインジケーターとトップノッチの機能を1つの取引戦略に組み合わせ、すべてのタイプのトレーダーにとって汎用性のある選択肢にします。 デイリートレーディングとスキャルピング戦略:高
A key element in trading is zones or levels from which decisions to buy or sell a trading instrument are made. Despite attempts by major players to conceal their presence in the market, they inevitably leave traces. Our task was to learn how to identify these traces and interpret them correctly. Reversal First Impulse levels (RFI)   -  Version MT5                INSTRUCTIONS                 RUS                 ENG                                       R ecommended to use with an indicator   -  
TPSpro TRENDPRO  - is a trend indicator that automatically analyzes the market and provides information about the trend and each of its changes, as well as giving signals for entering trades without redrawing! The indicator uses each candle, analyzing them separately. referring to different impulses - up or down impulse. Exact entry points into transactions for currencies, crypto, metals, stocks, indices!  -  Version MT5               DETAILED DESCRIPTION        /       TRADING SETUPS           
ご紹介   クォンタム トレンド スナイパー インジケーターは 、トレンド反転を特定して取引する方法を変革する画期的な MQL5 インジケーターです。 13年以上の取引経験を持つ経験豊富なトレーダーのチームによって開発されました。     クォンタムトレンドスナイパーインジケーター   は、非常に高い精度でトレンドの反転を識別する革新的な方法で、あなたのトレーディングの旅を新たな高みに押し上げるように設計されています。 ***Quantum Trend Sniper Indicatorを購入すると、Quantum Breakout Indicatorを無料で入手できます!*** クォンタム ブレイクアウト インジケーターは、トレンドの反転を特定するとアラートを発し、矢印を示し、3 つのテイクプロフィットレベルを提案します。 初心者トレーダーにもプロのトレーダーにも適しています。 量子EAチャネル:       ここをクリック MT5のバージョン:       ここをクリック 推奨事項: 期間: すべての時間枠。最良の結果を得るには、
An exclusive indicator that utilizes an innovative algorithm to swiftly and accurately determine the market trend. The indicator automatically calculates opening, closing, and profit levels, providing detailed trading statistics. With these features, you can choose the most appropriate trading instrument for the current market conditions. Additionally, you can easily integrate your own arrow indicators into Scalper Inside Pro to quickly evaluate their statistics and profitability. Scalper Inside
Advanced Supply Demand
Bernhard Schweigert
4.92 (310)
現在33%オフ 初心者にもエキスパートトレーダーにも最適なソリューション このインジケーターは独自の機能と新しい公式を多数内蔵しており、ユニークで高品質かつ手頃な取引ツールです。このアップデートでは、2つの時間枠ゾーンを表示できるようになります。より長いTFだけでなく、チャートTFとより長いTF(ネストゾーンを表示)の両方を表示できます。すべてのSupply Demandトレーダーの皆さんのお気に召すはずです。:) 重要情報の公開 Advanced Supply Demandの可能性を最大化するには、 https://www.mql5.com/ja/blogs/post/720245 にアクセスしてください。   エントリーまたはターゲットの正確なトリガーポイントを正確に特定できれば取引がどのように改善されるか想像してみてください。新しい基盤となるアルゴリズムに基づいて構築されているため、買い手と売り手の間の潜在的な不均衡をさらに簡単に特定できます。これは、最も強い需要と供給のゾーンと、過去のパフォーマンス(古いゾーンを表示)がグラフィカルに表現されるためです。これらの機能は、最適
FX Volume
Daniel Stein
4.6 (35)
mql5と Telegramの モーニング・ブリーフィングで、詳細とスクリーンショットを含む毎日のマーケット・アップデートをご覧 ください! FX Volumeは、ブローカーの視点から市場のセンチメントをリアルに洞察する、最初で唯一の出来高インジケーターです。 ブローカーのような機関投資家が外国為替市場でどのようなポジションをとっているか、COTレポートよりもはるかに速く、素晴らしい洞察を提供します。 この情報をチャート上で直接見ることは、あなたの取引にとって真のゲームチェンジャーであり、画期的なソリューションです。 以下のようなユニークなマーケットデータ洞察から利益を得てください。 比率は 、通貨のロングポジションとショートポジションの比率をパーセントで表示します。 比率の変化は 、選択した期間内のロング比率とその変化率を表示します。 Volumes Totalは 、通貨の取引量(ロングとショート)の合計をロット単位で表示します。 Volumes Long :全通貨のロングポジションの取引量を表示します。 Volumes(ショート )は、全通貨のショートポジションの取引量を表示
カスタムMT4インジケーターで外国為替取引を成功させるための秘密を発見してください! 外国為替市場で成功を達成し、リスクを最小限に抑えながら一貫して利益を得る方法を疑問に思ったことはありますか? これがあなたが探している答えです! 取引へのアプローチに革命をもたらす独自のMT4インジケーターを導入できるようにします。 ユニークな汎用性 私たちのインジケータは、RenkoとRangeBarのろうそくのフォーメーションを好むユーザー向けに特別に設計されています。 これらのチャートタイプは多くの経験豊富なトレーダーに好まれていることを理解しています。そのため、私たちのインジケーターはそれらとシームレスに統合され、比類のない市場分析を提供します。 クリアトレンドシグナル 複雑な分析を忘れてください! 私たちのインジケーターは、鮮やかな色と明確なドット構造を利用して、市場の動向を明確に示しています。 赤と青の点は、価格の動きの方向性について疑いの余地がなく、取引の迅速な意思決定を可能にします。 HH/HL HL/LL戦略とのアライメント HH/HLおよびHL/LL構
mql5と Telegramの モーニング・ブリーフィングで、詳細とスクリーンショットを含む毎日のマーケット・アップデートをご覧 ください! FX Power MT4 NGは 、長年の人気を誇る通貨強度計FX Powerの次世代モデルです。 この次世代ストレングスメーターは何を提供するのでしょうか?初代FXパワーの魅力すべて プラス GOLD/XAUの強さ分析 より正確な計算結果 個別に設定可能な分析期間 カスタマイズ可能な計算上限値により、さらに優れたパフォーマンスを実現 もっと見たい人のための特別なマルチインスタンス設定 すべてのチャートでお好みの色を無限に設定可能 数え切れないほどの通知オプションにより、重要なことを見逃すことはありません。 Windows 11とmacOSのスタイルで角を丸くした新しいデザイン 魔法のように動くインジケーターパネル FXパワーの主な機能 すべての主要通貨の強さの完全な履歴 すべての時間枠における通貨の強さの履歴 すべてのブローカーとチャートで同一の計算結果 100%信頼できるリアルタイム計算 -> リペイントなし ドロップダウン・リストから
ご紹介     Quantum Breakout PRO は 、ブレイクアウト ゾーンの取引方法を変革する画期的な MQL5 インジケーターです。 13年以上の取引経験を持つ経験豊富なトレーダーのチームによって開発された Quantum Breakout PROは 、革新的でダイナミックなブレイクアウトゾーン戦略により、あなたの取引の旅を新たな高みに押し上げるように設計されています。 クォンタム ブレイクアウト インジケーターは、5 つの利益ターゲット ゾーンを備えたブレイクアウト ゾーン上のシグナル矢印と、ブレイクアウト ボックスに基づいたストップロスの提案を提供します。 初心者トレーダーにもプロのトレーダーにも適しています。 量子EAチャネル:       ここをクリック MT5バージョン:   ここをクリック 重要!購入後、インストールマニュアルを受け取るためにプライベートメッセージを送ってください。 推奨事項: 時間枠: M15 通貨ペア: GBPJPY、EURJPY、USDJPY、NZDUSD、XAUUSD アカウントの種類: ECN、Raw、また
このインジケータは、手動および自動的な方法でチャートに描かれたハーモニックパターンを検出します。ユーザーマニュアルは、このリンクから参照できます: あなたのレビューを追加し、入手するために私たちに連絡してください。 この製品をmt4で試すための無料版があります。 GartleyおよびNenstarパターンを検出するために使用できます。 https://www.mql5.com/en/market/product/30181 完全なMT4バージョンを購入するには、次の場所から購入できます。 https://www.mql5.com/en/market/product/15212 注 インジケータにはコントロールパネルがあり、すべての(チャート&時間枠)設定が保存されます。チャート上でスペースをより多く確保するために、最小化することができ、他の分析ツールで作業する場合は、すべてのインジケータデータを非表示にするために閉じるボタンを押すことができます。 このインジケータを使用して設定を変更し、移動平均やボリンジャーバンドなどのインジケータを追加すると、編集のテンプレートが自動的に保存され、必
現在20%OFF! 初心者やエキスパートトレーダーのためのベストソリューション! このダッシュボードソフトウェアは、28の通貨ペアで動作しています。それは私達の主要な指標(高度な通貨の強さ28と高度な通貨インパルス)の2に基づいています。それは全体の外国為替市場の大きい概観を与えます。それは、すべての(9)時間枠で28の外国為替ペアのための高度な通貨の強さの値、通貨の動きの速度と信号を示しています。チャート上で1つのインディケータを使用して市場全体を観察し、トレンドやスキャルピングの機会をピンポイントで見つけることができたら、あなたのトレードがどのように改善されるか想像してみてください。 このインディケータには、強い通貨と弱い通貨の識別、潜在的な取引の識別と確認がより簡単になるような機能が搭載されています。このインディケータは、通貨の強さや弱さが増加しているか減少しているか、また、すべての時間枠でどのように機能しているかをグラフィカルに表示します。 新機能として、現在の市場環境の変化に適応するダイナミックなマーケットフィボナッチレベルが追加され、すでに当社のAdvan
このインディケータは、当社の2つの製品 Advanced Currency IMPULSE with ALERT  +   Currency Strength Exotics . のスーパーコンビネーションです。 このインジケーターは全ての時間枠で作動し、8つの主要通貨と1つのシンボルの強弱のインパルスをグラフで表示します。 このインジケータは、金、エキゾチックペア、商品、インデックス、先物など、あらゆるシンボルの通貨強度の加速度を表示することに特化されています。金、銀、原油、DAX、US30、MXN、TRY、CNHなどの通貨強度の加速度(インパルスまたは速度)を表示するために、任意のシンボルを9行目に追加できる、この種の最初のものです。 新しいアルゴリズムに基づいて構築され、潜在的な取引の特定と確認がさらに容易になりました。これは、通貨の強さや弱さが加速しているかどうかをグラフィカルに表示し、その加速の速度を測定するためです。加速すると物事は明らかに速く進みますが、これはFX市場でも同じです。つまり、反対方向に加速している通貨をペアリングすれば、潜在的に利益を生む取
TrendMaestro
Stefano Frisetti
5 (2)
note: this indicator is for METATRADER4, if you want the version for METATRADER5 this is the link:  https://www.mql5.com/it/market/product/108106 TRENDMAESTRO ver 2.4 TRENDMAESTRO recognizes a new TREND in the bud, he never makes mistakes. The certainty of identifying a new TREND is priceless. DESCRIPTION TRENDMAESTRO identifies a new TREND in the bud, this indicator examines the volatility, volumes and momentum to identify the moment in which there is an explosion of one or more of these data a
PRO Renko Systemは、特別にRENKOチャートを取引するために設計された高精度の取引システムです。 これは、様々な取引商品に適用することができる普遍的なシステムです。 システムは効果的に正確な逆転信号へのアクセスを与えるいわゆる市場の騒音を中和する。 表示器は非常に使いやすく、信号の生成に責任がある1つの変数だけがあります。 あなたは簡単にお好みの任意の取引ツールとレンコバーのサイズにツールを適応させることができます。 私はいつもあなたが私のソフトウェアで収益性の高い取引を支援するために余分なサポートを提供する準備ができています! 私はあなたに幸せで収益性の高い取引をしたいです! ご購入後にご連絡ください! 私はあなたに私のレンコチャートジェネレータを送信します。 私はまた、私の個人的な推奨事項やシステムの他のモジュールを無料で共有します!
Volatility Trend System - a trading system that gives signals for entries. The volatility system gives linear and point signals in the direction of the trend, as well as signals to exit it, without redrawing and delays. The trend indicator monitors the direction of the medium-term trend, shows the direction and its change. The signal indicator is based on changes in volatility and shows market entries. The indicator is equipped with several types of alerts. Can be applied to various trading
現在31%オフ! 初心者やエキスパートトレーダーに最適なソリューション! このインジケータは、独自の機能と秘密の数式を組み込んだ、ユニークで高品質かつ手頃な価格のトレーディングツールです。たった1枚のチャートで28の通貨ペアのアラートを表示します。新しいトレンドやスキャルピングチャンスの引き金となるポイントを正確に把握することができるので、あなたのトレードがどのように改善されるか想像してみてください! 新しい基本的なアルゴリズムに基づいて構築されているため、潜在的な取引の特定と確認がより簡単になります。これは、通貨の強さや弱さが加速しているかどうかをグラフィカルに表示し、その加速のスピードを測定するためです。加速すると物事は明らかに速く進みますが、これはFX市場でも同じです。つまり、反対方向に加速している通貨をペアにすれば、利益を生む可能性のある取引を特定することができるのです。 通貨の勢いを示す縦の線と矢印は、あなたの取引の指針となるでしょう。 ダイナミックマーケットフィボナッチ23レベルはアラートトリガーとして使用され、市場の動きに適応します。もしインパルスが黄色
Automated Trendlines
Georgios Kalomoiropoulos
5 (16)
トレンドラインは、外国為替取引におけるテクニカル分析の最も重要なツールです。残念ながら、ほとんどのトレーダーはそれらを正しく描画していません。自動トレンドラインインジケーターは、市場のトレンドの動きを視覚化するのに役立つ本格的なトレーダー向けのプロフェッショナルツールです。 トレンドラインには、強気トレンドラインと弱気トレンドラインの2種類があります。 上昇トレンドでは、外国為替トレンドラインは価格変動の最低スイングポイントを介して描画されます。 少なくとも2つの「最低安値」を接続すると、トレンドラインが作成されます。 下降トレンドでは、トレンドラインは価格変動の最も高いスイングポイントを介して描画されます。 少なくとも2つの「最高値」を接続すると、トレンドラインが作成されます。 トレンドラインが壊れたとき? 弱気のろうそくが強気のトレンドラインの下で閉じ、ろうそくの高さがトレンドラインの上にあるとき、強気のトレンドラインは壊れます。 強気のろうそくが弱気のトレンドラインの上で閉じ、ろうそくの安値がトレンドラインの下にあるとき、弱気のトレ
An extremely convenient indicator that truly makes the process of making money on the exchange easy. It is based on the scientifically rigorous theory of the market developed by the author, the beginning of which is presented here .                The full algorithm of this indicator operation is presented in the article .               The indicator calculates the most probable price movement trajectory and displays it on the chart. Based on the predicted price movement trajectory
Cyclical indicator for trading and predicting the direction of the market. Shows the cyclical behavior of the price in the form of an oscillator. Gives signals for opening deals when rebounding from the upper and lower boundaries of the oscillator. In the form of a histogram, it shows the smoothed strength of the trend. Will complement any trading strategy, from scalping to intraday. The indicator does not redraw. Suitable for use on all symbols/instruments. Suitable time frames for short-term
もちろんです。以下は、提供いただいたテキストの日本語への翻訳です: MT4用の天文学指標をご紹介します:究極の天体トレーディングコンパニオン トレーディング体験を天空の高みに高める準備はできていますか?私たちの革命的なMT4用の天文学指標をご紹介します。この革新的なツールは、複雑なアルゴリズムの力を借りて、類まれなる天文学的洞察と精密な計算を提供します。 あなたの指先で宇宙の情報を: 宝のような天文学的データが明らかになる包括的なパネルをご覧ください。惑星の地理的/太陽中心座標、太陽と地球の距離、星の大きさ、伸び、星座、黄道座標および赤道座標、さらには水平座標まで、それぞれが綿密に計算され美しく表示されています。指標によって生成される垂直線は時間値に対応し、トレーディングの旅に宇宙の視点を提供します。 惑星のラインと関係: グラフを飾る惑星のラインの魔法を体験し、スケールと角度をカスタマイズできます。直感的なコントロールパネルを介して各惑星のラインの表示を簡単に切り替えることができます。指定された時刻範囲内での合会、六分会、四分会、三分会、対会、逆行の指標で天体の関係の芸術を発見してく
Allows multiple indicators to be combined into a single indicator, both visually and in terms of an alert. Indicators can include standard indicators, e.g. RSI, CCI, etc., and also Custom Indicators, even those purchased through Market, or where just have the ex4 file. An early alert is provided, say when 4 out 5 indicators have lined up, and a confirmed alert when all are in agreement. A‌lso features a statistics panel reporting the success of the combined indicator by examining the current cha
ON Trade Waves Patterns Harmonic Elliot Wolfeをご紹介します。これは手動および自動の方法を使用して市場のさまざまなパターンを検出するために設計された高度なインジケーターです。以下はその動作方法です: ハーモニックパターン: このインジケーターは、チャートに表示されるハーモニックパターンを識別できます。これらのパターンは、Scott Carneyの「Harmonic Trading vol 1および2」で説明されているように、ハーモニックトレーディング理論を実践するトレーダーにとって重要です。手動で描画するか、自動検出に頼るかにかかわらず、ON Trade Waves Patternsがお手伝いします。 コントロールパネル: このインジケーターはユーザーフレンドリーなコントロールパネルを備えています。チャートと時間枠の設定を保存し、異なる構成間をスムーズに切り替えることができます。チャートスペースを最大限に活用するために最小化することもできます。他の分析ツールで作業することを好む場合、閉じるボタンをクリックするだけで、すべてのインジケーターデ
WARNING: PRICE IS SUBJECT TO RISE AT ANY TIME. GET YOUR COPY TODAY TO AVOID MORE COST! Dear Traders I am so glad to introduce to you my other tool called the Forex Sniper Entries Indicator. This tool is designed to help serious traders and investors capture big moves in the currency price movements. The philosophy behind this tool is all about winning big and riding the price movement from its beginning until the maximum point. We want to capture those big moves in both down and up markets as mu
How to use Pair Trading Station Pair Trading Station is recommended for H1 time frame and you can use it for any currency pairs. To generate buy and sell signal, follow few steps below to apply Pair Trading Station to your MetaTrader terminal. When you load Pair Trading Station on your chart, Pair Trading station will assess available historical data in your MetaTrader platforms for each currency pair. On your chart, the amount of historical data available will be displayed for each currency pai
このインジケーターは、エリオット波動理論と組み合わせて作動し、2つの方法で使用されます: 自動モード: このモードでは、インジケーターがチャート上の全ての5つのモーティブ波を自動的に検出し、予測とポテンシャルな逆転ゾーンを提供します。また、アラートやプッシュメッセージを生成する能力も備えています。この自動機能により、エリオット波動パターンの識別と分析のプロセスが効率化されます。 手動モード: このオプションは、エリオット波動理論を手動で扱いたいトレーダー向けです。9つの段階を使用して波を描画することができます。各段階は、表示された後に描画されたラインを調整して個別に定義できます。この機能により、手動で波を描画するプロセスがより効率的になります。重要な点として、すべての描画データが将来の参照のためにプラットフォームのデータフォルダに保存されることに注意してください。 パラメータ: Name: インジケーターの名前。 Use_System_Visuals: インジケーターのテーマを有効または無効にして、取引プラットフォーム全体の外観に合わせます。 Explain_Comment: 波の番号
MetaTrend M4
Vahidreza Heidar Gholami
5 (1)
Meta Trend Indicator is an efficient way to forecast and detect the trend in any market. It reveals the trend, support and resistance levels, volatility and the maximum potential target, all in one indicator. To adapt to the price and to decrease consecutive trend failures, the internal trend detector algorithm studies the market and dynamically chooses the right values for the internal parameters. This indicator is a perfect trend filter for any strategy or expert advisor. Features Super Adapti
Gold Trend   - これは優れた株価テクニカル指標です。指標のアルゴリズムは、資産の値動きを分析し、ボラティリティと潜在的なエントリーゾーンを反映しています。 最高の指標シグナル: - 売りの場合 = 赤のヒストグラム + 赤のショートポインター + 同じ方向に黄色のシグナル矢印。 - 買いの場合 = 青のヒストグラム + 青のロングポインター + 同じ方向の水色のシグナル矢印。 インジケータの利点 1. このインディケータは、高い精度でシグナルを発信します。 2. 確定した矢印シグナルは、トレンドが変化したときにのみ再描画されます。 3. どのブローカーのMetaTrader 4取引プラットフォームでも取引できます。 4. あらゆる資産(通貨、金属、暗号通貨、株式、指数など)を取引できます。 5. H1タイムフレーム(中期取引)で取引するのがよい。 6. 各トレーダーがインディケータを自分用に簡単にカスタマイズできるよう、インディケータ設定で個々のパラメータ(TF、色など)を変更できます。 7. このインディケータは、トレーディングシステムの優れた
作者のその他のプロダクト
-25% discount ($149 -> $111) Everything for chart Technical Analysis indicator mt5 in one tool Draw your supply demand zone with rectangle and support resistance with trendline and get alerts to mobile phone or email alert -  Risk reward indicator mt5 Video tutorials, manuals, DEMO download   here .   Find contacts on my   profile . 1.   Extended rectangles and trendlines Object will be extended to the right edge of the chart when price will draw new candles on chart. This is rectangle extend
-25% discount ($199 -> $149) Advanced trading tool: One click smart orders that execute under your conditions Developed by trader for trading community:  position size calculator (lot size), open position after price action, strategy builder, set and forget trading, mobile notifications... Risk Management -  Risk percentage position size calculator, gain percentage, target risk reward ratio, spread and commissions are included in calculations 7 Advanced order types  - Set and forget trading w
-25% discount ($199 -> $149) Advanced trading tool: One click smart orders that execute under your conditions Developed by trader for trading community:  position size calculator (lot size), open position after price action, strategy builder, set and forget trading, mobile notifications... Risk Management -  Risk percentage position size calculator, gain percentage, target risk reward ratio, spread and commissions are included in calculations 7 Advanced order types   - Set and forget trading
-25% discount ($149 -> $111) Everything for chart Technical Analysis indicator mt4 in one tool Draw your supply demand zone with rectangle and support resistance with trendline and get alerts to mobile phone or email alert -  Risk reward indicator Video tutorials, manuals, DEMO download   here .  Find contacts on my   profile . 1.   Extended rectangles and trendlines Object will be extended to the right edge of the chart when price will draw new candles on chart. This is rectangle extender or
Display rectangles and trendlines list  from Trading box  Technical analysis tool. Objects are ordered in the list by   pip distance   that is difference between object price and Bid price. With this tool you will know which chart to look for next trading opportunity. No more switching between charts and searching for trades where price is close to rectangle zone or trendline support resistance level. Sorted Rectangles and Trendlines by pip distance -  If you are trading on multiple charts, the
FREE
Rectangle position changer   tool is used for precise/accurate rectangle positioning by time or price only.   You can move each side of rectangle separately with lines created around selected rectangle. This tool will replace classical grid because it is like dynamical chart grid for rectangle grid. This tool allows you to adjust your rectangles, from all 4 sides, with ease and makes your technical analysis that much faster. This tool is handy when corner points for changing rectangle position a
FREE
Display Order box list from  Trading box  Order Management tool. Find contacts and manual links on my   profile . This dashboard gives you an edge in forex trading because in few seconds you can decide which pair and timeframe is worth to watch more closely. This is how you will not be distracted by all other forex pairs that you trade, and you will not miss great opportunities to trade the best price. Trading Dashboard  (order box overview panel and Trading box Order management extension) Tr
FREE
Place price Alerts   on  extended  Rectangles   and   Trendlines -  Risk reward indicator mt5 Extend Rectangles & Trendlines to the right edge Mark your supply demand zones with extended rectangle and draw support resistance lines with extended trendline. Find detailed manuals   here .  Find contacts on my   profile . MT4 Rectangle extender indicator will simplify and make it easier for you to analyze markets and stay notified about important events. When you extend rectangle or trendline the a
Display rectangles and trendlines list from  Trading box  Technical analysis tool. Objects are ordered in the list by pip distance that is difference between object price and Bid price. With this tool you will know which chart to look for next trading opportunity. No more switching between charts and searching for trades where price is close to rectangle zone or trendline support resistance level. Sorted Rectangles and Trendlines by pip distance -  If you are trading on multiple charts, then th
FREE
Rectangle position changer  tool ( rectangle indicator) is used for precise/accurate rectangle positioning by time or price only. You can move each side of rectangle separately with lines created around selected rectangle. This tool will replace classical grid because it is like dynamical chart grid for rectangle grid. This tool allows you to adjust your rectangles, from all 4 sides, with ease and makes your technical analysis that much faster. This tool is handy when corner points for changi
FREE
Display Order box list from  Trading box  Order Management tool. Find contacts and  manual   links on my   profile . This dashboard gives you an edge in forex trading because in few seconds you can decide which pair and timeframe is worth to watch more closely. This is how you will not be distracted by all other forex pairs that you trade, and you will not miss great opportunities to trade the best price. Trading Dashboard  (order box overview panel and Trading box Order management extension)
FREE
This tool will remove buttons and text labels from the chart, after you remove Trading box Order management or Trading box Technical analysis . You just need to drag this tool to your chart and after cleanup of objects is finished, the tool will remove itself from the chart. Please check images below that present Before and After using the Removal tool. There is also a short YouTube video at the bottom to show how easy it is to clean your chart after using Trading box tools. - input var
FREE
This tool will remove buttons and text labels from the chart, after you remove Trading box Order management or Trading box Technical analysis. You just need to drag this tool to your chart and after cleanup of objects is finished, the tool will remove itself from the chart. Please check images below that present Before and After using the Removal tool. There is also a short YouTube video at the bottom to show how easy it is to clean your chart after using Trading box tools. - input variable "
FREE
フィルタ:
prequest01
584
prequest01 2022.12.27 14:28 
 

Excellent tool, very versatile and powerful for your TA. The author is very responsive and takes personal feedback to quickly implement. A must have indicator in your trading arsenal.

Gaved
229
Gaved 2022.02.01 20:45 
 

Great work. Recommended.

Lungisa Gina
38
Lungisa Gina 2021.12.22 11:43 
 

I trade Support & Resistance Zones and this tool is a game-changer for me.

Frank Langrehr
311
Frank Langrehr 2021.06.20 18:12 
 

must have for every trader to draw your zones and lines, now with the bring chart to front Alert, very helpful, support at the best, I had issue and igor help me a lot, best purchase I ever made here on the market

Fadi88888
232
Fadi88888 2021.05.02 12:34 
 

Very useful tool... I can highly recommend to buy and use it . Also the developer very helpful

ShockMarkets
25
ShockMarkets 2021.04.25 06:40 
 

Combining the 'FLAT' trendline function with the alert line is what superior functionality is all about. I've been wanting that one simple thing, on MT4, for many years. Along with the alert boxes this is shaping up to be a very handy tool. Nice work Igor.

AkiraHank
30
AkiraHank 2021.04.13 05:43 
 

I bought . When I draw a rectangle and set an alert, Engulf..., the description appears on the rectangle. How to not show description, thanks

exzell
169
exzell 2021.04.03 12:59 
 

This tool is super amazing, been super impressed with it from day one and is firmly part of my analysis toolkit, I asked the developer to add thickness to the trendline and less than a week it was done, what a guy, awesome service - what more can I say, its just brilliant

bertotorde
141
bertotorde 2021.02.03 17:30 
 

Perfect. Great tool.

JimMac64
46
JimMac64 2020.09.06 20:00 
 

I purchased the Rectangle Extender and Igor (Developer) could not have been more helpful - What a guy! The indicator works perfectly and I am very impressed with both. I recommend this indicator. Thanks - Jim

削除済み 2020.06.13 09:11 
 

ユーザーは評価に対して何もコメントを残しませんでした

BEN
96
BEN 2020.06.10 22:46 
 

ユーザーは評価に対して何もコメントを残しませんでした

raiinzen
727
raiinzen 2020.06.07 15:07 
 

ユーザーは評価に対して何もコメントを残しませんでした

削除済み 2020.05.30 10:46 
 

ユーザーは評価に対して何もコメントを残しませんでした

teodosy87
293
teodosy87 2020.05.26 20:40 
 

ユーザーは評価に対して何もコメントを残しませんでした

87trader
25
87trader 2020.05.26 19:23 
 

ユーザーは評価に対して何もコメントを残しませんでした

SOMENDRA
14
SOMENDRA 2020.05.24 17:32 
 

ユーザーは評価に対して何もコメントを残しませんでした

削除済み 2020.05.21 18:06 
 

ユーザーは評価に対して何もコメントを残しませんでした

Mamboki
118
Mamboki 2020.05.21 12:04 
 

ユーザーは評価に対して何もコメントを残しませんでした

レビューに返信
バージョン 8.1 2024.04.01
>> button position fixed for Horizontal line buttons display
バージョン 8.0 2024.03.22
- object name change bug fix
バージョン 7.9 2024.03.16
- reported bug fix
バージョン 7.8 2024.03.12
- bug fix: text objects deleted on object property change
バージョン 7.7 2024.02.17
- update
バージョン 7.6 2024.01.13
- NEW input variables:
Resistance trendline color - Above Bid
Support trendline color - Below Bid

TBOM promotional video from trader Kevin Cortese: https://www.youtube.com/watch?v=gUR_juP7n5k
バージョン 7.5 2023.08.10
- performance upgrade
Watch our latest video about Fair Value Gap indicator: https://www.youtube.com/watch?v=pBRXTKNIMAk
バージョン 7.4 2023.02.08
- NEW input "Button text color"
バージョン 7.3 2022.12.26
- new input variable "Engulf alert un-fill rectangle"
バージョン 7.2 2022.11.20
- rectangle and trendline alert buttons visible within chart when scrolling left
バージョン 7.1 2022.11.07
- bug fixed after renaming object
バージョン 7.0 2022.11.06
- performance upgrade that will lower CPU usage on MetaTrader terminal
バージョン 6.9 2022.09.17
- new input variable "Extended object text position" with options (Right, Left)
バージョン 6.8 2022.08.12
- new version
バージョン 6.7 2022.08.01
- recompile with new Metatrader version
バージョン 6.5 2022.05.09
- performance upgrade
バージョン 6.4 2022.05.04
- bug fix and recompile code for MT4 update

Please check our YouTube channel to learn trading tips and tricks: https://www.youtube.com/Tradingbox
バージョン 6.3 2022.04.09
- recompile for new MT4 build
バージョン 6.2 2021.12.23
- compliance upgrade for the NEW tool "Rectangle position changer"

Download: https://www.mql5.com/en/market/product/75865

VIDEO: https://www.youtube.com/watch?v=IYW1dgOWwRg
バージョン 6.1 2021.11.27
- CPU usage reduced that will allow more charts with TBTA in MetaTrader terminal
バージョン 6.0 2021.11.16
- bug fix for non extended rectangle Risk Reward tool
- CPU performance improvement when using TBRE on multiple charts
バージョン 5.9 2021.11.01
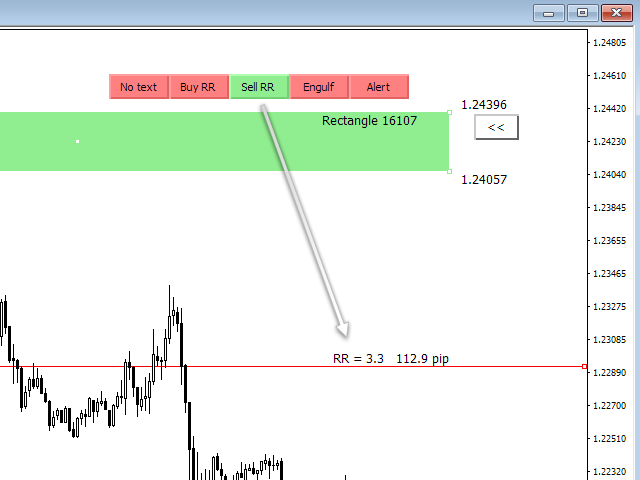
- risk reward tool for non-extended rectangles
- adding more texts positions (object names) to rectangle and trendline. With button "X" you remove current text
バージョン 5.6 2021.08.28
- speed and performance upgrade
バージョン 5.5 2021.08.01
- improved performance between Trading box tools (Order management, Technical analysis, Rectangle extender, Order box Dashboard)
バージョン 5.4 2021.08.01
- extended rectangle and trendline buttons display correction for high resolution displays
バージョン 5.3 2021.07.31
- bug fix for chart clean up after indicator is removed
バージョン 5.2 2021.07.25
- optimized refresh rate for pip distance display in brackets (price difference between Bid and object price)
バージョン 5.1 2021.07.22
- removed input variable "Set larger button text"
- NEW input variable "Button font size"
- NEW input variable "Button size scale"
バージョン 5.0 2021.07.20
- NEW input variable "Show pip distance in brackets"

NEW input variable "Use timeframe colors for extended rectangle"
- Rectangle color for M1, M5, M15
- Rectangle color for M30, H1, H4
- Rectangle color for D1, W1, MN

NEW input variable "Use timeframe colors for extended trendline"
- Trendline color for M1, M5, M15
- Trendline color for M30, H1, H4
- Trendline color for D1, W1, MN

- button click lagging solved
バージョン 4.9 2021.07.17
- bug fix when Trading box Order management and Rectangle extender are used on the same chart
バージョン 4.8 2021.07.06
- NEW input variable "Set larger button text" that will create a little bigger buttons and font size +2
バージョン 4.7 2021.06.20
- NEW input variable "Bring Alerted chart to the top"

- NEW input variable "Extend new created rectangle"
- NEW input variable "Extend new created trendline"
バージョン 4.6 2021.05.25
- bug fix for button display
バージョン 4.5 2021.05.01
- NEW "Text" button that gives options to display rectangle or trendline text in all possible spots around or inside object. This works for non-extended rectangles and trendlines where we would like to have object name displayed in suitable place around or inside object. This is custom show object name function.

- Safety check warning for too many objects on chart (performance issues) + warning for incompatible indicators
バージョン 4.4 2021.04.03
Added new input variables:
- Extended trendline width
- Flat trendline width
バージョン 4.3 2021.03.27
- better sync with Trading box Order management v3.0 objects
バージョン 4.2 2021.03.01
New input variables added and used when you extend rectangle or trendline:
- Alert enabled by default
- Engulf enabled by default
- Close enabled by default
- No text enabled by default
バージョン 4.1 2021.02.17
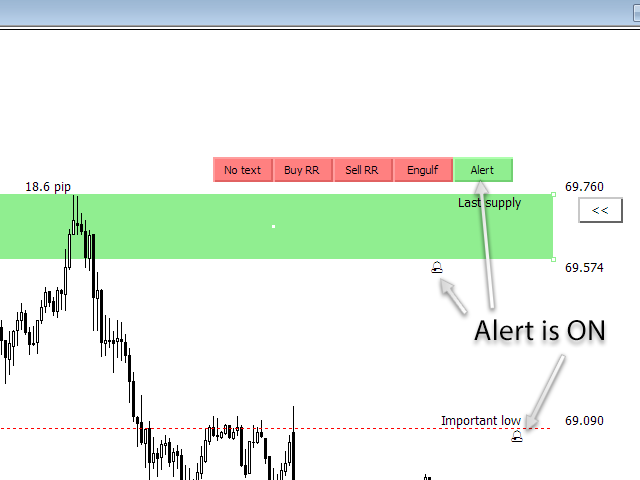
- Alert and Engulf button color refresh after alert is triggered
バージョン 4.0 2021.02.15
- bug fix and also code sync for MT5 version
バージョン 3.9 2021.02.04
- bug fix for full zoom chart label positions
バージョン 3.8 2021.02.01
- input variables description added

- new input variables:
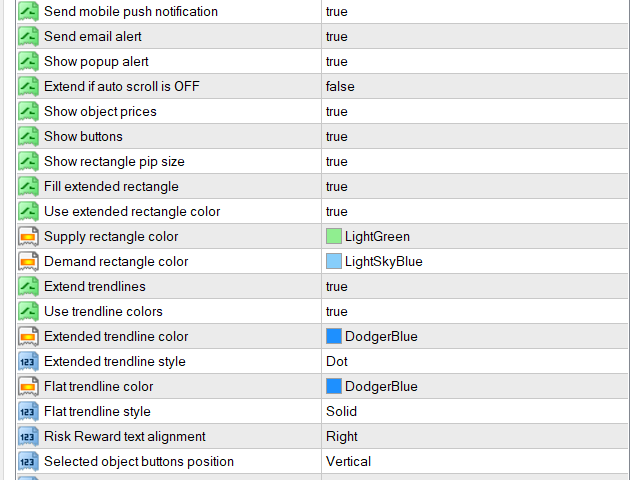
- Selected object buttons position
- Rectangle pip size position
バージョン 3.7 2021.01.16
- switching between timeframes bug solved
バージョン 3.6 2021.01.01
Important MAJOR performance upgrade and bug fix:
- CPU load problems solved (better chart and object refresh logic)
- Ignoring Trading box Order management objects
- All user bug reports solved
- Works better with other indicators
- Added e-mail alert option
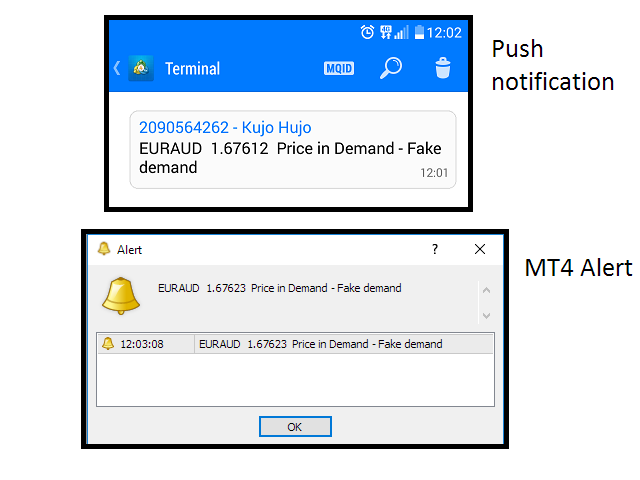
- Added 3 new variables to manage alerts and notifications (send_mobile_push_notification, send_email_alert, show_popup_alert)
- Optimized chart refresh rate that will reduce CPU load from 30% up to 400%

Please also check our product Technical analysis which is advanced version of Rectangle extender.

*** I wish you all best in 2021 and happy trading ***
バージョン 3.5 2020.11.06
- minor bug fix when use >> button on rectangle
バージョン 3.4 2020.11.02
- another bug solved when clicking << button
バージョン 3.3 2020.11.02
- bug fix for << button and when rename trendline
バージョン 3.2 2020.10.30
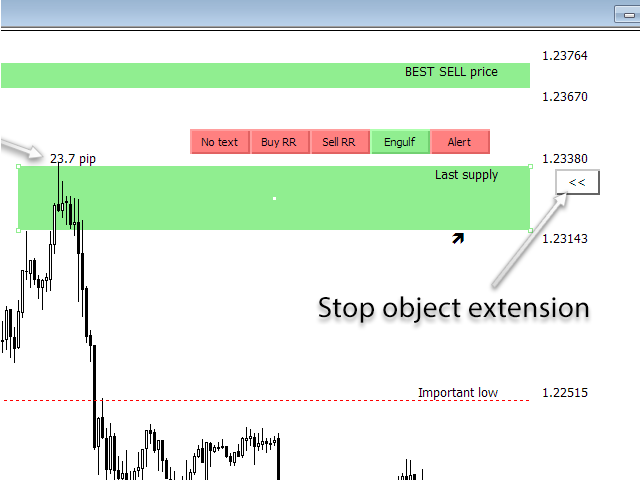
- added new input variable extend_if_auto_scroll_off that will give you option to have fixed extended object size if you have auto scroll option diabled
バージョン 3.1 2020.10.29
- minor bug fixed when Auto scroll is OFF. Objects are extended to the right side of the chart
バージョン 3.0 2020.10.04
- minor bug fix for alert arrows timeframe visibility
バージョン 2.9 2020.09.30
MAJOR upgrade
- new Flat button for trendline (create horizontal flat trendline)
- new Close button for rectangle, trendline and ray (alert when current candle closes beyond object price)
- when you click on extended rectangle it shows you text Demand or Supply type of rectangle
- if you extend rectangle around price then you have option to decide if this rectangle is supply or demand
バージョン 2.8 2020.09.07
- minor preformance upgrades
バージョン 2.7 2020.08.08
- Button fix for Demand rectangle extender
バージョン 2.6 2020.08.04
- Rectangle and trendline function buttons are now aligned on right side of charts, so they not overlay with other trendlines and rectangles
- button positions corrections
バージョン 2.5 2020.07.28
-minor bug for Risk Reward calculation
バージョン 2.4 2020.07.13
- bug fix for trendline extension
バージョン 2.3 2020.07.10
- aditional bug fix for rectangle colors
バージョン 2.2 2020.07.10
- rectangle name and action buttons are now fixed depends on supply or demand rectangle position
バージョン 2.1 2020.07.02
- bug fix for hiding buttons after new created object
バージョン 2.0 2020.06.21
- MAJOR UPGRADE: When you click on button Alert or Engulf, the creation time is saved. When you open MT4 the Alert and Engulf will be checked if price was hit your alert level when your MT4 was closed.
We reccomand that alerts need to be placed again in new version, becouse data protocol has been changed/upgraded.
バージョン 1.9 2020.06.21
- MAJOR UPGRADE: When you click on button Alert or Engulf, the creation time is saved. When you open MT4 the Alert and Engulf will be checked if price was hit your alert level when your MT4 was closed.
We reccomand that alerts need to be placed again in new version, becouse data protocol has been changed/upgraded.
バージョン 1.8 2020.06.13
- bug fix when selecting Order box from tool Trading box Order Management
バージョン 1.7 2020.06.10
- bug fix
バージョン 1.6 2020.06.09
- bug fixed with anoying alert when deselecting object (my bad while developing code)
バージョン 1.5 2020.06.05
- when deselecting object, buttons disapear more quickly
バージョン 1.4 2020.06.04
- bug fix for extending rectangle and trendline on lower timeframes with no chart history
バージョン 1.3 2020.06.03
- added new input variable show_rectangle_pip_size
バージョン 1.2 2020.06.02
- buttons for retina display
- bug fixes reported by users
バージョン 1.1 2020.05.26
- program bug fixed becouse in some MT4 program hangs and stop MT4 application