Aggressive TP SL
- インディケータ
- Benwill Lopez Navarro
- バージョン: 1.0
- アクティベーション: 5
NO REPAINT
The system combines several analytical techniques and presents BUY/SELL signals in an easy-to-read form. You don’t have to be a
professional to use it. Aggressive TP SL can make amazingly accurate market predictions by constantly auto-analyzing every price
movement, trading patterns and with the help of complex trading algorithms.
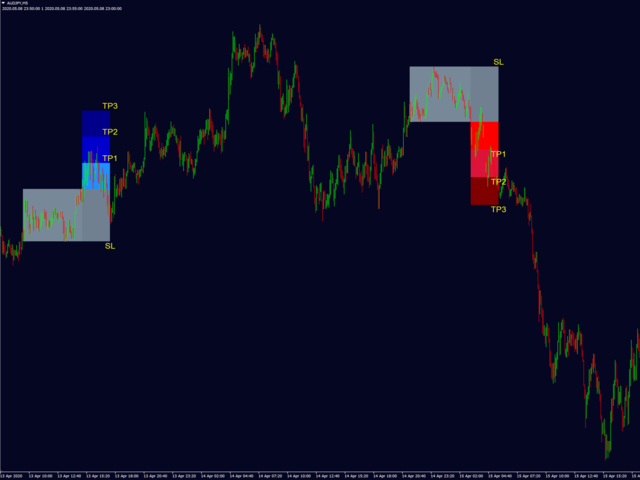
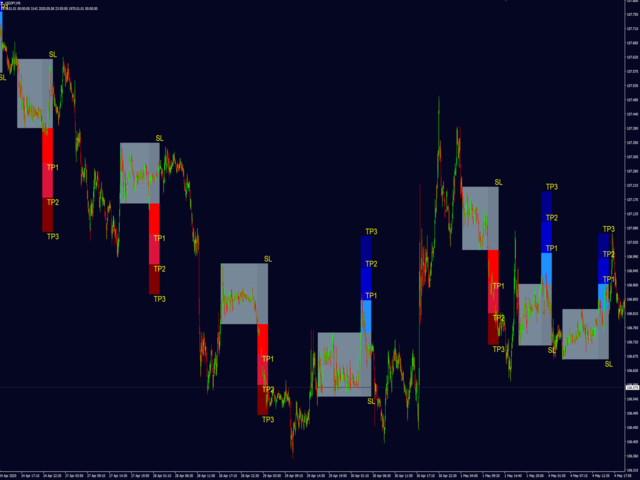
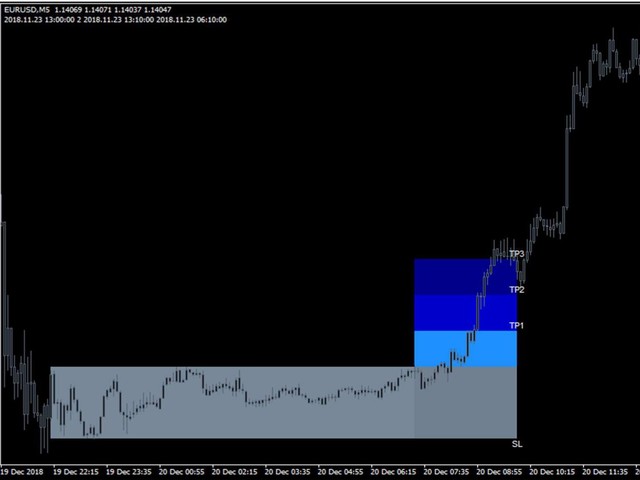
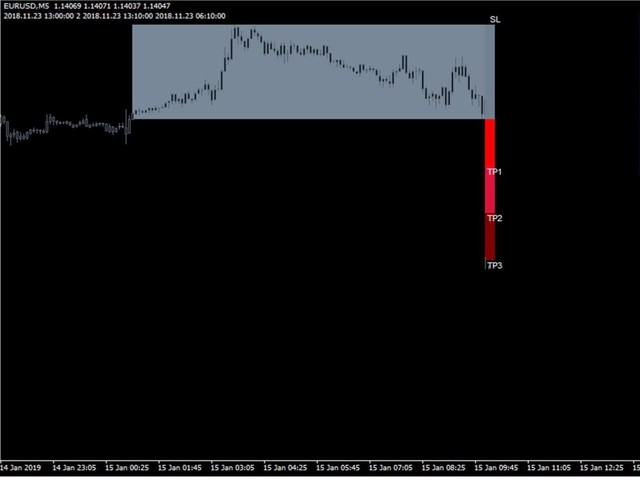
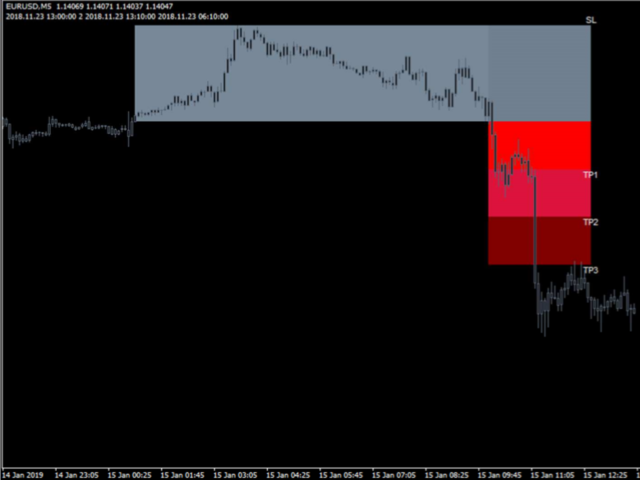
This indicator main task is to look for gravity zones and generate buy/sell signal with exact SL and TPs location.
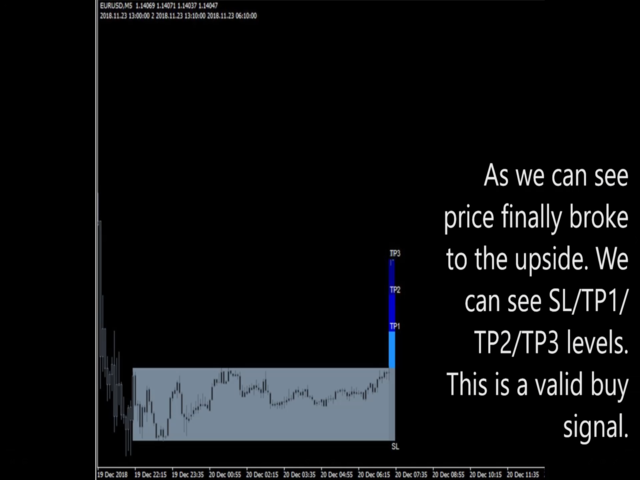
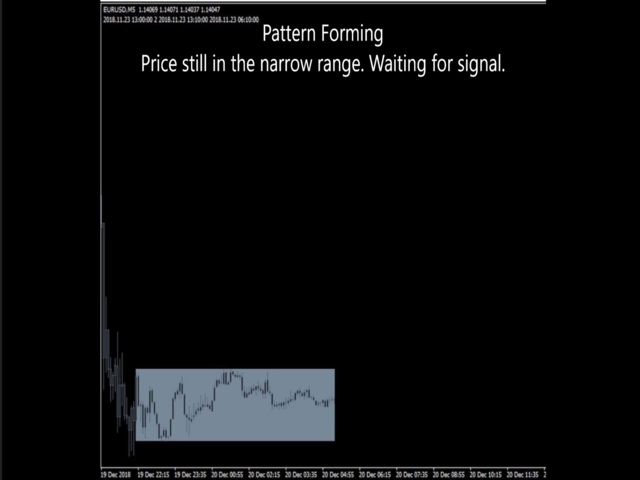
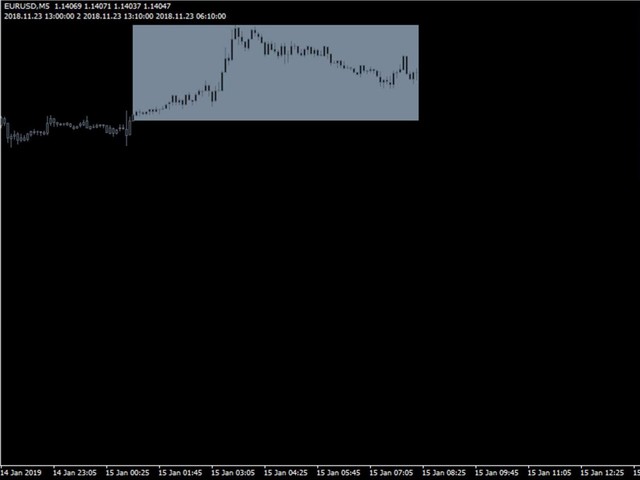
When specified conditions are fulfilled, a grey rectangle appears on the chart. This is the place where the price is getting ready for further move.
I prefer the bigger number of signals during my trading, what should I do?
I have for sell 2 Systems; If you prefer standard/conservative trading go with the Conservative TP SL system on my availabe systems. However if you prefer a larger number of signals go with the Aggressive TP SL which is this one.
----------
ONLY TAKE SELL ORDERS ON GENERAL BEARISH TREND
ONLY TAKE BUY ORDERS ON GENERAL BULLISH TREND
BEST TIME FRAMES= 5 AND 15 MINUTES CHARTS
Risk warning
Before you begin trading on Real account please carefully consider your investment goals, risk and experience you have. It should be noted that Forex is a leverage based market. It should be remembered that leverage can work both in your advantage and disadvantage as well. Therefore there is high risk of losing a part or all of your financial input placed on your account and because of that you should remember to trade with the amount of money which you can lose without taking any influential financial damage.
Disclaimer
Signals generated by the system are not investment recommendations. All materials included on the website, as well as all system components (indicators, instruction manual) are for educational purposes only. Creators of the system will not take any responsibility for any profit or loss/damage caused by using the system.
FAQ
How to use it correctly?
The simplest method is to observe the price. If it moves quickly and dynamically, we can usually count on TP3. If it has difficulties with volatility, or the market is just about to close an important trading session (like EU or US), it’s better to aim for lower values like TP1 or TP2.
How long does the signal is valid, after the colored boxes are printed on the chart?
The signal is valid until the price hits SL or TP3 level, or when next signal is created.
What should I do if I miss the entry?
If the price is far from the entry point you should wait for the next signal.
What lot size should I use when trading this system?
You should always control your risk. Most traders use 1-2% of their account for any opened transaction.
What timeframe should I trade?
It depends on your trading style. If you prefer fast scalping use M1 – M5 TF. If you like typical daytrading, you can focus on M5-H1 TFs. If you like slow swing trading check the signals on H1/H4/D1 TFs.
I prefer the bigger number of signals during my trading, what should I do?
I have for sell 2 Systems; If you prefer standard/conservative trading go with the Conservative TP SL system on my availabe systems. However if you prefer a larger number of signals go with the Aggressive TP SL which is this one.
SL level is always printed on the opposite side to the signal.
It's usually enough space for the transaction for small pullbacks and making a profit. However, if it's too small for you, you can move the SL for a few pips more for example to the round level or an important support/resistance level.