• 概要
  • レビュー (5)
  • コメント (4)
  • 最新情報

Liquidity Levels

4
市場への出入りには多くの流動性が必要であるため、流動性は市場、特に機関投資家にとって重要な側面です。

スマートマネーは、群れのマーケットメーカーとして機能します。言い換えると、スマートマネーは、群れが保有しているロングポジションまたはショートポジションのオーバーハングの相手です。群れが正味不足の場合、スマートマネーは正味長期です。群れが純長である場合、スマートマネーは純短です。これにより、スマートマネーと牛群の間で利益相反が生じます。そして、その圧倒的な力のために、スマートマネーは常に勝ちます!
これは、スマートマネーの動作を説明するためのものです。

したがって、機関投資家は、従来のテクニカル分析ツールや手法よりも、需要/供給の指標に重点を置いています。

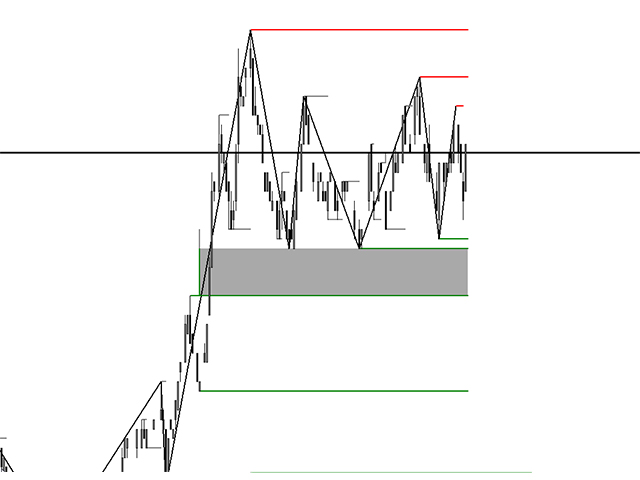
サポートとレジスタンスレベルの横に、それは市場のすべての主要な流動性レベルとプールを示します。これらの価格レベルの流動性は、特に小売業者のストップロス、ブレイクアウト、ブレイクイーブン注文によって累積されます。サポートまたはレジスタンスのレベルが長ければ長いほど、この価格レベルのすぐ上/下でより多くの流動性が累積されます。これはまた、体系的にすべてのストップロス注文が何度も何度もヒットされる理由でもあります。

機関投資家が価格を流動性のあるところまで押し上げるので、これらすべてのレベルは遅かれ早かれ価格行動の影響を受けます。
この操作を行うことにより、後で再び交差する新しい流動性ゾーンが作成されます。

この指標は、まだ別のサポートとレジスタンスの指標ではありません。もちろん、ストップロス、ブレイクアウト、ブレイクイーブンオーダーの累積があるため、サポートとレジスタンスのレベルも流動性レベルです。ヒットしたレベルは、灰色の線としてチャートに残ります。このようにして、これらのレベルが磁石として価格アクションをどのように引き付けるかを確認できます。

トレーダーのための指標の使用:

遅かれ早かれ価格を引き付ける流動性レベルを確認する
流動性プールの反対方向にロング/ショートポジションを取ることを避けます
価格が流動性に向かって移動する場合、流動性ゾーンが部分的または完全に交差する可能性が高いので、インジケーターを使用してテイクプロフィットオーダーを流動性レベルに置きます
現在の価格レベルの魅力がなくなっているので、流動性ゾーンがヒットした後の市場の反転は非常に強力です。
このインジケーターには多くのパラメーターはありませんが、リクエストに応じて、提案やカスタマイズを受け付けています。

ストラテジーテスターで使用できるこのインジケーターのデモ版があります。

あなたはすぐにこの指標の使用と効果に気づくでしょう、ビデオを見てください。

共有してくれてありがとう、コメントやレビューを残してください。

重要:一部の計算は、デフォルトのジグザグインジケーターに基づいており、ルートインジケーターフォルダーに存在する必要があります。
レビュー 5
gijs_best_service
21
gijs_best_service 2020.10.14 18:31 
 

Really good indicator!! Would be awesome to have some kind of manual to understand all the colors. Have been making good profits since using this indicator. Hope seller will respond on chat!

macdours
19
macdours 2020.11.05 00:10 
 

I too purchased the indicator but I am having to try and figure it out on my own, since there is no manual that comes with the indicator. I can see how it could be profitable but I have not used it yet. I have been waiting for the United States elections to finish up. If the seller could respond with a manual that would be extremely helpful.

おすすめのプロダクト
これは、キャンドルの終値を予測する指標です。 このインジケータは、主にD1チャートでの使用を目的としていますが. この指標は、従来の外国為替取引とバイナリオプション取引の両方に適しています。 インジケーターは、スタンドアロンのトレーディングシステムとして使用することも、既存のトレーディングシステムへの追加として機能させることもできます。 このインジケーターは、現在のキャンドルを分析し、キャンドル自体の内部の特定の強度係数と、前のキャンドルのパラメーターを計算します。 したがって、この指標は、市場の動きのさらなる方向性と現在のキャンドルの終値を予測します。 この方法のおかげで、この指標は、短期の日中取引だけでなく、中期および長期の取引にも適しています。 インジケーターを使用すると、市場の状況の分析中にインジケーターが生成する潜在的な信号の数を設定できます。 インジケーターの設定には、このための特別なパラメーターがあります。 また、インジケーターは、チャート上のメッセージの形式で、電子メールで、およびPUSH通知の形式で、新しい信号について通知することができます。 購入後は必ず私に書いて
This indicator is, without a doubt, the best variation of the Gann Angles among others. It allows traders using Gann methods to automatically calculate the Gann angles for the traded instrument. The scale is automatically calculated when the indicator is attached to the chart. When switching timeframes, the indicator recalculates the scale for the current timeframe. Additionally, you can enter your own scales for the Gann angles. You can enter your own scales either for both vectors or for each
The Penta-O is a 6-point retracement harmonacci pattern which usually precedes big market movements. Penta-O patterns can expand and repaint quite a bit. To make things easier this indicator implements a twist: it waits for a donchian breakout in the right direction before signaling the trade. The end result is an otherwise repainting indicator with a very reliable trading signal. The donchian breakout period is entered as an input. [ Installation Guide | Update Guide | Troubleshooting | FAQ | A
Mean Reversion Supply Demand Indicator Mean Reversion Supply Demand is the indicator to detect the important supply demand zone in your chart. The concept of supply demand trading relies on the quantity mismatching between buying and selling volumes in the financial market. Typically, supply demand zone serves to predict the turning point. The wave pattern, for any supply demand zone to work as an successful trade, looks like the price must touch the base zone, move away and then return to zone
Price Breakout pattern Scanner is the automatic scanner for traders and investors. It can detect following patterns automatically from your chart. Head and Shoulder - Common tradable pattern. Reverse Head and Shoulder - This pattern is the reverse formation of the Head and Shoulder. Double Top - When the price hits resistance level twice and decline toward the support level, the trader can anticipate sudden bearish breakout through the support level. Double Bottom - The double bottom pattern is
Monster Harmonics Indicator is a harmonic pattern indicator. It recognizes Gartley, Bat, Crab, Butterfly, Cypher, White Swan, Black Swan, Shark and several other patterns. Projected patterns that are not yet completed are recognized, too. Monster even shows the PRZ (Potential Reversal Zone). Users can add their own user defined patterns to Monster. Besides the current pattern, Monster also shows all patterns in the symbols history. Monster will provide alerts for developing patterns. Introduced
The Volume by Price Indicator for MetaTrader 4 features Volume Profile and Market Profile TPO (Time Price Opportunity). Volume and TPO histogram bar and line charts. Volume Footprint charts. TPO letter and block marker collapsed and split structure charts. Static, dynamic and flexible range segmentation and compositing methods with relative and absolute visualizations. Session hours filtering and segment concatenation with Market Watch and custom user specifications. Graphical layering, positio
Was: $249  Now: $99   Market Profile defines a number of day types that can help the trader to determine market behaviour. A key feature is the Value Area, representing the range of price action where 70% of trading took place. Understanding the Value Area can give traders valuable insight into market direction and establish the higher odds trade. It is an excellent addition to any system you may be using. Blahtech Limited presents their Market Profile indicator for the MetaTrader community. Ins
This is an arrow indicator without a future function,developed based on the most advanced profit trading algorithms.It has the most innovative and advanced dual trend analysis module, as well as the latest and highly effective market trend prediction algorithm.Trends are your friends, and following larger trends can earn the maximum profit in foreign exchange. This indicator helps traders identify current trends and track them. Someone once made a profit of 10 times in a week by relying on it.No
The RTrends indicator does two things: first, it automatically draws the layout of the price chart by plotting trend lines and, secondly, it produces bearish and bullish signals. The layout reflects the fractal nature of the market. Trends from different time horizons are applied simultaneously on the chart. Thus, from a single chart a trader can see trend lines of higher timeframes. The lines, depending on the horizon, differ in color and width: the older the horizon, the thicker the line is. T
This is the FXTraderariel-TakeProfit - Stop Loss Indicator . It provides you 3 potential Take Profits and 1 Stop Loss. These potential targets are computed based on several methods . The indicator can be used on every time frame, but we advise to use it on H1, H4 and D1. Especially if you are a novice trader. Pro Traders can also you use it for scalping in smaller time frames (M1, M5 and M15). This indicator is not a complete trading system. It doesn't provide you a Signal nor can predict the m
Gold Bricks FX USES THE TREND WAVE INDICATOR AND IT CAN IDENTIFY THE BEGINNING AND THE END OF A NEW WAVE TREND MOVEMENT. AS AN OSCILLATOR, THE INDICATOR IDENTIFIES THE OVERBOUGHT AND OVERSOLD ZONES. IT WORKS GREAT TO CATCH THE SHORT TERM PRICE REVERSALS AND USES A MARTINGALE STRATEGY TO CLOSE ALL TRADES IN PROFIT. USE DEFAULT SETTINGS ON H1 OR HIGHER TIME FRAME ON ANY PAIR FOR MORE ACCURATE TRADES WHY THIS EA : Smart entries calculated by 4 great strategies The EA can be run on even a
Shark Deal Book
Philip Pankaj Suthagar
4 (3)
Term  "shark"  in the business world denotes a high volume investor who just made a good investment in a highly Potential business deal.So, sharks are the ones who make the market move. In our case, if an American shark bought a Japanese company, he/she has to convert American dollars into Japanese yen to make the deal. So, the demand for the Japanese yen will increase sharply. Thus USD/JPY will go short rapidly if the deal was from the shark. Another example, In the case of forex, if fed increa
Intraday Levels shows intraday levels grid for intraday trading Shows a grid for the day levels, gives you a guide to know the trend and to measure intraday trades (stop-loss and take-profit). Parameters are: Levels Mode: Basic mode: Shows highest, lowest and middle levels. Advanced mode: Shows highest, lowest, middle and intermediate levels. Fibonacci mode: Shows session Fibonacci retracements levels. Momentum mode: Shows delayed Advanced levels to identify momentum. Smooth Period (Momentum
Introduction to Chart Pattern MT Chart Pattern MT is a chart pattern scanner to detect the triangle pattern, falling wedge pattern, rising wedge pattern, channel pattern and so on. Chart Pattern MT uses highly sophisticated chart pattern detection algorithm. However, we have designed it in the easy to use with intuitive user interface. Chart Pattern MT will show all the patterns in your chart in the most efficient format for your trading. You do not have to do tedious manual pattern detection an
Dynamic Forex28 Navigator - 次世代の Forex 取引ツール。 現在 49% オフ。 Dynamic Forex28 Navigator は、長年人気のインジケーターを進化させたもので、3 つの機能を 1 つにまとめています。 Advanced Currency Strength28 インジケーター (レビュー 695 件)  + Advanced Currency IMPULSE with ALERT (レビュー 520 件) + CS28 コンボ シグナル (ボーナス)。 インジケーターの詳細 https://www.mql5.com/en/blogs/post/758844 次世代の Strength インジケーターが提供するもの  オリジナルで気に入っていたすべての機能が、新機能と精度の向上によって強化されました。 主な機能: 独自の通貨強度計算式。 すべての時間枠でスムーズかつ正確な強度ライン。 トレンドの特定と正確なエントリーに最適です。 ダイナミックマーケットフィボナッチレベル (マーケットフィボナッチ)。 このインジケー
In the stock market technical analysis, support and resistance is a concept that the movement of the price of a security will tend to stop and reverse at certain predetermined price levels. Support and resistance levels can be identified on any timeframe. However, the most significant ones are found on the higher time frames, such as daily, weekly, and monthly. This indicator using the weekly OHLC data to identify the relevant levels. This is a support and resistance indicator and providing majo
KT Renko Patterns MT4
KEENBASE SOFTWARE SOLUTIONS
2.33 (3)
KT Renko Patterns scans the Renko chart brick by brick to find some famous chart patterns that are frequently used by traders across the various financial markets. Compared to the time-based charts, patterns based trading is easier and more evident on Renko charts due to their uncluttered appearance. KT Renko Patterns features multiple Renko patterns, and many of these patterns are extensively explained in the book titled Profitable Trading with Renko Charts by Prashant Shah. A 100% automate
Fourteen plus nine What is it for? Applying Tom DeMark’s TD Sequential serves the purpose of identifying a price point where an uptrend or a downtrend exhausts itself and reverses. . What are the main components of TD Sequential? TD Sequential has two parts – TD Setup and TD Countdown. The first phase of TD Sequential starts with a TD Setup and is completed with a 9 count. When the 9 count is completed, it is at that point, a price pause, price pullback, or reversal is likely. It is also at tha
VR Cub
Vladimir Pastushak
VR Cub は、質の高いエントリーポイントを獲得するためのインジケーターです。このインジケーターは、数学的計算を容易にし、ポジションへのエントリーポイントの検索を簡素化するために開発されました。このインジケーターが作成されたトレーディング戦略は、長年にわたってその有効性が証明されてきました。取引戦略のシンプルさはその大きな利点であり、初心者のトレーダーでもうまく取引することができます。 VR Cub はポジション開始ポイントとテイクプロフィットとストップロスのターゲットレベルを計算し、効率と使いやすさを大幅に向上させます。取引の簡単なルールを理解するには、以下の戦略を使用した取引のスクリーンショットを見てください。 設定、設定ファイル、デモ版、説明書、問題解決方法は、以下から入手できます。 [ブログ] レビューを読んだり書いたりすることができます。 [リンク] のバージョン [MetaTrader 5] エントリーポイントの計算ルール ポジションをオープンする エントリーポイントを計算するには、VR Cub ツールを最後の高値から最後の安値までストレッチする必要があります。
Super Reversal Pattern Indicator Unlock the power of advanced pattern recognition with our Super Reversal Pattern Indicator. Designed for traders seeking precision and reliability, this indicator identifies one of the most effective reversal patterns in technical analysis, offering a significant edge in your trading strategy. Key Features: Non-Repainting Accuracy: Enjoy the confidence of non-repainting technology. Once a Super Reversal Pattern is detected, it remains static, providing consis
マーケットシェーバー   マーケットスカルパー このインジケーターはRPTradeProSolutionsシステムの一部です。 Market Scalperは、プライスアクション、ダイナミックサポート、レジスタンスを使用した毎日のトレンド指標です。 誰でも使用できるように設計されており、トレーディングの初心者でも使用できます。 決して塗り直さないでください。 表示は近いものから近いものへと示されます。 単独で使用するように設計されているため、他のインジケーターは必要ありません。 明確でシンプルな表示を提供します どのように機能しますか MarketShaverはDualTimeFramesシステムを使用しています。 主な傾向はより高いTFによって取られますが、より速いものは取引を閉じるために使用されます トレードは1つずつ示され、同時に2つのトレードが存在することはありません。 マーケットシェーバーは次のことを示しています。 いつ取引するか いつそれを止めるか、利益か損失か。 貿易報酬 適切な期間終了TFを設定するのに役立つ多くの統計 マーケットシェーバーは動作します
The Chaikin Oscillator is a technical indicator developed by Marc Chaikin that combines price and volume data to measure the accumulation and distribution of a financial instrument. It aims to identify potential buying and selling opportunities in the market. The Chaikin Oscillator is calculated by subtracting a 10-day exponential moving average of the Accumulation Distribution Line (ADL) from a 3-day exponential moving average of the ADL. Here's how to use the Chaikin Oscillator indicator in tr
How to use Pair Trading Station Pair Trading Station is recommended for H1 time frame and you can use it for any currency pairs. To generate buy and sell signal, follow few steps below to apply Pair Trading Station to your MetaTrader terminal. When you load Pair Trading Station on your chart, Pair Trading station will assess available historical data in your MetaTrader platforms for each currency pair. On your chart, the amount of historical data available will be displayed for each currency pai
This is a new strategy for SUPPLY DEMAND areas It is based on a calculation using the tick volume to detect the big price action in market for both bear /bull actions this smart volume action candles are used to determine the supply and demand areas prices in between main supply and demand lines indicate sideway market  up arrows will be shown when prices moves above the main supply and the secondary supply lines Down arrows will be shown when prices moves below the main demand and the secondary
The perfect tool for Scalng in the Forex markets You can trade both from signal to signal and using take profit  The algorithm does not use Zigzag!  No redrawing!  This is a channel instrument that uses a moving average as a filter. Moving Average  There are 2 parameters for the settings Ma Period = 5 period Moving Average  Channel 1.0 distance of channel lines from the chart Price Signal Filter - calculation of signal opening and filter There is a complete set of Alert There is a multi-timefram
これは、価格ラベル付きのAdvanced ZigZagDynamic および/または ExtendedFractals インジケーターの極値に基づくサポートおよびレジスタンスレベルのMTFインジケーターです(無効にすることができます)。 MTFモードでは、より高いTFを選択できます。デフォルトでは、レベルはZigZagインジケータードットに基づいて生成されます。フラクタルインジケータードットは、ZigZagと一緒に、またはその代わりに使用することもできます。使用を簡素化し、CPU時間を節約するために、計算はバーの開口部ごとに1回実行されます。 パラメーター: ForcedTF-レベル計算のチャート時間枠(現在の時間枠と等しいか、それを超える場合があります) MinPipsLevelWidth-ポイント単位の最小レベル幅(非常にタイトなレベルに使用) Use ZigZag Extremums points -ZigZagピークを使用してサポート/抵抗レベルを計算することを有効/無効にします Fixed pips range -ジグザグインジケーターを計算するための最小値と最大値の間の距離
Market Structure Patterns   is an indicator based on   smart money concepts   that displays   SMC/ICT   elements that can take your trading decisions to the next level. Take advantage of the   alerts ,   push notifications   and   email messages   to keep informed from when an element is formed on the chart, the price crosses a level and/or enters in a box/zone. Developers can access the values of the elements of the indicator using the   global variables  what allows the automation of trading
Volume Profile Indicator for MT4 Gain a trading edge with the "Volume Profile" indicator for MetaTrader 4 (MT4). This advanced technical analysis tool allows you to precisely identify key support and resistance levels based on transaction volume. Easily visualize market areas of high interest, where trading volumes are highest, and use this information to make more informed trading decisions. Key Features: Clear and detailed visualization : The indicator displays volume histograms directly on th
For sure, this indicator has become very popular amongst traders. Through coding this indicator will give you the most accurate levels possible for your trading analysis. We have also added in the ability for you to receive alerts when the price breaks above or below a Support or Resistance lines! HOW TO USE The red rectangles represent your resistance/supply zone. The green rectangles represent your support/demand zone.  BONUS FEATURES We coded this indicator with the ability to switch between
このプロダクトを購入した人は以下も購入しています
まず第一に、この取引インジケーターは再描画されず、再描画されず、遅延しないことを強調する価値があります。これにより、手動取引とロボット取引の両方に理想的なものになります。 ユーザーマニュアル:設定、入力、戦略。 アトミックアナリストは、価格の強さとモメンタムを利用して市場でより良いエッジを見つけるためのPA価格アクションインジケーターです。ノイズや誤ったシグナルを除去し、取引ポテンシャルを高めるための高度なフィルターを備えています。複雑なインジケーターの複数のレイヤーを使用して、アトミックアナリストはチャートをスキャンし、複雑な数学的計算をシンプルなシグナルと色に変換します。これにより、どのような初心者トレーダーでも理解して使用し、一貫した取引の決定を行うことができます。 「アトミックアナリスト」は、新規および経験豊富なトレーダー向けにカスタマイズされた包括的な取引ソリューションです。プレミアムインジケーターとトップノッチの機能を1つの取引戦略に組み合わせ、すべてのタイプのトレーダーにとって汎用性のある選択肢にします。 デイリートレーディングとスキャルピング戦略:高
An exclusive indicator that utilizes an innovative algorithm to swiftly and accurately determine the market trend. The indicator automatically calculates opening, closing, and profit levels, providing detailed trading statistics. With these features, you can choose the most appropriate trading instrument for the current market conditions. Additionally, you can easily integrate your own arrow indicators into Scalper Inside Pro to quickly evaluate their statistics and profitability. Scalper Inside
現在20%OFF! 初心者やエキスパートトレーダーのためのベストソリューション! このダッシュボードソフトウェアは、28の通貨ペアで動作しています。それは私達の主要な指標(高度な通貨の強さ28と高度な通貨インパルス)の2に基づいています。それは全体の外国為替市場の大きい概観を与えます。それは、すべての(9)時間枠で28の外国為替ペアのための高度な通貨の強さの値、通貨の動きの速度と信号を示しています。チャート上で1つのインディケータを使用して市場全体を観察し、トレンドやスキャルピングの機会をピンポイントで見つけることができたら、あなたのトレードがどのように改善されるか想像してみてください。 このインディケータには、強い通貨と弱い通貨の識別、潜在的な取引の識別と確認がより簡単になるような機能が搭載されています。このインディケータは、通貨の強さや弱さが増加しているか減少しているか、また、すべての時間枠でどのように機能しているかをグラフィカルに表示します。 新機能として、現在の市場環境の変化に適応するダイナミックなマーケットフィボナッチレベルが追加され、すでに当社のAdvan
Enigmera
Ivan Stefanov
5 (3)
エニグメラ:市場の中核 https://www.enigmera.com はじめに このインディケータと取引システムは、金融市場に対する驚くべきアプローチです。ENIGMERAは、フラクタルサイクルを使用して、サポートとレジスタンスレベルを正確に計算します。本格的な蓄積局面を示し、方向性と目標を示します。 トレンド中でも調整中でも機能するシステムです。 どのように作動するのか? ENIGMERAは、支持線・抵抗線、目標線、乖離線の3つのラインで構成されています。このシステムは、過去のデータを現在と未来に外挿する典型的な市場指標とは異なり、現在の完全な画像を提供します。支持線上にある場合、それは本当の支持を意味し、抵抗線上にある場合、それは本当の抵抗を意味する。ある水準が破られた場合、それはトレンドの変化を意味する。再描画はしない。 市場は常に進化しているため、ENIGMERAはその評価ツールを適応させ、定期的に戦略を修正しています。  これにより、すべてのシナリオが徹底的に評価されることが保証されます。この市場指標の独自性は、その能力を見れば明らかです。  ENIGM
TPSpro TREND PRO は 、市場を自動的に分析し、トレンドとその各変化に関する情報を提供し、再描画せずに取引に参加するためのシグナルを提供するトレンド指標です。 インディケータは各ローソク足を使用し、個別に分析します。さまざまなインパルス(アップまたはダウンインパルス)を指します。通貨、仮想通貨、金属、株、指数の取引への正確なエントリーポイント! バージョンMT5                   インジケーターの完全な説明   インジケーター -   RFI LEVELS と併用することをお勧めします。 主な機能: レンダリングなしで正確な入力信号! シグナルが表示された場合、それは関連性を維持します。これは、シグナルを提供してからそれを変更する可能性があり、入金時の資金の損失につながる可能性があるリドローインジケーターとの重要な違いです。より高い確率と精度で市場に参入できるようになりました。矢印が表示された後、ターゲットに達する (利益確定) か反転シグナルが表示されるまで、ローソク足を色付けする機能もあります。 STOP LOSS / TAKE PROFIT
FX Volume
Daniel Stein
4.58 (33)
mql5と Telegramの モーニング・ブリーフィングで、詳細とスクリーンショットを含む毎日のマーケット・アップデートをご覧 ください! FX Volumeは、ブローカーの視点から市場のセンチメントをリアルに洞察する、最初で唯一の出来高インジケーターです。 ブローカーのような機関投資家が外国為替市場でどのようなポジションをとっているか、COTレポートよりもはるかに速く、素晴らしい洞察を提供します。 この情報をチャート上で直接見ることは、あなたの取引にとって真のゲームチェンジャーであり、画期的なソリューションです。 以下のようなユニークなマーケットデータ洞察から利益を得てください。 比率は 、通貨のロングポジションとショートポジションの比率をパーセントで表示します。 比率の変化は 、選択した期間内のロング比率とその変化率を表示します。 Volumes Totalは 、通貨の取引量(ロングとショート)の合計をロット単位で表示します。 Volumes Long :全通貨のロングポジションの取引量を表示します。 Volumes(ショート )は、全通貨のショートポジションの取引量を表示
指示する     ロシア     -        utilizar con   el indicador の ESP 推奨事項 -   TPSpro トレンド プロフェッショナル版 -   MT5のバージョン 最も重要なことは、将来においても最も重要なことです。 機能のプリンシパル: ゾーンのほとんどは、ベンダーとコンプラドールによってアクティブ化されます。 状況を直感的に把握できるよう、初期の衝動を修正します。 LOGIC AI: MUESTRA zonas (círculos) parabuscar puntos de entrada cuando se activa una plantilla 視覚的に優れた視覚効果があり、最も重要な機能がすべて揃っていることに注意してください。 優れたニベレス/ゾーンの視覚化 (modo MTF) 世界で最も人気のある場所/ゾーンです。これを使用するのに最適な方法です (   TPSproTREND PRO   )。 アルゴリズム プロフェッショナル セパラド パソ ア パソ パラ オペラ それは、オペラハウスやコントラ・デ・エラの指導におい
MetaTrader 4用Ultimate Gold Advisor Ultimate Gold Advisorは、MetaTrader 4での取引体験を最適化するために設計された高度な技術ツールです。経験豊富なトレーダーのニーズに応えるために設計されており、このインジケーターは、精度、高度な分析、および多様な機能を組み合わせ、情報に基づいた取引決定をサポートします。金取引に最適ですが、さまざまな資産にも適用可能であり、Ultimate Gold Advisorは市場戦略の改善に役立ちます。 Ultimate Gold Advisorがトレーダーにとって優れたツールである理由は? 高度なパフォーマンス: 各取引の結果をグラフ上で明確に表示する複数のインジケーターを組み合わせることで、あなたの戦略のパフォーマンスを透明に把握できます。これにより、アプローチを改善し、より情報に基づいた意思決定が可能になります。 即時で視覚的な取引シグナル: グラフ上の赤と青の矢印が、買いと売りの可能性を示します。これらの視覚的なシグナルは理解しやすく、行動すべき重要な瞬間をすばやく特定するのに役立ちます
Gold Channel is a volatility-based indicator, developed with a specific timing algorithm for the XAUUSD pair, which consists of finding possible corrections in the market. This indicator shows two outer lines, an inner line (retracement line) and an arrow sign, where the theory of the channel is to help identify overbought and oversold conditions in the market. The market price will generally fall between the boundaries of the channel. If prices touch or move outside the channel it is a tra
このインディケータは、当社の2つの製品 Advanced Currency IMPULSE with ALERT  +   Currency Strength Exotics . のスーパーコンビネーションです。 このインジケーターは全ての時間枠で作動し、8つの主要通貨と1つのシンボルの強弱のインパルスをグラフで表示します。 このインジケータは、金、エキゾチックペア、商品、インデックス、先物など、あらゆるシンボルの通貨強度の加速度を表示することに特化されています。金、銀、原油、DAX、US30、MXN、TRY、CNHなどの通貨強度の加速度(インパルスまたは速度)を表示するために、任意のシンボルを9行目に追加できる、この種の最初のものです。 新しいアルゴリズムに基づいて構築され、潜在的な取引の特定と確認がさらに容易になりました。これは、通貨の強さや弱さが加速しているかどうかをグラフィカルに表示し、その加速の速度を測定するためです。加速すると物事は明らかに速く進みますが、これはFX市場でも同じです。つまり、反対方向に加速している通貨をペアリングすれば、潜在的に利益を生む取
AW Prime Oscillator
AW Trading Software Limited
5 (1)
2つのオシレーターを組み合わせたもの。 1 つ目はエントリーポイントを表示し、2 つ目は現在のトレンドを表示します。このインジケーターは、すべての高速オシレーター信号または現在のトレンドの方向のみの信号の 2 つのモードで、オシレーター信号を矢印で表示できます。マルチタイムフレームパネルと 3 種類のシグナル通知があります。 利点: デイトレードやスキャルピング取引に適しています トレンドフィルタリング シンプルかつ高感度なセットアップ マルチタイムフレームパネル アドバイザーへの統合に適しています。 あらゆるシンボルとあらゆるタイムフレームに対応 3種類の通知 MT5 version ->  HERE  / Problem solving ->  HERE 指標戦略 このインジケーターは 2 つの異なるオシレーターで構成されます。 遅いトレンド ライン (太い) - インジケーターの高レベルが上から下に交差する場合、それは下降トレンドのインジケーターであり、下側の水平レベル (インジケーターの低レベル) が下から上に交差する場合、それは下降トレンドのインジケーターです。上昇傾向。さ
Best Currency Strength Indicator
Tumelo Patrick Rakotsoane
4.59 (46)
Advanced Currency Strength Indicator The Advanced Divergence Currency Strength Indicator. Not only it breaks down all 28 forex currency pairs and calculates the strength of individual currencies across all timeframes , but, You'll be analyzing the WHOLE forex market in 1 window (In just 1 minute) . This indicator is very powerful because it reveals the true movements of the market.  It is highly recommended to  analyze charts knowing the performance of individual currencies or the countries ec
Allows multiple indicators to be combined into a single indicator, both visually and in terms of an alert. Indicators can include standard indicators, e.g. RSI, CCI, etc., and also Custom Indicators, even those purchased through Market, or where just have the ex4 file. An early alert is provided, say when 4 out 5 indicators have lined up, and a confirmed alert when all are in agreement. A‌lso features a statistics panel reporting the success of the combined indicator by examining the current cha
Take Your Trading Experience To the Next Level ! and get the exclusive TFSR-Analyzer for free !    So you have all these outstanding features  on up to 20 symbols and all timeframes in a smart and clear Design. Correct identification of the trends  in stock investments are pivotal and TrendFollowerSR ensures this perspective while displaying the correct trend on multiply timeframes to help you go long way as much as possible. The latest technology of the Indicator enables to track whether if
MetaBands M4
Vahidreza Heidar Gholami
5 (2)
MetaBandsは、強力でユニークなアルゴリズムを使用してチャンネルを描画し、トレンドを検出して、トレーダーに取引の入出ポイントを提供することができます。チャンネル指標に加えて、強力なトレンド指標でもあります。入力パラメータを使用して新しいチャンネルを作成するために、異なるタイプのチャンネルを統合することができます。MetaBandsは、市場のイベントについてユーザーに通知するために、すべてのタイプのアラートを使用します。 特徴 ほとんどのチャンネルアルゴリズムをサポート 強力なトレンド検出アルゴリズム 異なるタイプのチャンネルを統合する能力 マルチタイムフレームおよびマルチカレンシー(シグナルマトリックス) すべてのタイプのアラート機能(サウンド、画面フラッシャー、プッシュ通知、メール、ポップアップ、矢印) 再描画しない トレンド検出 MetaBandsは、チャネル内を振動する青いラインを使用してトレンドを検出します。ラインがチャネルの上部バンドに達すると、下降トレンドの開始を示し、下部バンドに達すると上昇トレンドの開始を示します。青いラインが中心ラインに近づくと、市場はコンソ
Royal Scalping Indicator M4
Vahidreza Heidar Gholami
4.17 (6)
Royal Scalping Indicator is an advanced price adaptive indicator designed to generate high-quality trading signals. Built-in multi-timeframe and multi-currency capabilities make it even more powerful to have configurations based on different symbols and timeframes. This indicator is perfect for scalp trades as well as swing trades. Royal Scalping is not just an indicator, but a trading strategy itself. Features Price Adaptive Trend Detector Algorithm Multi-Timeframe and Multi-Currency Trend Low
現在20%OFF! 初心者やエキスパートトレーダーに最適なソリューションです。 このインディケータは、エキゾチックペア・コモディティ・インデックス・先物など、あらゆるシンボルの通貨の強さを表示することに特化したインディケータです。金、銀、原油、DAX、US30、MXN、TRY、CNHなどの通貨の強さを表示するために、9行目にどのシンボルでも追加することができます。独自の機能を多数搭載し、新しい計算式を採用したため、ユニークで高品質、かつ手頃な価格のトレーディングツールとなっています。新しいトレンドやスキャルピングチャンスのトリガーポイントを正確に把握することができるため、あなたのトレードがどのように改善されるか想像してみてください。 ユーザーマニュアル:ここをクリック   https://www.mql5.com/en/blogs/post/708876 すべての時間枠に対応します。あなたはすぐにトレンドを見ることができるようになります! 新しいアルゴリズムに基づいて設計されているため、潜在的な取引の特定と確認がより簡単になります。これは、8つの主要通貨と1つのシンボ
Harmonic Papallons
Ramon Sobrevals Arce
3.33 (3)
Automatically scans the chart to find Harmonic Patterns, and give you the chance to enter early in good operations. Also if selected, it will alert you in advance when future patterns appears, showing you a projection of a posible future pattern. The main goal  for this algorithm is to determine with high precision the moment when a trend ends and a new one begins. Giving  you the best price within a reversal.   We have added the "Golden Trade", we define it as the perfect order: For those orde
The All-in-One Trade Indicator (AOTI) determines daily targets for EURUSD, EURJPY, GBPUSD, USDCHF, EURGBP, EURCAD, EURAUD, AUDJPY, GBPAUD, GBPCAD, GBPCHF, GBPJPY, AUDUSD, and USDJPY. All other modules work with any trading instruments. The indicator includes various features, such as Double Channel trend direction, Price channel, MA Bands, Fibo levels, Climax Bar detection, and others. The AOTI indicator is based on several trading strategies, and created to simplify market analysis. All-in-One
MetaTrend M4
Vahidreza Heidar Gholami
Meta Trend Indicator is an efficient way to forecast and detect the trend in any market. It reveals the trend, support and resistance levels, volatility and the maximum potential target, all in one indicator. To adapt to the price and to decrease consecutive trend failures, the internal trend detector algorithm studies the market and dynamically chooses the right values for the internal parameters. This indicator is a perfect trend filter for any strategy or expert advisor. Features Super Adapti
TrendMaestro
Stefano Frisetti
5 (3)
note: this indicator is for METATRADER4, if you want the version for METATRADER5 this is the link:  https://www.mql5.com/it/market/product/108106 TRENDMAESTRO ver 2.4 TRENDMAESTRO recognizes a new TREND in the bud, he never makes mistakes. The certainty of identifying a new TREND is priceless. DESCRIPTION TRENDMAESTRO identifies a new TREND in the bud, this indicator examines the volatility, volumes and momentum to identify the moment in which there is an explosion of one or more of these data a
Step into the future of automated trading with the Beast Indicator V7, The indicator allows you to trade binary options. T his indicator give high winning ratio with over 20 years of backtesting  an unparalleled tool that seamlessly transforms your trading journey into an effortless and lucrative venture. Designed to simplify and optimize the trading process, the Beast Indicator is the ultimate game-changer, offering a hassle-free experience that allows you to set your buy and sell options effo
現在20%OFF! このダッシュボードは、複数のシンボルと最大9つのタイムフレームで動作するソフトウェアの非常に強力な部分です。 このソフトは、弊社のメインインジケーター(ベストレビュー:Advanced Supply Demand)をベースにしています。    Advanced Supply Demand ダッシュボードは、素晴らしい概要を提供します。それは示しています。  ゾーン強度評価を含むフィルタリングされた需給値。 ゾーン内/ゾーンへのPips距離。 ネストされたゾーンがハイライトされます。 選択されたシンボルの4種類のアラートを全ての(9)時間枠で提供します。 それはあなたの個人的なニーズに合わせて高度に設定可能です。 あなたの利益! すべてのトレーダーにとって最も重要な質問です。 市場に参入するのに最適なレベルはどこか? 成功のチャンスとリスク/リターンを得るために、強力な供給/需要ゾーン内またはその近くで取引を開始します。 損切りの最適な位置はどこですか? 最も安全なのは、強力な供給/需要ゾーンの下/上にストップを置くことで
これはMT4のインジケーターで、再描画なしで取引に参入するための正確なシグナルを提供します。 外国為替、暗号通貨、金属、株式、インデックスなど、あらゆる金融資産に適用できます。かなり正確な見積もりを提供し、取引を開始して終了するのに最適な時期を教えてくれます。1つのシグナルを処理しただけでインジケーターの元が取れた例の 動画 (6:22)をご覧ください。Entry PointsPro インジケーターの助けを借りたほとんどのトレーダーの最初の1週間の結果が改善しています。 Telegramグループ に登録してください。Entry Points Proインジケーターのメリットは次の通りです。 再描画のないエントリーシグナル 再描画されるインジケーターでは一度表示されたシグナルが削除されて大きな金銭的損失につながることがありますが、これと異なり、表示されて確認されたシグナルは消えることがありません。 エラーなしの取引開始 インジケーターアルゴリズムによって取引を開始する(資産を売買する)理想的な瞬間を見つけることができます。それを使用するすべてのトレーダーの成功率が向上します。
This indicator is based on the Gann Signal indicator and acts as a market scanner. All you need to do is fill in the selected currency pairs in the settings and that’s it. Next, the indicator itself will view all these currency pairs and time frames from M5 to D1 simultaneously. When a new signal appears, the indicator will give you an Alert and also draw the letter N where this new signal will be.
プレシジョン・インデックス・オシレーター(Pi-Osc)は、Precision Trading SystemsのRoger Medcalfによるものです。 バージョン2は、チャートにスーパーファストでロードされるように注意深く再コードされ、その他の技術的な改良も組み込まれて、エクスペリエンスを向上させています。 Pi-Oscは、市場が強制的に行かなければならない、すべての人のストップを取り除くためのポイントである、極限のエクソースト・ポイントを見つけるために設計された正確な取引タイミング信号を提供するために作成されました。 この製品は、極限のポイントがどこにあるかを知るという古代の問題を解決し、トレーダーの生活をはるかにシンプルにします。 これは、業界標準のオシレーターとは異なる強力な要素を持つ高度なコンセンサス・インジケーターです。 使用されている一部の機能には、需要指数、マネーフロー、RSI、スティリング、パターン認識、出来高分析、標準偏差の極値などがあり、異なる長さでこれらのバリエーションが多く含まれています。 初めて見ると、訓練されていない目には、他の
ご紹介     Quantum Breakout PRO は 、ブレイクアウト ゾーンの取引方法を変革する画期的な MQL5 インジケーターです。 13年以上の取引経験を持つ経験豊富なトレーダーのチームによって開発された Quantum Breakout PROは 、革新的でダイナミックなブレイクアウトゾーン戦略により、あなたの取引の旅を新たな高みに押し上げるように設計されています。 クォンタム ブレイクアウト インジケーターは、5 つの利益ターゲット ゾーンを備えたブレイクアウト ゾーン上のシグナル矢印と、ブレイクアウト ボックスに基づいたストップロスの提案を提供します。 初心者トレーダーにもプロのトレーダーにも適しています。 量子EAチャネル:       ここをクリック MT5バージョン:   ここをクリック 重要!購入後、インストールマニュアルを受け取るためにプライベートメッセージを送ってください。 推奨事項: 時間枠: M15 通貨ペア: GBPJPY、EURJPY、USDJPY、NZDUSD、XAUUSD アカウントの種類: ECN、Raw、また
Bomb Bank Signal
Igor Pereira Calil
5 (1)
Bomb Bank シグナル: MetaTrader 4 の信頼度インジケーター Bomb Bank Signal は、金融市場で最も関連性の高いトレンドを特定するように設計された MetaTrader 4 の強力なインジケーターです。動きを正確に予測するツールをお探しなら、Bomb Bank が最適です。 仕組み: このインジケーターは、出来高分析、ローソク足終値、対称トレンドという 3 つの異なる方法を組み合わせて、売買の機会を検出してシグナルを送ります。 Bomb Bank は、買いの機会を特定するときは「爆弾」のようなものであり、売りシグナルを検出するときは「ドクロ」のようなものです。 ボムバンクはなぜ違うのですか? 完全な信頼性: Bomb Bank Signal は信号を削除しません。一度シグナルが発せられると、シグナルは残り続けるので、チャンスを逃すことはありません。 極めて高い精度: Bomb Bank は誤った信号を送信しません。リアルタイムで最新情報を更新し、市場の進化に合わせて調整しながら、以前のシグナルの透明性を維持します。 ライブアップデ
PZ Day Trading
PZ TRADING SLU
3.67 (3)
このインディケータは、価格アクション分析とドンチャンチャネルのみを使用して、ジグザグ方式で価格の反転を検出します。再描画やバックペインティングを一切行わずに、短期取引向けに特別に設計されています。それは彼らの操作のタイミングを増やすことを目指している賢明なトレーダーにとって素晴らしいツールです。 [ インストールガイド | 更新ガイド | トラブルシューティング | よくある質問 | すべての製品 ] 驚くほど簡単に取引できます すべての時間枠で価値を提供します 自己分析統計を実装します 電子メール/音声/視覚アラートを実装します 可変長のブレイクアウトと混雑ゾーンに基づいて、インディケータは価格アクションのみを使用して取引を選択し、市場が非常に高速に行っていることに反応します。 過去のシグナルの潜在的な利益が表示されます この指標は、独自の品質とパフォーマンスを分析します 負けブレイクアウトは強調表示され、説明されます インジケータは、非バックペインティングおよび非再ペイントです この指標は、日中のトレーダーが単一の価格反転を見逃さないようにするのに役立ちます。ただし、す
作者のその他のプロダクト
Order management can become difficult, especially when many orders are open at the same time, long and short. With the standard tools from Metatrader, only one order can be changed at the time. In case you want to change the stop loss level or the take profit level of all your open orders this tool is for you. This tool allows to change easily the Stop loss level of ALL the open orders with a simple "Drag and Drop" on the chart. All the orders with the same chart symbol will be modified. Add t
FREE
Order management can become difficult, especially when many orders are open at the same time, long and short. With the standard tools from Metatrader, only one order can be changed at the time. In case you want to change the stop loss level or the take profit level of all your open orders this tool is for you. This tool allows to change easily the Take Profit level of ALL the open orders with a simple "Drag and Drop" on the chart. All the orders with the same chart symbol will be modified. Add
FREE
This indicator displays three forecast projections of the last market swings based on the Zig Zag indicator. Price action moves very often according to what happened in the near past, the indicator displays the price pattern that the market will possibly follow. Both short and long patterns are displayed in the chart with an indication of the target price level. If multiple projections overlap or almost overlap, then the next price movement becomes very likely. In this case it's a ranging market
Extreme Swing Indicator
Filip Maurice Daelman
3.67 (3)
Dear Trader, this is one of the most powerful signals you will find in the market place. I worked many months to improve the accuracy. Check for yourself with the demo version. Parameters are set for EURUSD. I can assist you to configure it for any other symbol or TF. It can be configured to generate more of less in-trend or contra-trend signals. Extreme Swing Indicator is a no-nonsense, no delay, no repaint indicator ! It selects buy/sell entry signals based on a number of swing calculations a
Liquidity Buy Sell Signal Indicator is a no-nonsense, no delay, no repaint indicator ! Liquidity pools together with a trend filter is the most powerful and reliable signal according to me (with the correct parameters depending on the timeframe used) It selects buy/sell entry signals based on liquidity in the market. The time range to scan for liquidity can be set in the parameters. Liquidity is an important aspect in the market, especially for institutional investors, as they need lots of liqu
Multi Level Trend Swing is an indicator that identifies the most accurate buy/sell swing points with the highest probability, based on multi-level Zig Zag Swings. The indicator paints arrows at the Higher Highs, Higher Lows, Lower Lows and Higher Lows in the chart, but based on two level Zig Zag Swing. If the fast price swing is in line with the trend of the slow price swing, then the buy/sell arrows are biggest. If the price swing is against the trend, dots are displayed to signal a Higher High
Multi MA Distance Signal Indicator is a no-nonsense, no delay, no repaint indicator ! Moving Average distance together with a trend filter is a 'simple', but very powerful and reliable signal. The current moving average distance for both a slow and a fast moving average is compared with the past MAD values. For two moving averages, all the distances between the Close price and the moving average (MAD) over a selected period of time are compared with the current MAD "Moving Average Distance". If
Multi MA Band Signal Indicator is a no-nonsense, no delay, no repaint indicator ! Moving Average bands together with a RSI filter is a 'simple', but very powerful and reliable signal. Five "moving average bands" generate the signals. By default : MA25, 50, 100, 200 and 400. This can be changed in the parameters as well as the MA mode and the MA band deviation. The signal indicates the number of moving average bands that are crossed. The higher the value the stronger the signal. Two signal l
Multi Signal Indicator contains a whole series of intersting buy,sell and exit signals that can be separately turned on/off. Signals : Liquidity Pools Liquidity Pools Forecast Projection Reversal Blocks Pinbar groups Overbought/Oversold with Moving Average Band (5 MA bands) Moving Average Difference Liquidity is an important aspect in the market, especially for institutional investors, as they need lots of liquidity to enter or exit the market. Therefore, institutional traders focus more on dema
Ultimum Signal Indicator contains the most powerful buy,sell and exit signals. They can all be be separately turned on/off, so you decide what to display on the chart ! This is my ultimum inidicator that is a no-nonsense, no delay, no repaint indicator ! Signals : Target price levels : Liquidity Pools (Liquidity voids, major supply/demand zones, and price discrepancies) Liquidity Pools Forecast Projection Market Reversals : Reversal Blocks Pinbar groups Trend and mastertrend slowdowns (indicat
Black Cryptex
Filip Maurice Daelman
3 (1)
Extremely intelligent and complex algoritm developed for the Dax or Dow Jones Index. (1 Min Timeframe) Can also be configured for any other index or Forex pair or timeframe, but spread need to be tight. Very good risk/reward ratio. Market entry/exit at overbought/oversold price levels, based on complex calculations. Risk management is done by starting with a very small initial position. The position is optimised by averaging in an intelligent way. - Fast moving average reversal - Moving average
Multi Level Trend Direction is an indicator that identifies the most accurate buy/sell swing points with the highest probability, based on multi-level Zig Zag Swings. The indicator draws a color Zig Zag at the Higher Highs, Higher Lows, Lower Lows and Higher Lows in the chart, but based on two level Zig Zag Swing. If the fast price swing is in line with the trend of the slow price swing, then the buy/sell trend lines are bigger. If the price swing is against the trend, no lines are drawn to si
New market liquidity indicator, more accurate with two levels, will really unhide the "hidden agenda" of the price action in any timeframe. For more information about market liquidity, a manual on how to use this indicator please send me a message. A lot of information can be found on the net. (search liquidity trading/ inner circle trader) https://www.youtube.com/watch?v=yUpDZCbNBRI https://www.youtube.com/watch?v=2LIad2etmY8&amp ;t=2054s https://www.youtube.com/watch?v=wGsUoTCSitY&amp ;t
Liquidity Pools
Filip Maurice Daelman
5 (1)
Dear Traders, check out my new multi level market liquidity indicator :  https://www.mql5.com/en/market/product/73098 Many of you have been trading very good with this indicator, thanks for the support and positive feedbacks ! For more information about market liquidity, a manual on how to use this indicator please send me a message. A lot of information can be found on the net. (search liquidity trading/ inner circle trader) https://www.youtube.com/watch?v=yUpDZCbNBRI https://www.youtube.c
フィルタ:
tsomoney
209
tsomoney 2021.11.09 20:11 
 

ユーザーは評価に対して何もコメントを残しませんでした

247stocknow
192
247stocknow 2021.10.19 16:46 
 

I know what Liquidity is, but Need an Manual for your program. Defiantly would have been 5stars but no manual.

educlassic
54
educlassic 2021.01.13 04:12 
 

ユーザーは評価に対して何もコメントを残しませんでした

macdours
19
macdours 2020.11.05 00:10 
 

I too purchased the indicator but I am having to try and figure it out on my own, since there is no manual that comes with the indicator. I can see how it could be profitable but I have not used it yet. I have been waiting for the United States elections to finish up. If the seller could respond with a manual that would be extremely helpful.

gijs_best_service
21
gijs_best_service 2020.10.14 18:31 
 

Really good indicator!! Would be awesome to have some kind of manual to understand all the colors. Have been making good profits since using this indicator. Hope seller will respond on chat!

レビューに返信
バージョン 10.0 2020.07.22
Better accuracy
バージョン 8.0 2020.07.13
Default set for EUR/USD
バージョン 7.0 2020.07.10
Bug fixes
バージョン 6.0 2020.07.08
Updates, bugfixes
バージョン 5.0 2020.07.05
One indicator with different signals :

- Moving Average bands + difference
- Reversal Blocks
- Liquidity Pools
バージョン 4.0 2020.07.01
Additional features
バージョン 3.0 2020.07.01
Addition of reversal signals
バージョン 2.0 2020.05.08
- Minor fixes
- Possibility to change the color