FFx MACD Divergences
- インディケータ
- Eric Venturi-Bloxs
- バージョン: 1.2
- アップデート済み: 16 6月 2021
- アクティベーション: 5
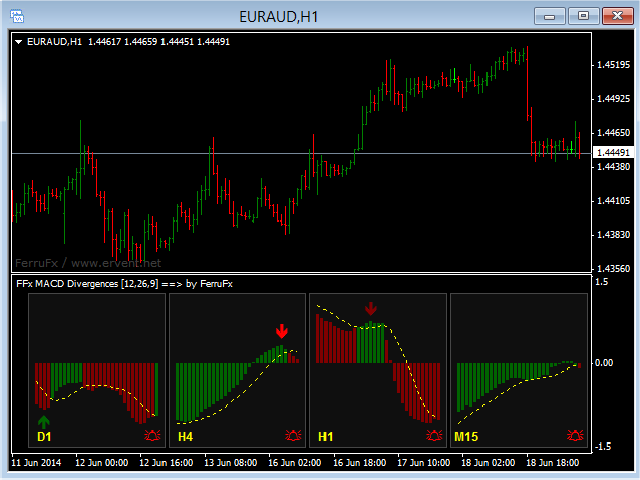
The purpose of this new version of the MT4 standard indicator provided in your platform is to display in a sub-window multiple timeframes of the same indicator with its divergences. See the example shown in the picture below.
But the display isn't like a simple MTF indicator. This is the real display of the indicator on its timeframe.
Here's the options available in the FFx divergences indicator:
- Select the timeframes to be displayed (M1 to Monthly)
- Define the width (number of bars) for each timeframe box
- Alert pop up/sound/email/push (histogram crosses signal line and/or histogram crosses 0 line and/or divergences)
- Activate/deactivate the alert directly on the chart
- Modify all the colors
- ... and of course all usual settings of the standard indicator
How to set an alert
In the parameters pop up: select the alert you want and the alert mode (pop up and/or sound and/or email and/or push notification)
Then on chart single click on the bell (or 'A' character) showing in the box. The color will then change. Red to Green means it is now activated, Green to Red means that it is now deactivated.


Brilliant!