Diviner PRO
- インディケータ
- Andrei Sennikov
- バージョン: 1.0
- アクティベーション: 5
Diviner PRO
Divine PRO indicator is
based on the random forest machine learning algorithm. This is my first standalone product. In this indicator, all
calculations of price patterns and
the formation of indicator trading signals is performed through 43x Trees. I chose this amount to keep the indicator deep in
training and reduce the size of the indicator.
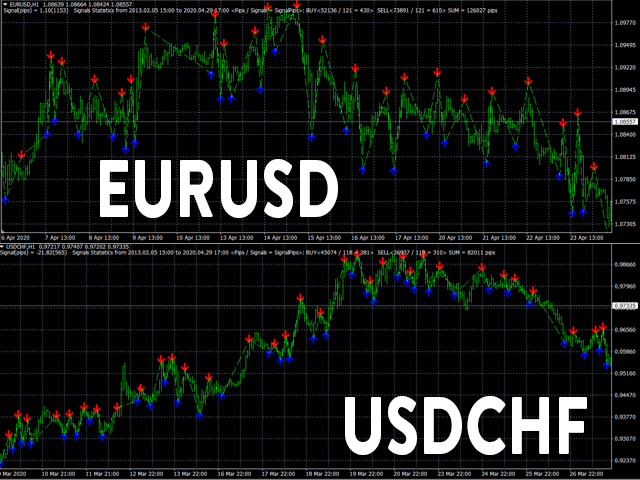
DIVINE indicator -
universal indicator, can work with the following: EURUSD,
USDCHF, GBPUSD.
In the future I will conduct experiments to find the most suitable number of trees. The indicator predicts pivot points and price
direction with
displaying the corresponding signals for the execution of trading operations BUY and SELL.
The difference Diviner PRO indicator with previous one (Diviner) is in learning method. Diviner PRO has been trained on each bars and it makes the learning process more deeply.
Settings:
- U_BUY - threshold % value for calculating a buy signal.
- U_SELL - threshold % value for calculating a sell signal.
Recommendations:
Before using indicator signals in trading, try to configure them as much as possible perhaps the average statistical size in points, by selecting the optimal BUY and SELL threshold values, and it is desirable to obtain these values for the next trading period.
Recommendation timeframe H1.