Time and Price Line
- インディケータ
- Kang Yi Da Tian
- バージョン: 2.2
- アップデート済み: 20 12月 2023
- アクティベーション: 5
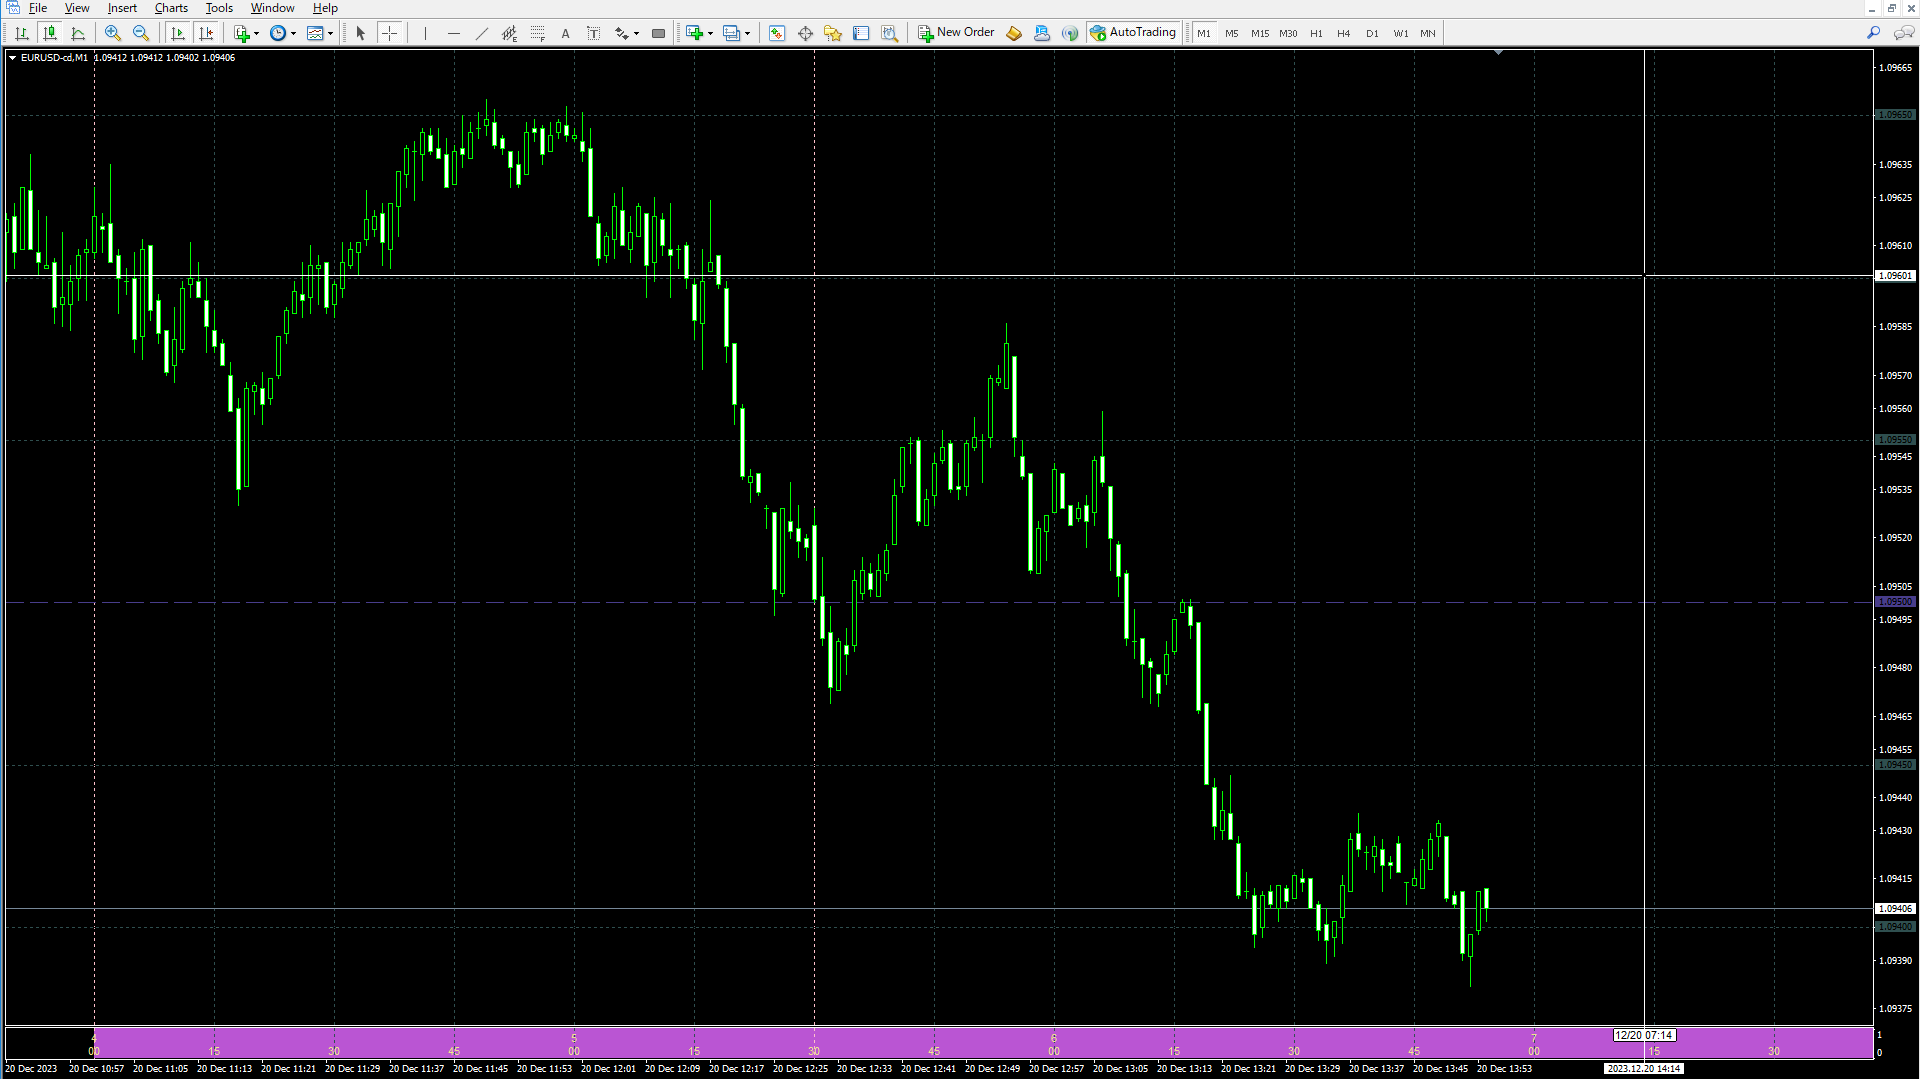
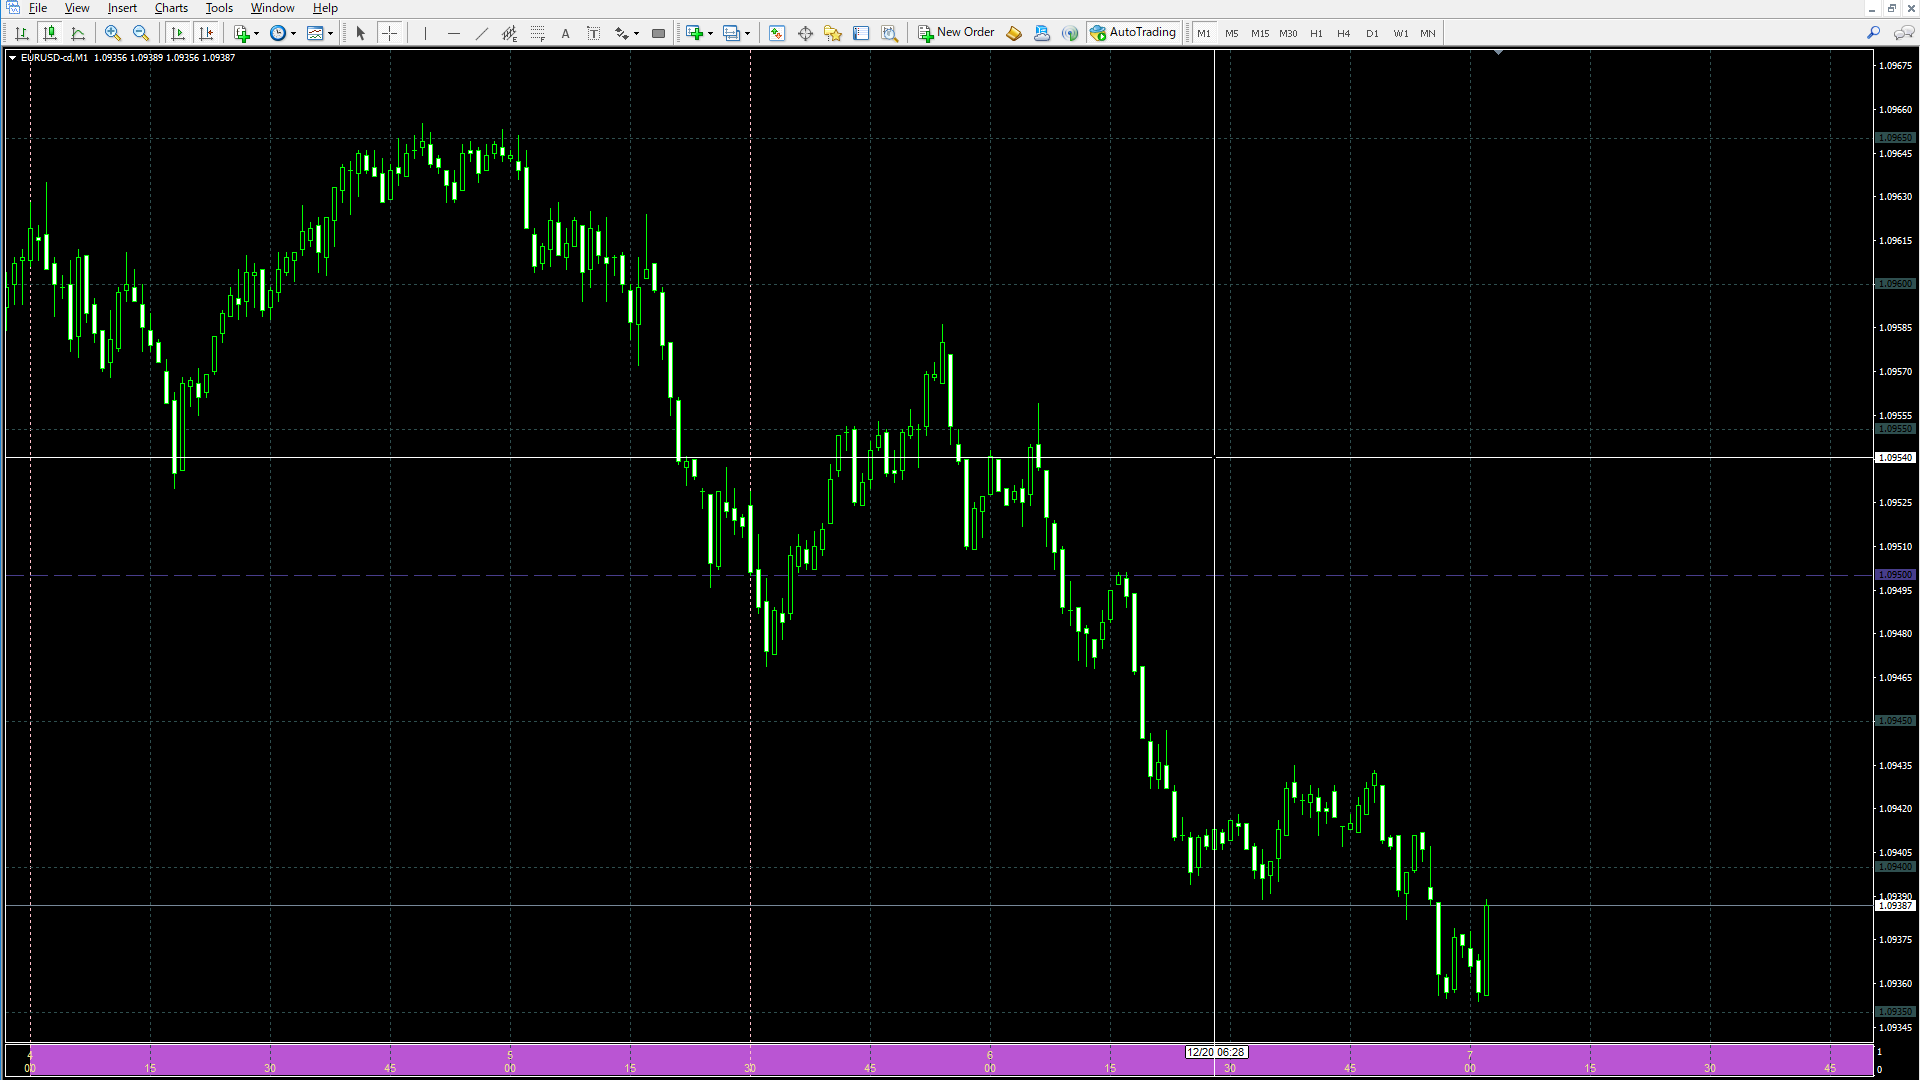
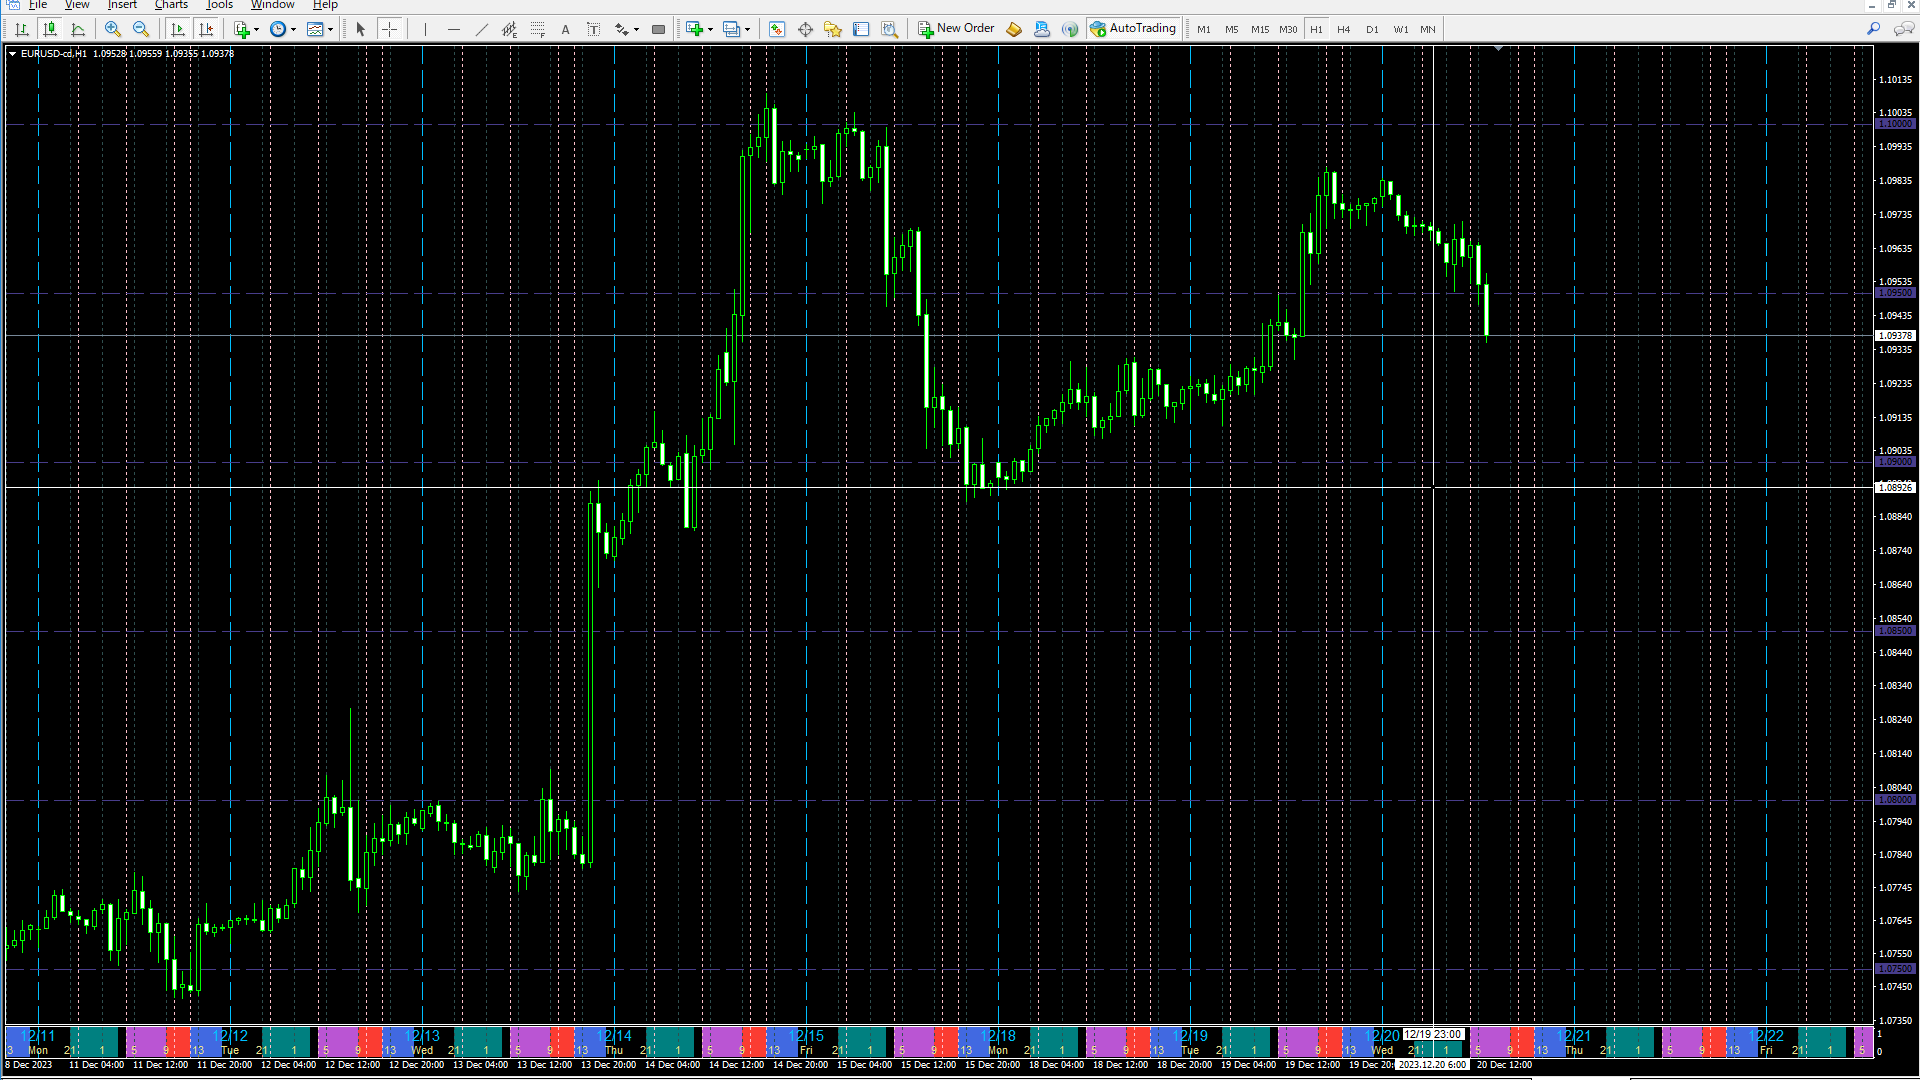
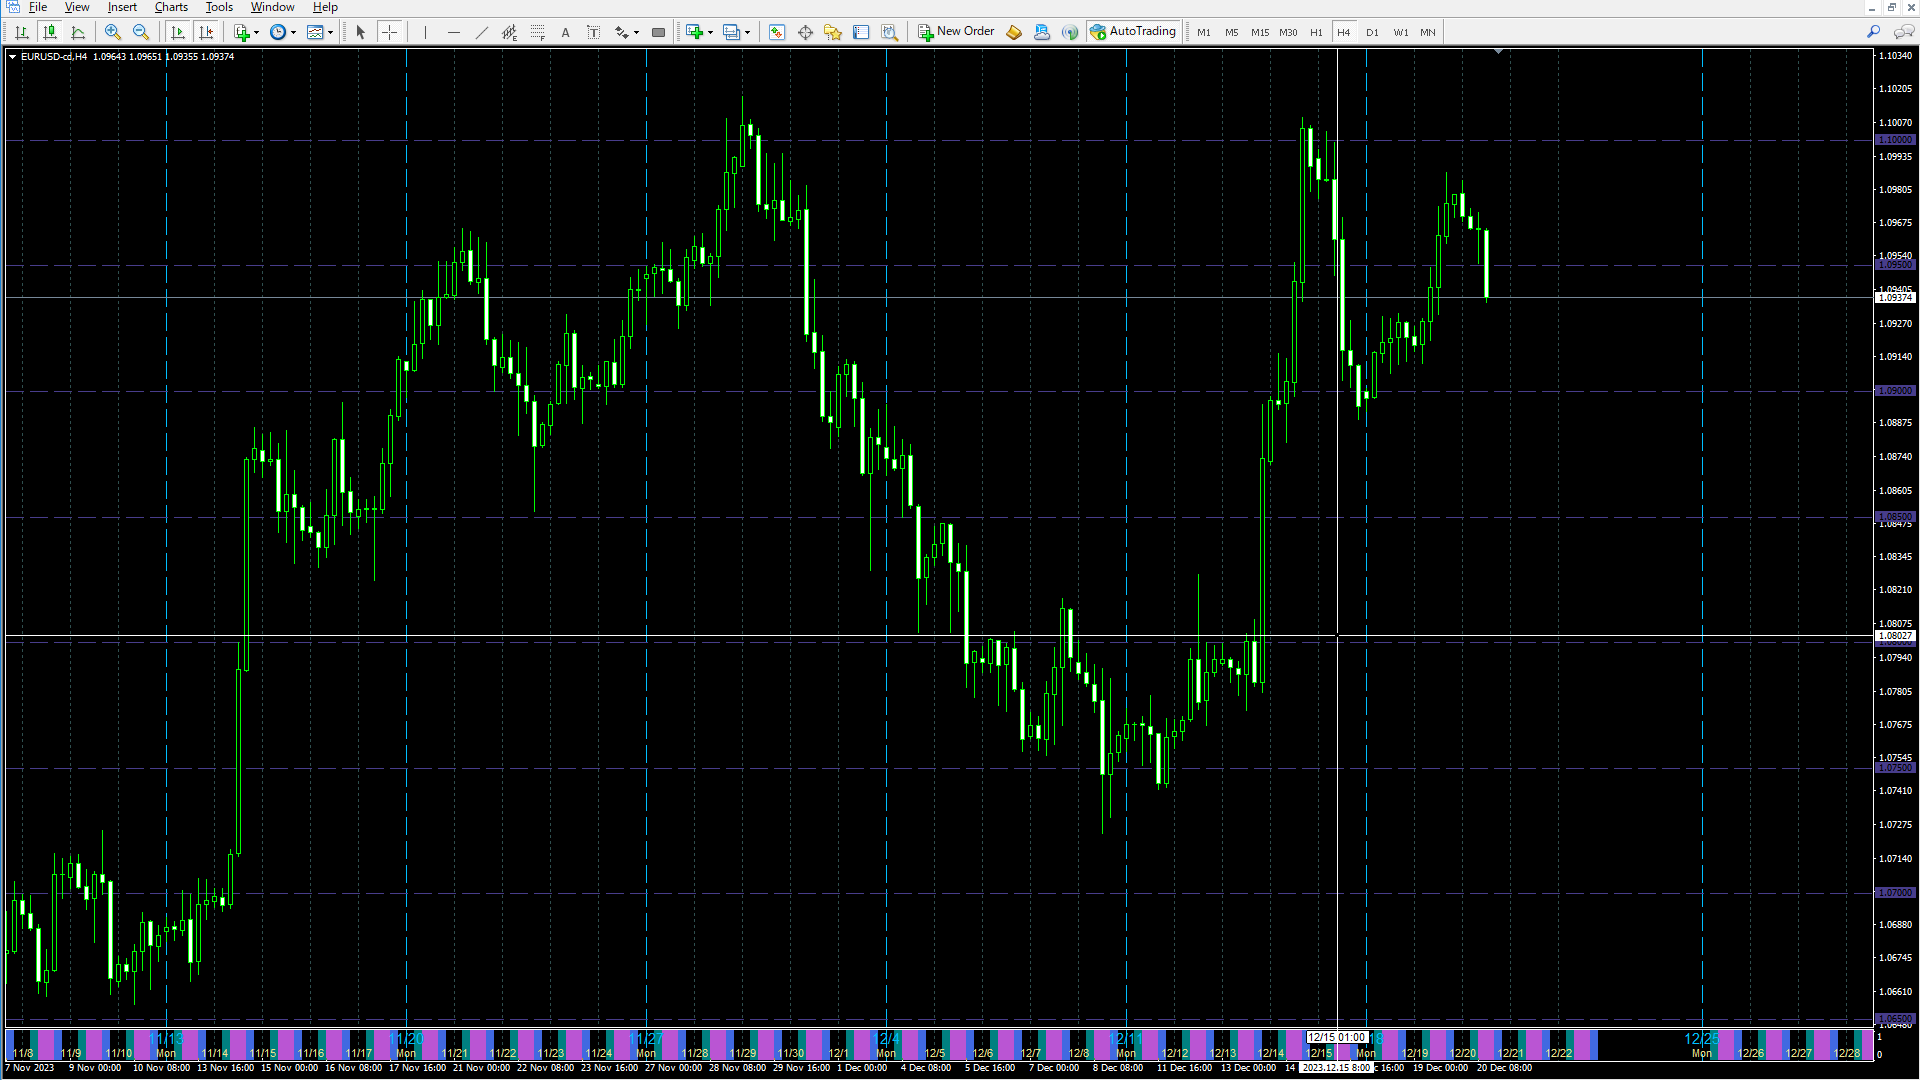
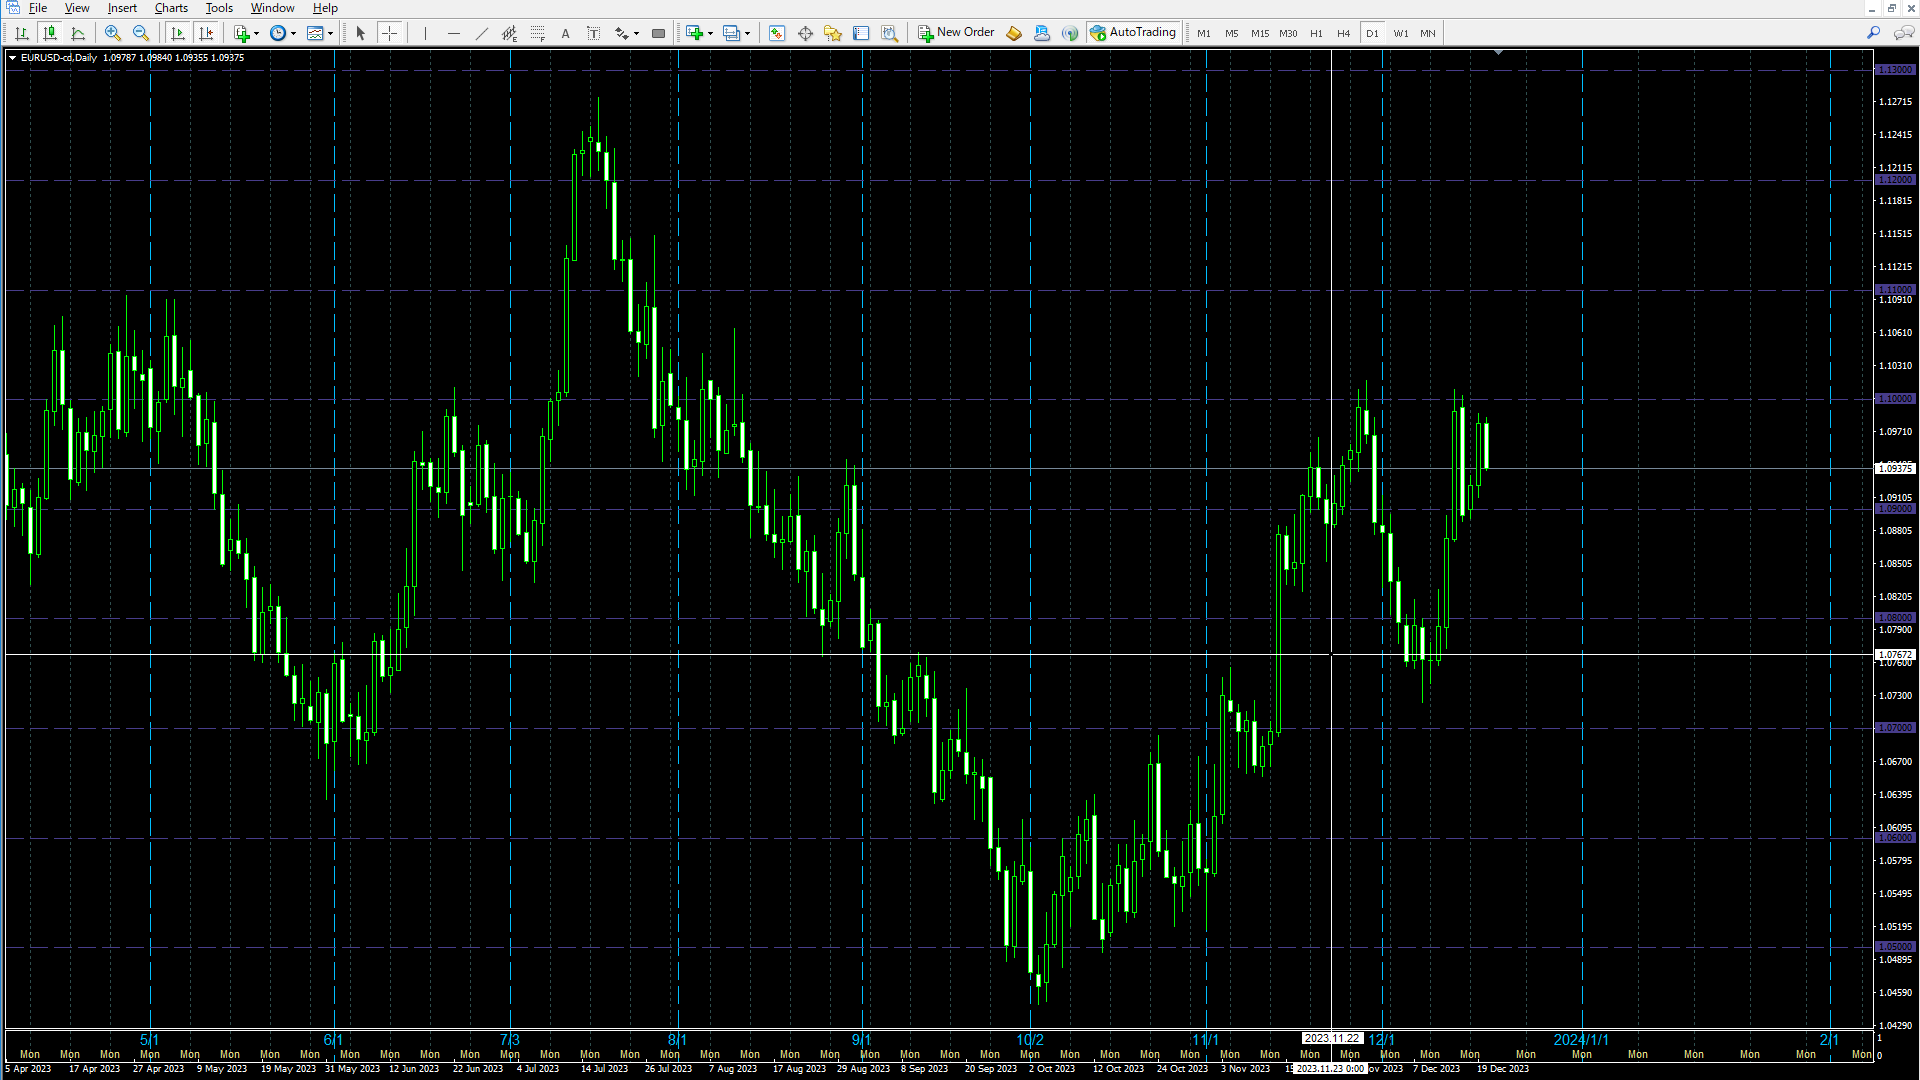
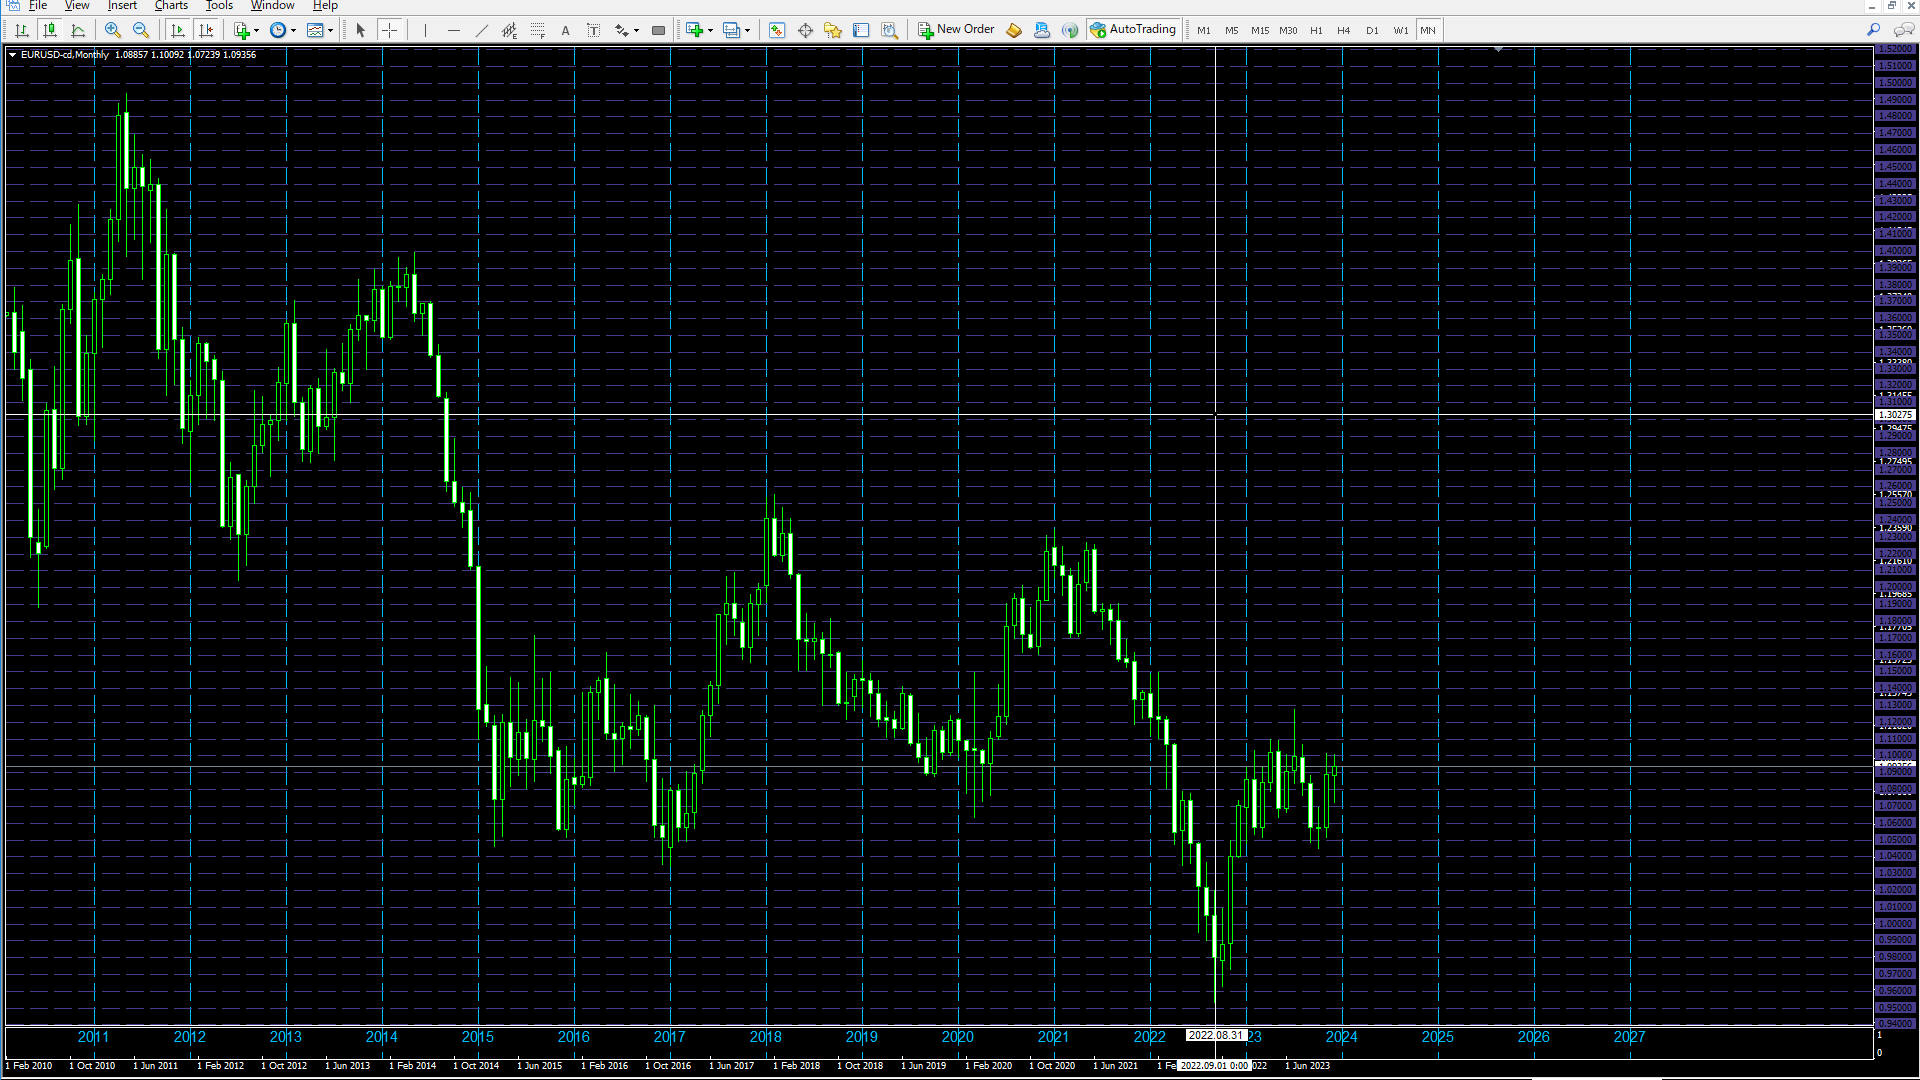
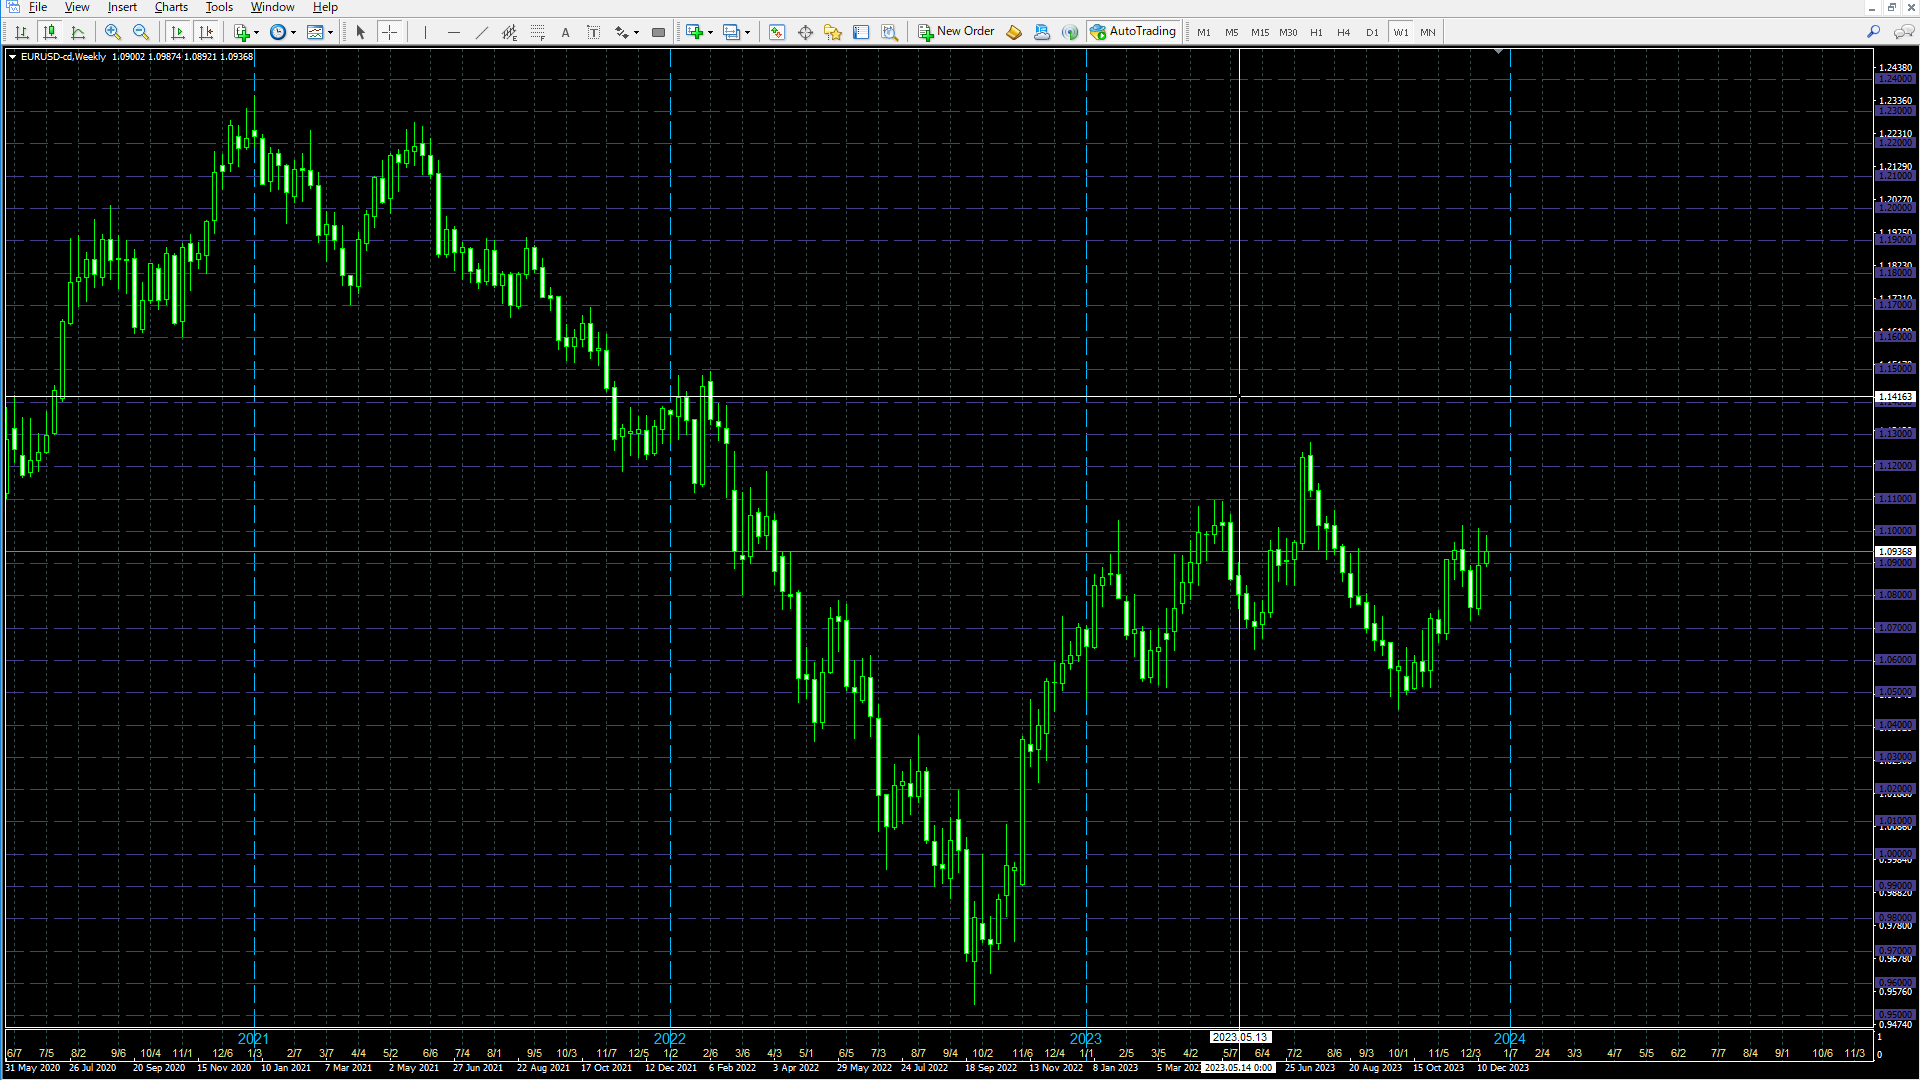
設定した時差で時間ラインを表示します。(30分単位の時差には対応していません。) また、100.000、.100、.200のようにキリの良い価格で価格ラインを表示します。
標準ではMT4による時間と価格でグリッドラインが表示されていますが、ブローカーの時間となり価格とともに中途半端な位置で表示されるので、非常に分かりにくいものとなっています。
それを非表示にしユーザーが設定した時差と価格の分かりやすい位置でグリッドラインを表示します。他のEAや裁量取引に負荷をかけないよう、軽快に動作するよう実装しております。
時間ラインは未来の時間も表示します。事前に節目となる時間の把握ができます。(土日の時間軸は表示されません。)
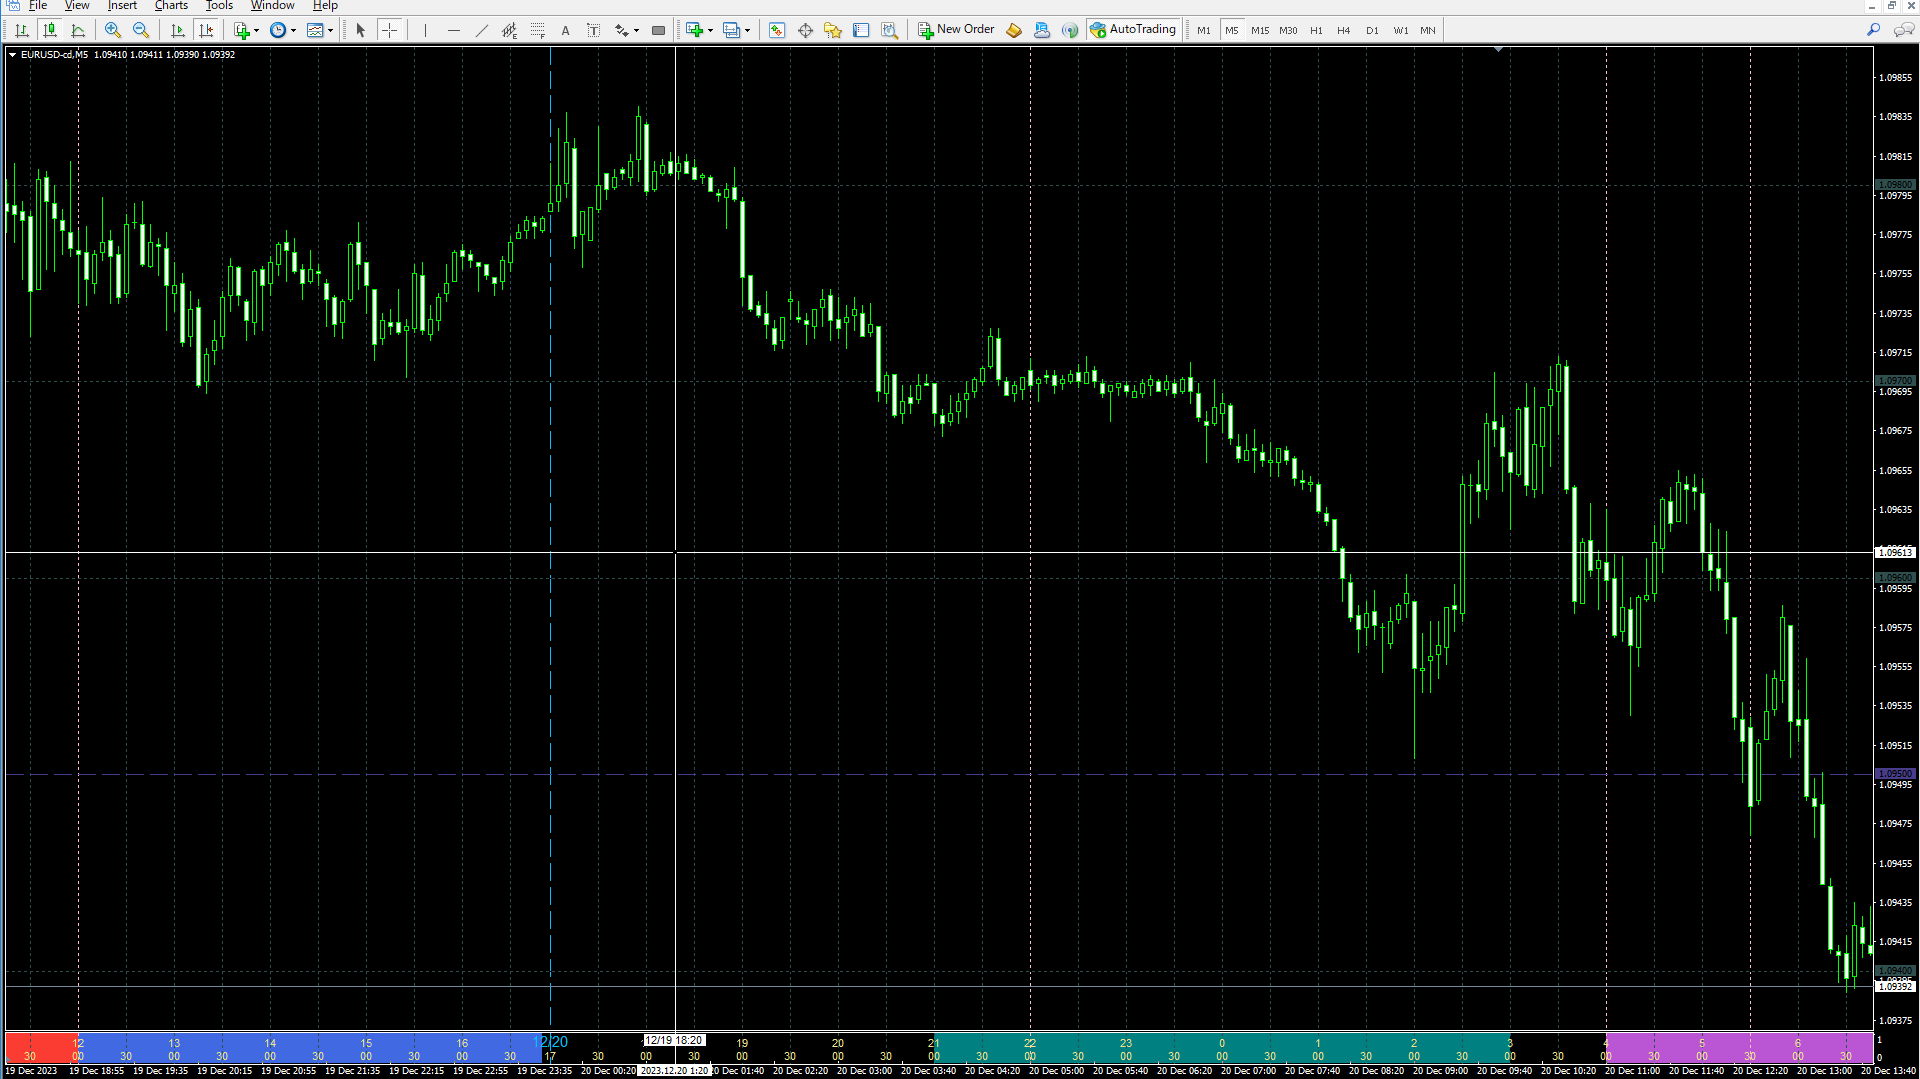
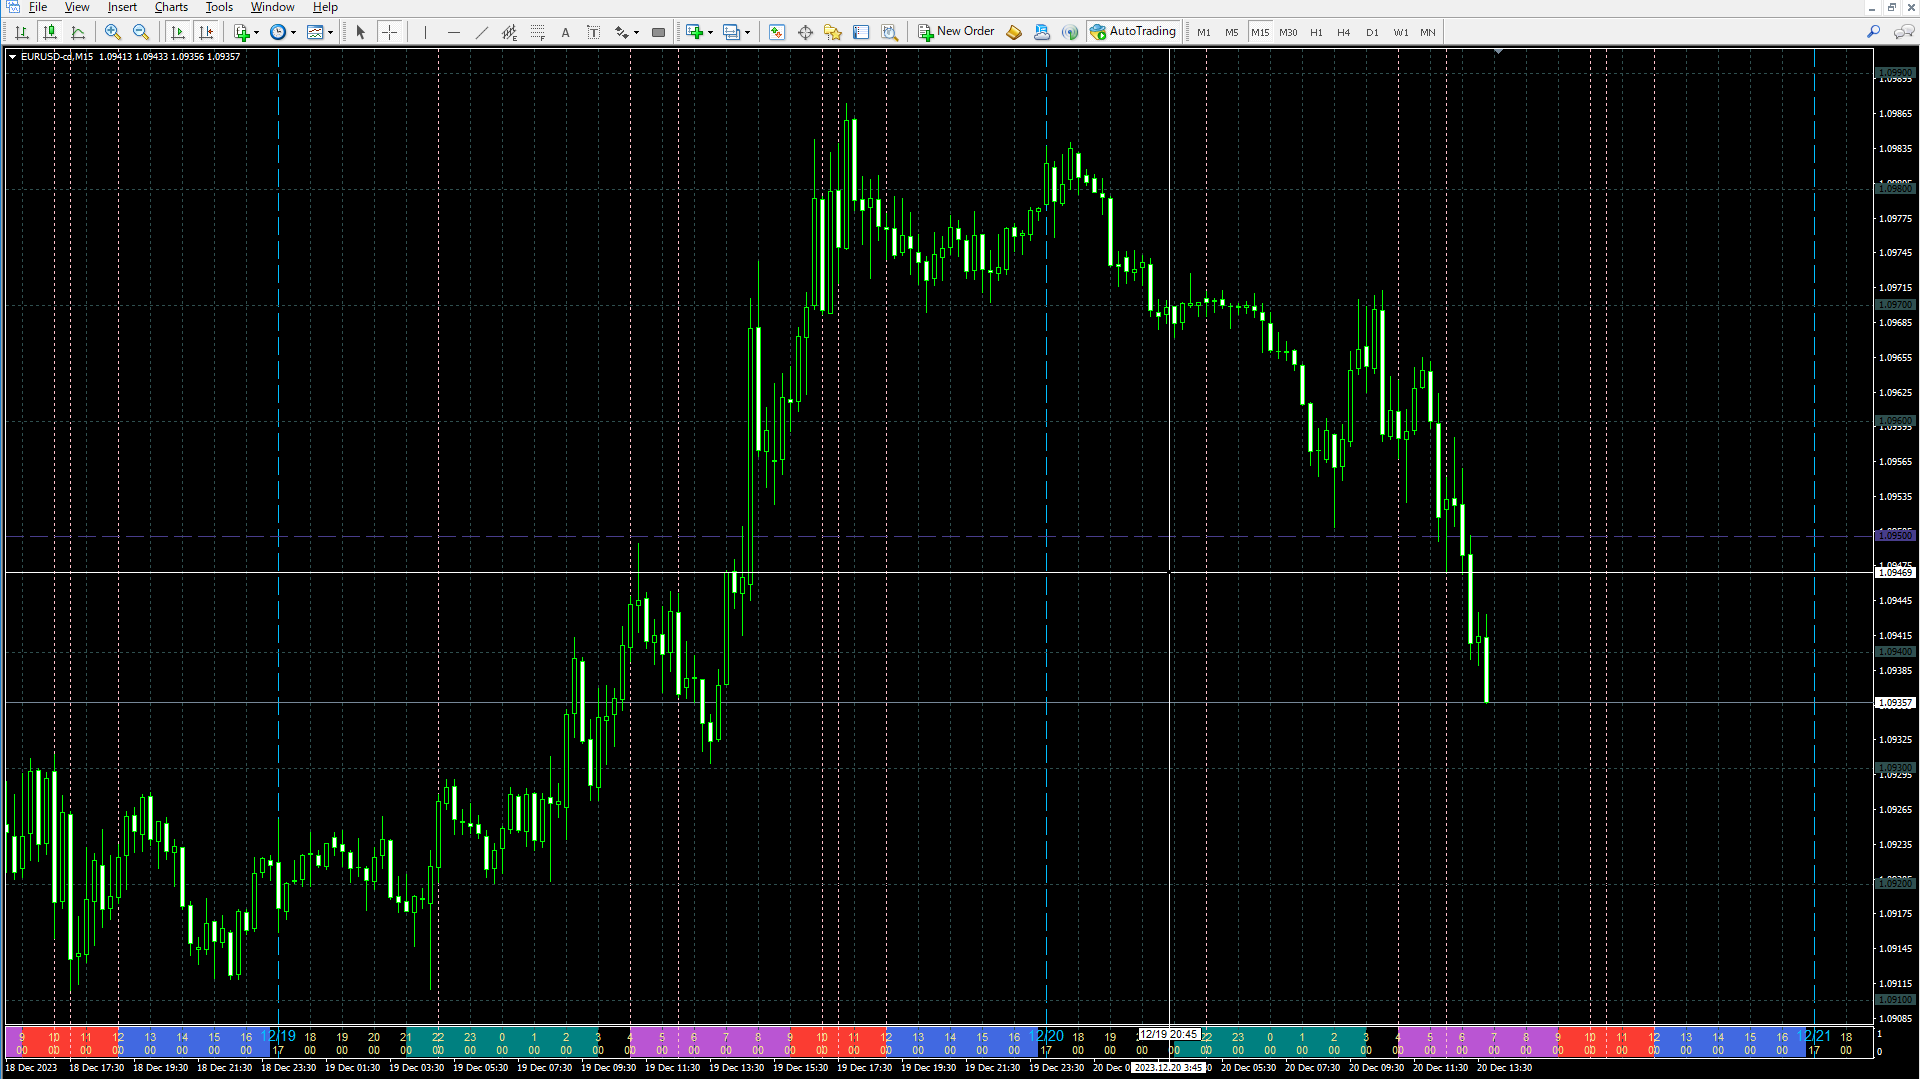
アジア、EU、USの時間帯を色付きで表示できます。
マーケットの開始時刻や、イベントの時間など特定の時間をSpecial Timeとしてラインを表示することができます。
パラメーター説明
| ・Time offset: | MT4上の時間に対する時差を設定します。 |
| ・Bars time range: | 時間ラインを表示する範囲をバーの本数で設定します。 |
| ・Price line step Minute (Pips) ・Price line step Hour (Pips) ・Price line step Day (Pips): | 価格ラインの表示間隔をPipsで設定します。 MinuteはM1,M5,M15,M30、HourはH1,H4、DayはD1,W1,MNでの設定値になります。 |
| ・Time interval M1 - H1: | 時間ラインの表示間隔を設定します。H4、D1、W1、MNは固定表示になります。 |
| ・Time notation: | 時間の表示形式を設定します。 |
| ・Date notation: | 日付の表示形式を設定します。 |
| ・Base line color: | 時間ラインと価格ラインの色を設定します。 |
| ・Base line style | 時間ラインと価格ラインのスタイルを設定します。 |
| ・Time font size: | 時間のフォントサイズを設定します。 |
| ・Time color: | 時間の色を設定します。 |
| ・Day and year color: | 日付の色を設定します。 |
| ・Day and year line color: | 日付ラインの色を設定します。 |
| ・Price support line (Pips): | .000、.500など節目となる価格に表示するラインを設定します。 50Pipsと設定すると、100.000、100.500、100.100のように50PipsごとにBase lineとは別の色でラインが表示されます。 |
| ・Price support line color: | Price support lineの色を設定します。 |
| ・Price support line style: | Price support lineのスタイルを設定します。 |
| ・Asia open time: ・Asia end time: | アジアの時間帯の開始時間と終了時間を設定します。 |
| ・EU open time: ・EU end time: | EUの時間帯の開始時間と終了時間を設定します。 |
| ・US open time: ・US end time: | USの時間帯の開始時間と終了時間を設定します。 |
| ・Asia range color: ・EU range color: ・US range color: | アジア、EU、USの時間帯の色を設定します。 |
| ・Special Time 1 - 6: | マーケットオープン時刻、イベントなど特定の時間に表示するラインを設定します。6個まで設定できます。 H4、D1、W1、MNには表示されません。 |
| ・Special Time 1 - 6 color: | Special Timeのラインの色を設定します。 |
| ・Special Time line style: | Special Timeのスタイルを設定します。 |