Reversible
- インディケータ
- Vitalii Zakharuk
- バージョン: 1.0
- アクティベーション: 5
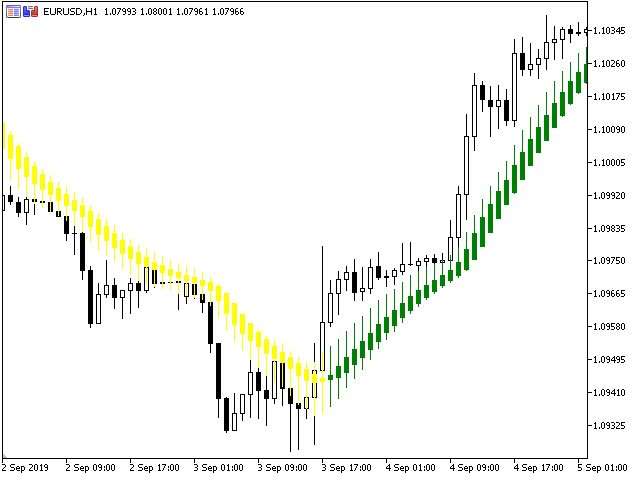
Reversible indicator.
You need to understand that any indicator is just a visual waveform. Currency pairs never rise or fall in a straight line. Their rises and
falls are alternated by pullbacks and turns.
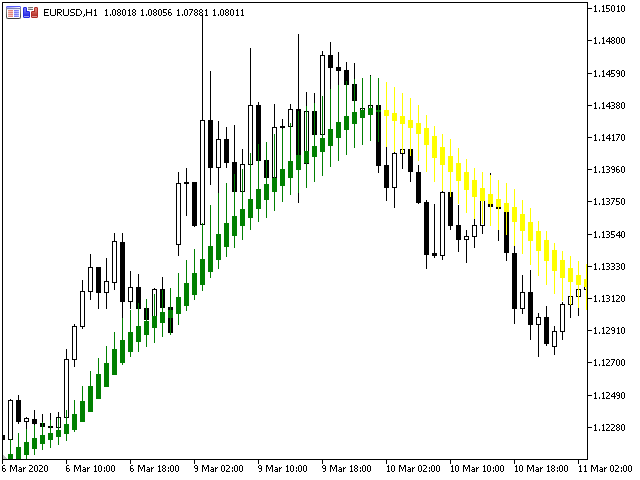
The Reversible indicator contains an entire trading system, processes information from several technical instruments and the
appearance of its signals is the final calculation result. The indicator itself evaluates how strong a signal appears in the market and
when to change direction, signals about it, and the trader can only make a trading decision. This indicator works on all timeframes.
Entering the market is not difficult, but staying in it is much more difficult. With the Reversible indicator and its unique yellow trend line,
staying in trend will be much easier! Everything will change if you use the Reversible indicator.