• 概要
  • レビュー
  • コメント (1)

Multi Dashboard Scalper


Multi Currency Strength Dashboard Scalper

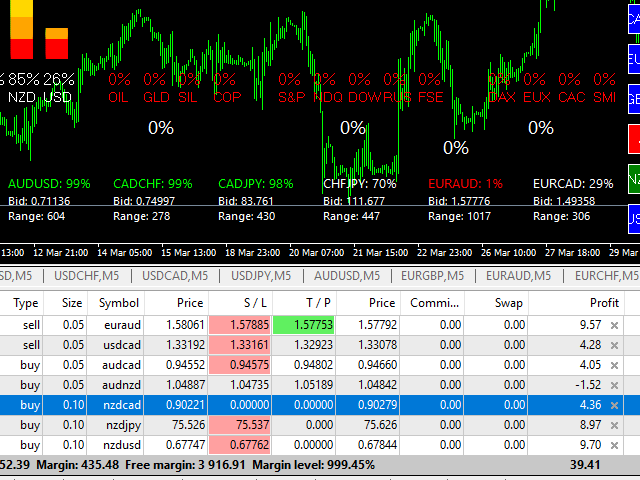
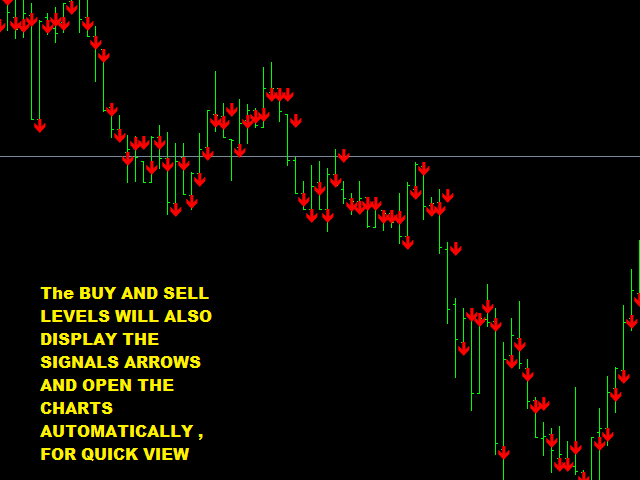
SCALP SIGNALS BASED ON THE ANALYSIS OF THE STRENGTH OF THE CROSS CURRENCY PAIRS- MAKES THE SIGNALS STRONG


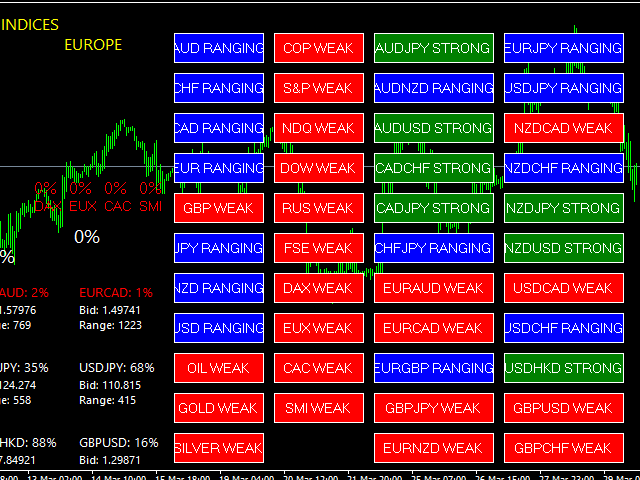
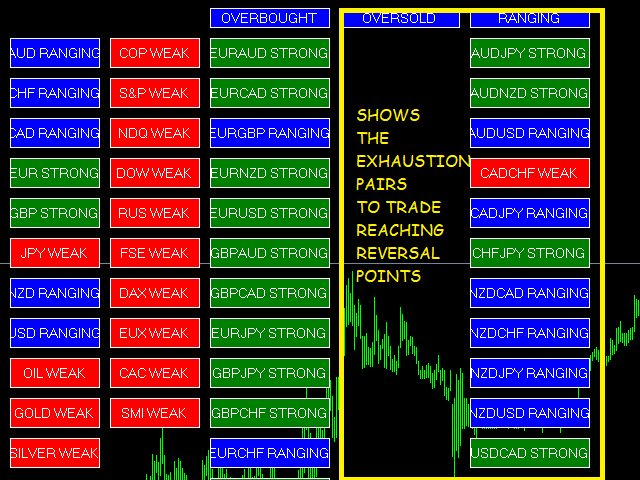
Indicator Dashboard- calculates the strength of all markets , currency pairs , commodities .
Using a proprietary logic. This data can be used to judge and take decisions whether to buy or sell them.
If the particular market is strong means it is bullish , and also the related pair of that market is strong then it will be highly probable that there will be rise in that .
Same way if weak will fall.
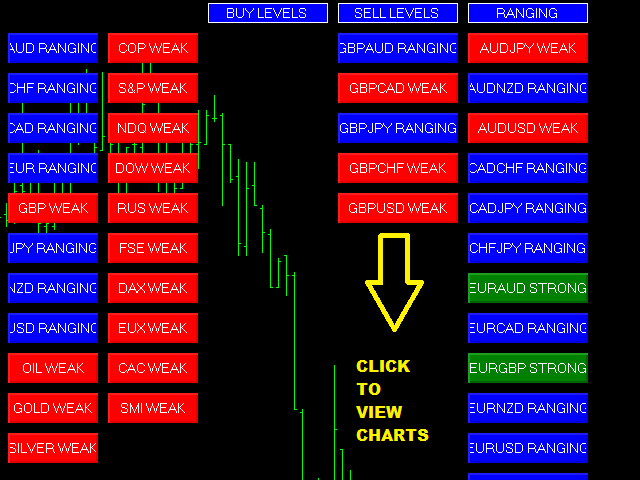
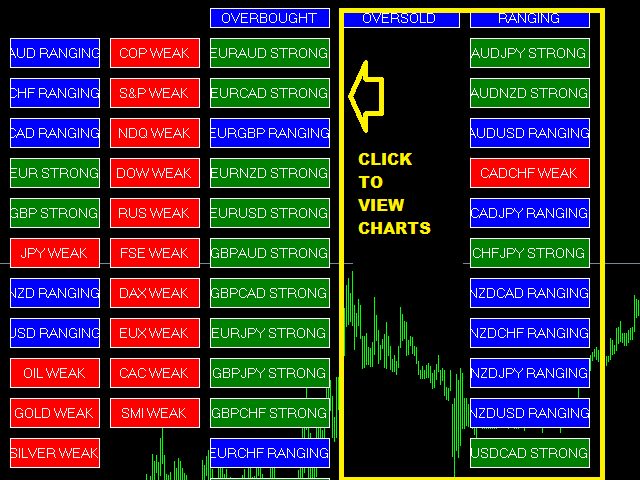
It also provides the entire global markets view at a glance and also the exact level in weak and strong percentage basis , same way if they are just moving in a tight range then they reflect as RANGE BOUND.
The levels of the strength can be changed from inputs in case required.
So by looking at the highlighted green and red zones of strong and weak, the trades can be taken accordingly.
Apply stop loss and all risk management and money management tools .


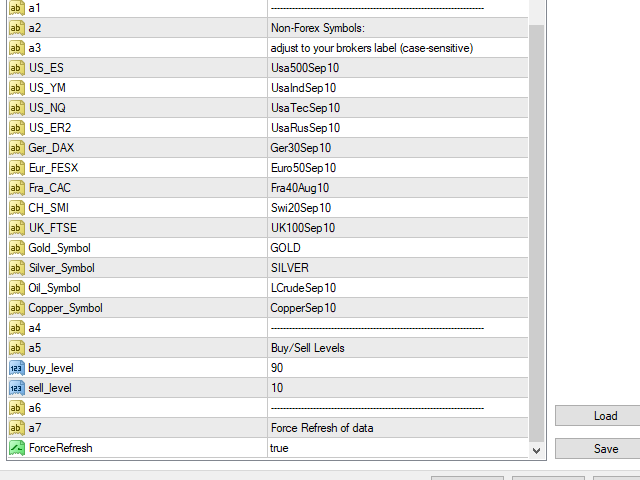
INPUT PARAMETERS LEVELS SET FOR THE STRONG AND WEAK MARKET  StrongLevel = 80; WeakLevel = 20;MARKET OPENING AND CLOSE TIMINGS 

 RUSOpenTime = "02:00";
 RUSCloseTime = "00:00";
 FTSEOpenTime = "09:00";
 FTSECloseTime = "22:00";
 DAXOpenTime = "08:00";
 DAXCloseTime = "22:00";
 EUXOpenTime = "08:00";
 EUXCloseTime = "22:00";
 CACOpenTime = "09:00";
 CACCloseTime = "17:30";
 SMIOpenTime = "09:00";
 SMICloseTime = "17:30";
-----------------------------------------------------------------------";
"Non-Forex Symbols:";
"adjust to your brokers label (case-sensitive)";
US_ES="Usa500Sep10";
US_YM="UsaIndSep10";
US_NQ="UsaTecSep10";
US_ER2="UsaRusSep10";
Ger_DAX="Ger30Sep10";
Eur_FESX="Euro50Sep10";
Fra_CAC="Fra40Aug10";
CH_SMI="Swi20Sep10";
UK_FTSE="UK100Sep10";
Gold_Symbol="GOLD";
Silver_Symbol="SILVER";
Oil_Symbol="LCrudeSep10";
Copper_Symbol="CopperSep10";
"-----------------------------------------------------------------------";
"Buy/Sell Levels"; ( for the strength of the individual pairs and commodities )
buy_level = 90;
sell_level = 10;
"-----------------------------------------------------------------------";
"Force Refresh of data"; - refreshes the dashboard 
 ForceRefresh=true;

おすすめのプロダクト
Volume Confirm Trend Zone is the indicator for filtering sideways and confirm trend to help your system trading. Indicator can use every currency pairs, every time frame, and every broker. You can see trend zone when color to change in volume indicator. Features When the color changes to the blue: Buy Zone is a strong trend. When the color changes to the red: Sell Zone is a strong trend.
Matrix is a Forex arrow indicator. Displays signals simply and clearly! The arrows show the direction of the transaction, and are colored accordingly, which can be seen in the screenshots. As you can see, trading with such an indicator is easy. I waited for an arrow to appear in the desired direction - I opened a deal. An arrow formed in the opposite direction - closed the deal. The indicator also displays the lines with the help of which the arrow signals are formed, taking into account the int
You can change the time period of the chart at the touch of a button. You can also change multiple charts at the touch of a button. You can also change multiple charts at the touch of a button, saving you the trouble of changing time periods. We are live-streaming the actual operation of the system. https://www.youtube.com/@ganesha_forex We do not guarantee your investment results. Investments should be made at your own risk. We sharll not be liable for any disadvantage or damage caused by
Basic Support and Resistance インジケータは、テクニカル分析を強化するために必要なソリューションです。このインジケータを使用すると、チャートにサポートレベルとレジスタンスレベルを投影できます/ mt5バージョン 機能 フィボナッチレベルの統合: サポートと抵抗レベルとともにフィボナッチレベルを表示するオプションを使用すると、私たちの指標は市場行動と逆転領域の可能性についてさらに深い洞察を提供します。 パフォーマンスの最適化: 各バーの開口部のみで拡張ラインを更新するオプションを使用すると、インジケータは、サポートレベルと抵抗レベルの精度を犠牲にすることなく最適なパフォーマンスを保証します。 入力 メイン設定 Timeframe:  この入力を通じて、より高い時間枠のサポートラインとレジスタンスラインをチャート上に表示することを選択できます。 Support/Resistance Strength [Number of Bars]:  この入力を使用して、サポートと抵抗の強度を決定できます。数が高いほど、サポート/抵抗がより強くなります。 Pri
Daily Average - Retracement Dashboard   is an indicator that allows you to monitor more than one currency pairs at one time. This indicator is mainly for strategy that trade price retracement based on Resistance3/4 or Support 3/4. After apply this indicator to the chart window, it will hide the chart and display the currency pairs in a table form. There are several data shown on the table that will help trader know when to analyze the currency and do trade using retracement. The indicator will s
A "Volume Profile" is an advanced charting indicator that displays total volume traded at every price level over a user specified time period. The main components of the volume profile are POC ( Point Of Control - the price level, at which the maximum number of contracts were executed during a selected period), VAH ( Value Area High - the highest price in the Value Area) and VAL ( Value Area Low - the lowest price in the Value Area). When we settled on the original indicator, we spent a lot o
We present you the indicator "Candle closing counter", which will become your indispensable assistant in the world of trading. That’s why knowing when the candle will close can help: If you like to trade using candle patterns, you will know when the candle will be closed. This indicator will allow you to check if a known pattern has formed and if there is a possibility of trading. The indicator will help you to prepare for market opening and market closure. You can set a timer to create a p
Robi Auto Expert Advisor works using sharp tick movements. It goes through the entire history and all currency pairs with one single setting. The more latency your broker has in the amount of the Internet channel, the higher you need to set stop loss, take profit and trailing stop so that the server can process them at the desired price and the lower the trading frequency will be. The uniqueness of the Expert Advisor is that it can be run on any hourly period, on any currency pair and on the se
Median Renko Terminator works best with renko charts if you do not have a renko chart generator I will email it to you for free and give you the correct settings for scalping or to swing trade NON-REPAINT  COMES WITH ALERTS WHEN THERE IS A SIGNAL Conditions to sell: big purple arrow shows you the direction first then you take the small purple arrow to enter the same direction of the purple arrow. Conditions to buy: big white arrow shows you the up direction first then you take small white arrow
TWO PAIRS SQUARE HEDGE METER INDICATOR Try this brilliant 2 pairs square indicator It draws a square wave of the relation between your two inputs symbols when square wave indicates -1 then it is very great opportunity to SELL pair1 and BUY Pair2 when square wave indicates +1 then it is very great opportunity to BUY pair1 and SELL Pair2 the inputs are : 2 pairs of symbols         then index value : i use 20 for M30 charts ( you can try other values : 40/50 for M15 , : 30 for M30 , : 10 for H1 ,
Scalping Snake Proは、トレーダーに価格逆転の瞬間を示し、再描画しないユニークなスキャルピングインジケーターです。このインジケーターは、インターネット上の他の多くのインジケーターとは異なり、その値を再描画しません。それはあなたが取引を開くのに遅れないことを可能にする最初のバーにシグナルを描きます。このインジケーターは、シグナルが表示されたときに電話と電子メールでトレーダーに通知を送信します。このすべての機能をたったの147ドルで手に入れることができます。 この指標と取引する方法は? H1タイムフレームを開きます。通貨ペアGBPUSDまたはEURUSD。インジケーターが青い線を引く最初のバーを待っています。 TakeProfitを購入して+20ポイントを設定する取引を開始します。 StopLossは反対方向のシグナル、つまり赤い線になります。売り取引を開始するには、インジケーターが赤い線を引く最初のバーを待ちます。その後、販売取引を開始します。利益を20ポイント獲得します。 StopLossは反対方向、つまり青い線の信号になります。 このインジケーターは再描画されて
Exclusive Limited Time Offer! Grab this powerful indicator for a lifetime at just $65. Open the power of precise decision-making with our revolutionary product, FX Correlation Matrix. This indicator is your key to understanding multiple FX currency pairs' positive and negative correlations at a glance, providing valuable insights to elevate your trading strategies. Indicator Features: Multiple-Frame Multi-Currency Dashboard: Displays 10 multiple currency pairs positive and negative correlati
Noize Absorption Index - is the manual trading system that measures the difference of pressure between bears forces and bulls forces. Green line - is a noize free index that showing curent situation. Zero value of index shows totally choppy/flat market.Values above zero level shows how powerfull bullish wave is and values below zero measures bearish forces.Up arrow appears on bearish market when it's ready to reverse, dn arrow appears on weak bullish market, as a result of reverse expectation. S
Was: $249  Now: $99   Market Profile defines a number of day types that can help the trader to determine market behaviour. A key feature is the Value Area, representing the range of price action where 70% of trading took place. Understanding the Value Area can give traders valuable insight into market direction and establish the higher odds trade. It is an excellent addition to any system you may be using. Blahtech Limited presents their Market Profile indicator for the MetaTrader community. Ins
The Indicator show Daily Pivot Points. It is possible to specify the number of days to display. For forex it doesn't consider the sunday session data. It is possibile to modify the color, style and  width for every level.It is better to use this indicator with timeframe not higher than Н1. 4 Levels of support and resistance with also Intermediate Levels that is possible to hide. Pivot trading: 1.pp pivot 2. r1 r2 r3, s1 s2 s3 Pivot points have been a trading strategy for a long time
ICT Kill zone and Macros Indicator mark and display the following zone times on the chart: Kill zones   Kill zone Forex Asian London Open New York Open London Close Central Bank Dealing range Kill zone Indices Asian London Open New York AM New York Lunch New York PM Power Hour Macros London 1 London 2 New York Am 1 New York AM 2 New York Lunch New York PM 1 New York PM 2 Silver bullet London Open New York AM New York PM Sessions Asian London New York Chart The display of  Kill zone ,
This multicurrency indicator is the Lite version of the Cosmic Diviner Reversal Zone Pro indicator. The indicator is based on original formulas for analyzing the volatility and price movement strength. This allows determining the overbought and oversold states of instruments with great flexibility, as well as setting custom levels for opening buy or sell orders when the overbought or oversold values of the instruments reach a user-defined percentage. A huge advantage of Reversal Zone Lite is the
PipFinite Energy Beam
Karlo Wilson Vendiola
3.94 (17)
Pipfinite creates unique, high quality and affordable trading tools. Our tools may or may not work for you, so we strongly suggest to try the Demo Version for MT4 first. Please test the indicator prior to purchasing to determine if it works for you. We want your good reviews, so hurry up and test it for free...we hope you will find it useful. Combo Energy Beam with Swing Control Strategy: Confirm swing pullback signals Watch Video: (Click Here) Energy Beam with Trend Laser Strategy: Confirm Tr
The Bollinger Band is a strategy that has become one of the most useful tools for spotlighting extreme short-term price moves. Bollinger Bands consist of a centerline and two price channels or bands above and below it. The centerline is typically a   simple moving average   while the price channels are the standard deviations of the stock being studied. The bands expand and contract as the   price action   of an issue becomes volatile (expansion) or becomes bound into a tight trading pattern (c
Shark Deal Book
Philip Pankaj Suthagar
4 (3)
Term  "shark"  in the business world denotes a high volume investor who just made a good investment in a highly Potential business deal.So, sharks are the ones who make the market move. In our case, if an American shark bought a Japanese company, he/she has to convert American dollars into Japanese yen to make the deal. So, the demand for the Japanese yen will increase sharply. Thus USD/JPY will go short rapidly if the deal was from the shark. Another example, In the case of forex, if fed increa
トレンドトレーディング は、タイミングのプルバックとブレイクアウトにより、市場で起こっているトレンドから可能な限り利益を得るように設計された指標です。確立されたトレンドの中で価格が何をしているかを分析することにより、取引の機会を見つけます。 [ インストールガイド | 更新ガイド | トラブルシューティング | よくある質問 | すべての製品 ] 自信を持って効率的に金融市場を取引する むち打ちにならずに確立されたトレンドから利益を得る 収益性の高いプルバック、ブレイクアウト、早期の逆転を認識する この指標は、独自の品質とパフォーマンスを分析します 複数時間枠のダッシュボードを実装します インジケーターは再描画されていません 電子メール/音声/視覚アラートを実装します 確立されたトレンドは多くの取引機会を提供しますが、ほとんどのトレンド指標はそれらを完全に無視しています。インジケーターの解釈はかなり簡単です: (1) トレンドの変化 (2) トレンドの方向への後退 (3) トレンドの方向へのブレイクアウト 赤いダッシュ は下降トレンド中の修正です 青いダッシュ は上昇ト
This indicator alerts you when/before new candle bar formed. In other words,this indicator alerts you every 1/5/30/60/240 minutes. This indicator is especially useful for traders who trade when new bars formed. *This indicator don't work propery in strategy tester.Use Free Version to check functionality in live trading. Input Parameters Alert_Or_Sound =Sound ----- Choose alert or sound or both to notify you when new bar is coming. Enable_1mBarAlert ----- Enable alert for 1 min bar dif
Unlimited Binary Options Copier Remote is a powerful tool to copy binary options trades remotely between multiple accounts at different locations over internet. This is an ideal solution for signal provider, who want to share his binary options trades with the others globally on his own rules. One provider can copy trades to unlimited receivers and one receiver can get trade from unlimited providers as well. The provider can set the subscription expiry for each receiver, so that receiver will no
About testing Mode: 1.To get the best usage experience please use the tick data to test and adjust the test speed to proper speed (tick price jump quickly but K bars scroll slowly)!!! 2.Click "Indicator Properties"-> Click "Reset" before testing the indicator to restore the default parameters of the indicator. 1. Compound Drawings (1) Line segment with arrow (2) Continuous line segment (broken line) (3) Parallelogram (4) Polygon (5) Profit and loss ratio measurement tools 2.     Backtracking
Hello, This is an easy symbol change panel. This is a full version of Symbol1 2Changer Symbols must be active on your Market Watch list. Parameters: SymbolList - you can add more symbols with a comma(,) ratio - change the size LineNumber - you can set that how many symbols are displayed per line. button_width - modify the button size button_height - modify the button size Thank you.
OPGTS Currency Strength Meter
Opengates Success International
3 (1)
OPGTS Currency Strength Meter is an indicator created to measure and analyze the currency strength and pass the information to the trader through a graphical display of each currency group's strength rates by percentage. Each bar it shows represents the currency's strength or weakness. USAGE: It is useful in two ways for trading: 1. Solo Trading 2. Basket Trading (Currency Group Trading) HOW TO USE IT EFFECTIVELY Solo trading: It can be used for solo trading by analyzing the
PipFinite Razor Scalper
Karlo Wilson Vendiola
4.44 (50)
Pipfinite creates unique, high quality and affordable trading tools. Our tools may or may not work for you, so we strongly suggest to try the Demo Version for MT4 first. Please test the indicator prior to purchasing to determine if it works for you. We want your good reviews, so hurry up and test it for free...we hope you will find it useful. Combo Razor Scalper with Trend Laser Strategy: Scalp in the direction of the trend Watch Video: (Click Here) Features Scalping indicator using a confir
これは、キャンドルの終値を予測する指標です。 このインジケータは、主にD1チャートでの使用を目的としていますが. この指標は、従来の外国為替取引とバイナリオプション取引の両方に適しています。 インジケーターは、スタンドアロンのトレーディングシステムとして使用することも、既存のトレーディングシステムへの追加として機能させることもできます。 このインジケーターは、現在のキャンドルを分析し、キャンドル自体の内部の特定の強度係数と、前のキャンドルのパラメーターを計算します。 したがって、この指標は、市場の動きのさらなる方向性と現在のキャンドルの終値を予測します。 この方法のおかげで、この指標は、短期の日中取引だけでなく、中期および長期の取引にも適しています。 インジケーターを使用すると、市場の状況の分析中にインジケーターが生成する潜在的な信号の数を設定できます。 インジケーターの設定には、このための特別なパラメーターがあります。 また、インジケーターは、チャート上のメッセージの形式で、電子メールで、およびPUSH通知の形式で、新しい信号について通知することができます。 購入後は必ず私に書いて
RiverScope Lite automatically determines the nearest most important price levels and support and resistance zones in history, it also identifies a large number of price action patterns (the lite version is limited to 10, while the full version has 30+). The support and resistance levels are determined based on an algorithm that calculates and filters the historical values of the price, its movement character, volumes, etc. It displays the current situation, therefore the nearest levels change in
このプロダクトを購入した人は以下も購入しています
An exclusive indicator that utilizes an innovative algorithm to swiftly and accurately determine the market trend. The indicator automatically calculates opening, closing, and profit levels, providing detailed trading statistics. With these features, you can choose the most appropriate trading instrument for the current market conditions. Additionally, you can easily integrate your own arrow indicators into Scalper Inside Pro to quickly evaluate their statistics and profitability. Scalper Inside
Reversal First Impulse levels (RFI)    INSTRUCTIONS        RUS       -       ENG              R ecommended to use with an indicator   -   TREND PRO -  Version MT5 A key element in trading is zones or levels from which decisions to buy or sell a trading instrument are made. Despite attempts by major players to conceal their presence in the market, they inevitably leave traces. Our task was to learn how to identify these traces and interpret them correctly. Main functions: Displaying active zones
まず第一に、この取引インジケーターは再描画されず、再描画されず、遅延しないことを強調する価値があります。これにより、手動取引とロボット取引の両方に理想的なものになります。 ユーザーマニュアル:設定、入力、戦略。 アトミックアナリストは、価格の強さとモメンタムを利用して市場でより良いエッジを見つけるためのPA価格アクションインジケーターです。ノイズや誤ったシグナルを除去し、取引ポテンシャルを高めるための高度なフィルターを備えています。複雑なインジケーターの複数のレイヤーを使用して、アトミックアナリストはチャートをスキャンし、複雑な数学的計算をシンプルなシグナルと色に変換します。これにより、どのような初心者トレーダーでも理解して使用し、一貫した取引の決定を行うことができます。 「アトミックアナリスト」は、新規および経験豊富なトレーダー向けにカスタマイズされた包括的な取引ソリューションです。プレミアムインジケーターとトップノッチの機能を1つの取引戦略に組み合わせ、すべてのタイプのトレーダーにとって汎用性のある選択肢にします。 デイリートレーディングとスキャルピング戦略:高
Enigmera
Ivan Stefanov
5 (3)
エニグメラ:市場の中核 https://www.enigmera.com はじめに このインディケータと取引システムは、金融市場に対する驚くべきアプローチです。ENIGMERAは、フラクタルサイクルを使用して、サポートとレジスタンスレベルを正確に計算します。本格的な蓄積局面を示し、方向性と目標を示します。 トレンド中でも調整中でも機能するシステムです。 どのように作動するのか? ENIGMERAは、支持線・抵抗線、目標線、乖離線の3つのラインで構成されています。このシステムは、過去のデータを現在と未来に外挿する典型的な市場指標とは異なり、現在の完全な画像を提供します。支持線上にある場合、それは本当の支持を意味し、抵抗線上にある場合、それは本当の抵抗を意味する。ある水準が破られた場合、それはトレンドの変化を意味する。再描画はしない。 市場は常に進化しているため、ENIGMERAはその評価ツールを適応させ、定期的に戦略を修正しています。  これにより、すべてのシナリオが徹底的に評価されることが保証されます。この市場指標の独自性は、その能力を見れば明らかです。  ENIGM
現在20%OFF! 初心者やエキスパートトレーダーのためのベストソリューション! このダッシュボードソフトウェアは、28の通貨ペアで動作しています。それは私達の主要な指標(高度な通貨の強さ28と高度な通貨インパルス)の2に基づいています。それは全体の外国為替市場の大きい概観を与えます。それは、すべての(9)時間枠で28の外国為替ペアのための高度な通貨の強さの値、通貨の動きの速度と信号を示しています。チャート上で1つのインディケータを使用して市場全体を観察し、トレンドやスキャルピングの機会をピンポイントで見つけることができたら、あなたのトレードがどのように改善されるか想像してみてください。 このインディケータには、強い通貨と弱い通貨の識別、潜在的な取引の識別と確認がより簡単になるような機能が搭載されています。このインディケータは、通貨の強さや弱さが増加しているか減少しているか、また、すべての時間枠でどのように機能しているかをグラフィカルに表示します。 新機能として、現在の市場環境の変化に適応するダイナミックなマーケットフィボナッチレベルが追加され、すでに当社のAdvan
TPSpro TRENDPRO  - is a trend indicator that automatically analyzes the market and provides information about the trend and each of its changes, as well as giving signals for entering trades without redrawing! The indicator uses each candle, analyzing them separately. referring to different impulses - up or down impulse. Exact entry points into transactions for currencies, crypto, metals, stocks, indices!  -  Version MT5               DETAILED DESCRIPTION                R ecommended to use with
ご紹介   クォンタム トレンド スナイパー インジケーターは 、トレンド反転を特定して取引する方法を変革する画期的な MQL5 インジケーターです。 13年以上の取引経験を持つ経験豊富なトレーダーのチームによって開発されました。     クォンタムトレンドスナイパーインジケーター   は、非常に高い精度でトレンドの反転を識別する革新的な方法で、あなたのトレーディングの旅を新たな高みに押し上げるように設計されています。 ***Quantum Trend Sniper Indicatorを購入すると、Quantum Breakout Indicatorを無料で入手できます!*** クォンタム ブレイクアウト インジケーターは、トレンドの反転を特定するとアラートを発し、矢印を示し、3 つのテイクプロフィットレベルを提案します。 初心者トレーダーにもプロのトレーダーにも適しています。 量子EAチャネル:       ここをクリック MT5のバージョン:       ここをクリック 推奨事項: 期間: すべての時間枠。最良の結果を得るには、
FX Volume
Daniel Stein
4.6 (35)
mql5と Telegramの モーニング・ブリーフィングで、詳細とスクリーンショットを含む毎日のマーケット・アップデートをご覧 ください! FX Volumeは、ブローカーの視点から市場のセンチメントをリアルに洞察する、最初で唯一の出来高インジケーターです。 ブローカーのような機関投資家が外国為替市場でどのようなポジションをとっているか、COTレポートよりもはるかに速く、素晴らしい洞察を提供します。 この情報をチャート上で直接見ることは、あなたの取引にとって真のゲームチェンジャーであり、画期的なソリューションです。 以下のようなユニークなマーケットデータ洞察から利益を得てください。 比率は 、通貨のロングポジションとショートポジションの比率をパーセントで表示します。 比率の変化は 、選択した期間内のロング比率とその変化率を表示します。 Volumes Totalは 、通貨の取引量(ロングとショート)の合計をロット単位で表示します。 Volumes Long :全通貨のロングポジションの取引量を表示します。 Volumes(ショート )は、全通貨のショートポジションの取引量を表示
現在20%OFF! 初心者やエキスパートトレーダーに最適なソリューションです。 このインディケータは、エキゾチックペア・コモディティ・インデックス・先物など、あらゆるシンボルの通貨の強さを表示することに特化したインディケータです。金、銀、原油、DAX、US30、MXN、TRY、CNHなどの通貨の強さを表示するために、9行目にどのシンボルでも追加することができます。独自の機能を多数搭載し、新しい計算式を採用したため、ユニークで高品質、かつ手頃な価格のトレーディングツールとなっています。新しいトレンドやスキャルピングチャンスのトリガーポイントを正確に把握することができるため、あなたのトレードがどのように改善されるか想像してみてください。 ユーザーマニュアル:ここをクリック   https://www.mql5.com/en/blogs/post/708876 すべての時間枠に対応します。あなたはすぐにトレンドを見ることができるようになります! 新しいアルゴリズムに基づいて設計されているため、潜在的な取引の特定と確認がより簡単になります。これは、8つの主要通貨と1つのシンボ
ご紹介     Quantum Breakout PRO は 、ブレイクアウト ゾーンの取引方法を変革する画期的な MQL5 インジケーターです。 13年以上の取引経験を持つ経験豊富なトレーダーのチームによって開発された Quantum Breakout PROは 、革新的でダイナミックなブレイクアウトゾーン戦略により、あなたの取引の旅を新たな高みに押し上げるように設計されています。 クォンタム ブレイクアウト インジケーターは、5 つの利益ターゲット ゾーンを備えたブレイクアウト ゾーン上のシグナル矢印と、ブレイクアウト ボックスに基づいたストップロスの提案を提供します。 初心者トレーダーにもプロのトレーダーにも適しています。 量子EAチャネル:       ここをクリック MT5バージョン:   ここをクリック 重要!購入後、インストールマニュアルを受け取るためにプライベートメッセージを送ってください。 推奨事項: 時間枠: M15 通貨ペア: GBPJPY、EURJPY、USDJPY、NZDUSD、XAUUSD アカウントの種類: ECN、Raw、また
Indicator : RealValueIndicator Description : RealValueIndicator is a powerful tool designed specifically for trading on the EURUSD pair. This indicator analyzes all EUR and USD pairs, calculates their real currency strength values, and displays them as a single realistic value to give you a head start on price. This indicator will tell you moves before they happen if you use it right. RealValueIndicator allows you to get a quick and accurate overview of the EURUSD currency pair tops and bottoms,
Trend Screener
STE S.S.COMPANY
4.83 (88)
トレンドインジケーター、1つのツールに組み込まれたすべての重要なトレンド機能を備えたトレンドトレーディングとフィルタリングのための画期的なユニークなソリューション! これは、すべてのシンボル/商品(外国為替、商品、暗号通貨、インデックス、株式)で使用できる100%再描画されていないマルチタイムフレームおよびマルチ通貨インジケーターです。 トレンドスクリーナーは、チャート内のドットで矢印トレンドシグナルを提供するインジケーターに続く効率的なインジケーターです。 トレンド分析インジケーターで使用できる機能: 1.トレンドスキャナー。 2.最大利益分析を備えたトレンドライン。 3.トレンド通貨強度メーター。 4.アラート付きのトレンド反転ドット。 5.アラート付きの強いトレンドドット。 6.トレンド矢印 毎日の分析例、毎日のシグナルパフォーマンス...など、トレンドスクリーナーインジケーターを使用して、ここで見つけることができます: ここをクリックしてください 期間限定オファー:トレンドスクリーナーインジケーターは、50ドルと生涯でのみご利用いただけます。 (元の価格125 $) MQ
Gold Channel is a volatility-based indicator, developed with a specific timing algorithm for the XAUUSD pair, which consists of finding possible corrections in the market. This indicator shows two outer lines, an inner line (retracement line) and an arrow sign, where the theory of the channel is to help identify overbought and oversold conditions in the market. The market price will generally fall between the boundaries of the channel. If prices touch or move outside the channel it is a tra
ECM Elite Channel is a volatility-based indicator, developed with a specific time algorithm, which consists of finding possible corrections in the market. This indicator shows two outer lines, an inner line (retracement line) and an arrow sign, where the channel theory is to help identify overbought and oversold conditions in the market. The market price will generally fall between the boundaries of the channel. If prices touch or move outside the channel, it's a trading opportunity. The
Gann Signal is a very simple indicator at first glance, but hidden inside is many years of experience in studying W.D.Ganna methods. The indicator gives accurate BUY/SELL signals, without redrawing. The indicator is very easy to use. All you need to do is attach it to your chart and follow its recommendations. The indicator constantly analyzes the market for entry opportunities. When such an opportunity appears, the indicator gives a signal in the form of an arrow. I repeat, all signals are NOT
Please send me Direct message on MQL5 CHAT after purchasing the Indicator for Training and Installation Support There are some additional files that is important to use with the Indicator . So be sure to contact me after purchasing the Indicator So that I can add you for training and support . If you find any difficulty with installation then send me Direct message here So that I can connect with you via Anydesk or Teamview for the product installation. " Smart Order Block Indicator " to find
Introduction to X3 Chart Pattern Scanner X3 Cherart Pattern Scanner is the non-repainting and non-lagging indicator detecting X3 chart patterns including Harmonic pattern, Elliott Wave pattern, X3 patterns, and Japanese Candlestick patterns. Historical patterns match with signal patterns. Hence, you can readily develop the solid trading strategy in your chart. More importantly, this superb pattern scanner can detect the optimal pattern of its kind. In addition, you can switch on and off individu
TrendMaestro
Stefano Frisetti
5 (3)
note: this indicator is for METATRADER4, if you want the version for METATRADER5 this is the link:  https://www.mql5.com/it/market/product/108106 TRENDMAESTRO ver 2.4 TRENDMAESTRO recognizes a new TREND in the bud, he never makes mistakes. The certainty of identifying a new TREND is priceless. DESCRIPTION TRENDMAESTRO identifies a new TREND in the bud, this indicator examines the volatility, volumes and momentum to identify the moment in which there is an explosion of one or more of these data a
このインディケータは、当社の2つの製品 Advanced Currency IMPULSE with ALERT  +   Currency Strength Exotics . のスーパーコンビネーションです。 このインジケーターは全ての時間枠で作動し、8つの主要通貨と1つのシンボルの強弱のインパルスをグラフで表示します。 このインジケータは、金、エキゾチックペア、商品、インデックス、先物など、あらゆるシンボルの通貨強度の加速度を表示することに特化されています。金、銀、原油、DAX、US30、MXN、TRY、CNHなどの通貨強度の加速度(インパルスまたは速度)を表示するために、任意のシンボルを9行目に追加できる、この種の最初のものです。 新しいアルゴリズムに基づいて構築され、潜在的な取引の特定と確認がさらに容易になりました。これは、通貨の強さや弱さが加速しているかどうかをグラフィカルに表示し、その加速の速度を測定するためです。加速すると物事は明らかに速く進みますが、これはFX市場でも同じです。つまり、反対方向に加速している通貨をペアリングすれば、潜在的に利益を生む取
これはMT4のインジケーターで、再描画なしで取引に参入するための正確なシグナルを提供します。 外国為替、暗号通貨、金属、株式、インデックスなど、あらゆる金融資産に適用できます。かなり正確な見積もりを提供し、取引を開始して終了するのに最適な時期を教えてくれます。1つのシグナルを処理しただけでインジケーターの元が取れた例の 動画 (6:22)をご覧ください。Entry PointsPro インジケーターの助けを借りたほとんどのトレーダーの最初の1週間の結果が改善しています。 Telegramグループ に登録してください。Entry Points Proインジケーターのメリットは次の通りです。 再描画のないエントリーシグナル 再描画されるインジケーターでは一度表示されたシグナルが削除されて大きな金銭的損失につながることがありますが、これと異なり、表示されて確認されたシグナルは消えることがありません。 エラーなしの取引開始 インジケーターアルゴリズムによって取引を開始する(資産を売買する)理想的な瞬間を見つけることができます。それを使用するすべてのトレーダーの成功率が向上します。
もちろんです。以下は、提供いただいたテキストの日本語への翻訳です: MT4用の天文学指標をご紹介します:究極の天体トレーディングコンパニオン トレーディング体験を天空の高みに高める準備はできていますか?私たちの革命的なMT4用の天文学指標をご紹介します。この革新的なツールは、複雑なアルゴリズムの力を借りて、類まれなる天文学的洞察と精密な計算を提供します。 あなたの指先で宇宙の情報を: 宝のような天文学的データが明らかになる包括的なパネルをご覧ください。惑星の地理的/太陽中心座標、太陽と地球の距離、星の大きさ、伸び、星座、黄道座標および赤道座標、さらには水平座標まで、それぞれが綿密に計算され美しく表示されています。指標によって生成される垂直線は時間値に対応し、トレーディングの旅に宇宙の視点を提供します。 惑星のラインと関係: グラフを飾る惑星のラインの魔法を体験し、スケールと角度をカスタマイズできます。直感的なコントロールパネルを介して各惑星のラインの表示を簡単に切り替えることができます。指定された時刻範囲内での合会、六分会、四分会、三分会、対会、逆行の指標で天体の関係の芸術を発見してく
収益性の高い取引機会を簡単に特定するのに役立つ強力な外国為替取引インジケーターをお探しですか?ビースト スーパー シグナル以外に探す必要はありません。 この使いやすいトレンドベースのインジケーターは、市場の状況を継続的に監視し、新しいトレンドを検索したり、既存のトレンドに飛びついたりします。ビースト スーパー シグナルは、すべての内部戦略が一致し、互いに 100% 合流したときに売買シグナルを発するため、追加の確認は不要です。シグナル矢印アラートを受け取ったら、単に売買します。 購入後、プライベート VIP グループに追加されるようにメッセージを送ってください! (完全な製品購入のみ)。 購入後、最新の最適化されたセット ファイルについてメッセージを送ってください。 MT5バージョンは こちらから入手できます。 Beast Super Signal EA は こちらから 入手できます。 コメント セクションをチェックして、最新の結果を確認してください。 ビースト スーパー シグナルは、1:1、1:2、または 1:3 のリスクと報酬の比率に基づいて、エントリ
Tradeable Changer Indie
Opengates Success International
Tradeable Changer Indie Trade-able Changer Indie is an indicator that serves several purposes. The idea behind this operating indicator is to have a minimal set of indicator or experts on the chart in order to avoid clumsy chart window and at the same time have a great time trading profitably. This is a combination of Symbol/Time-frame Changer and a Trading system based on Trends following. It has a small board to display trade signals for the trader. Due to the nature of these com
Volatility Trend System - a trading system that gives signals for entries. The volatility system gives linear and point signals in the direction of the trend, as well as signals to exit it, without redrawing and delays. The trend indicator monitors the direction of the medium-term trend, shows the direction and its change. The signal indicator is based on changes in volatility and shows market entries. The indicator is equipped with several types of alerts. Can be applied to various trading
NAM Order Blocks
NAM TECH GROUP, CORP.
5 (1)
MT4マルチタイムフレームオーダーブロック検出インジケーター。 特徴 -チャートコントロールパネルで完全にカスタマイズ可能で、完全な相互作用を提供します。 -必要な場所でコントロールパネルを表示および非表示にします。 -複数の時間枠でOBを検出します。 -表示するOBの数量を選択します。 -さまざまなOBユーザーインターフェイス。 -OBのさまざまなフィルター。 -OB近接アラート。 -ADRの高線と低線。 -通知サービス(画面アラート|プッシュ通知)。 概要 注文ブロックは、金融機関や銀行からの注文収集を示す市場行動です。著名な金融機関と中央銀行が外国為替市場を牽引しています。したがって、トレーダーは市場で何をしているのかを知る必要があります。市場が注文ブロックを構築するとき、それは投資決定のほとんどが行われる範囲のように動きます。 注文の構築が完了すると、市場は上向きと下向きの両方に向かって急激に動きます。注文ブロック取引戦略の重要な用語は、機関投資家が行っていることを含むことです。それらは主要な価格ドライバーであるため、機関投
The Volume by Price Indicator for MetaTrader 4 features Volume Profile and Market Profile TPO (Time Price Opportunity). Volume and TPO histogram bar and line charts. Volume Footprint charts. TPO letter and block marker collapsed and split structure charts. Session filtering and grouping. Static, dynamic and flexible range segmentation and compositing methods with relative and absolute visualizations. Graphical layering, positioning and styling options to suit the user's analytic and aesthetic n
Cycle Sniper
Elmira Memish
4.39 (36)
NEW YEAR SALE PRICE FOR LIMITED TIME!!! Please contact us after your purchase and we will send you the complimentary indicators to complete the system Cycle Sniper is not a holy grail but when you use it in a system which is explained in the videos, you will feel the difference. If you are not willing to focus on the charts designed with Cycle Sniper and other free tools we provide, we recommend not buying this indicator. We recommend watching the videos about the indiactor and system before pu
How to use Pair Trading Station Pair Trading Station is recommended for H1 time frame and you can use it for any currency pairs. To generate buy and sell signal, follow few steps below to apply Pair Trading Station to your MetaTrader terminal. When you load Pair Trading Station on your chart, Pair Trading station will assess available historical data in your MetaTrader platforms for each currency pair. On your chart, the amount of historical data available will be displayed for each currency pai
The indicator " ZigZag on Trend " is an assistant in determining the direction of price movement, as well as a calculator of bars and points. It consists of a trend indicator, which follows the price direction by the trend line presented in the form of a zigzag and a counter calculating the number of bars traversed in the direction of the trend and the number of points on the vertical scale. (calculations are carried out by the opening of the bar) The indicator does not redraw. For convenience,
Step into the realm of Forex trading with confidence and precision using XQ, a cutting-edge Forex indicator designed to elevate your trading game to unprecedented heights. Whether you're a seasoned trader or just stepping into the world of currency exchange,   XQ Forex Indicator   empowers you with the insights and signals needed to make informed trading decisions. The signal conditions are a combination of three indicators, and XQ Forex Indicator only display  medium and long-term trends . The
作者のその他のプロダクト
Multi-Time-Frame-Multi Currency Signals Dashboard Indicator It is an Advanced multi-utility dashboard which works with full customization of signal settings and graphical interface. It works with Multi Symbols and Multi-Time frames from 1 SINGLE CHART TEMPLATE. It will automatically open the charts where the latest signals had formed- showing the important levels (Entry, Targets, Stop Loss) Many types of sorting methods for the scanner. A robust ENTRY based on  TREND OF MULTI-TIME FRAMES ( Co
Top and Bottom Scalper  BINARY AND FOREX   The signals indicate strong reversal points (Tops/bottoms)- The indicator gives accurate signals on any currency pairs and instruments. It also has a setting for adjusting the frequency of the signals. It is further strengthened and made robust by the support and resistance zones. There are different qualities of zones as per robustness. Inputs ZONE SETTINGS;  BackLimit - default is 10 000. Check the past bars for formations.  First Time Fram
Trend Line Chart Pattern Signals  Is a traders Tool for Signals based on Strong  Patterns Formed By a pair of robust trend lines. They FOR WITH DIFFERENT POPULAR PATTERNS ON CHARTS LIKE – TRIANGLES, FLAGS,RANGE , ASCENDING TRIANGLES, DESCENDING PATTERNS, PENNANTS ETC. The TREND LINES  form  dynamically  on running bars. The  sensitivity  of the trend lines can be changed by custom settings. The  Buy and Sell Signals Generate upon Break Of the Trend Line + "Close" of the same bar above the previo
SCALP ARROW EXIT SIGNALS PLEASE REFER THE COMMENTS AREA - HOW THE SIGNALS CAN BE MADE BETTER QUALITY USING RENKO CHARTS  IF YOU REQUIRE THE RENKO CHARTS DO LET ME KNOW , WILL HELP Indicator is a professional tool for guiding reliable entries, exits, reentries, and RETRACEMENT entries and pull back entries. It is a complete blackbox system and can be used to get signals for any instrument and any time frame. The indicator generates signals, alerts - ENTRY -EXIT . Its can be used to scalp -
Multi Trend Buy Sell Signal WITH TREND DASHBOARD The indicator Generates Entry Signals WITH ALERTS based on the combination of Multi Time Frame conditions of 1 set of moving average and 2 sets of MACD . The importance of the 2 sets of MACD is for using it as a confirmation filter so that the trades generated are those with stronger movement.  For example, if in a sideways market the MACD of M5 charts is showing a downtrend but the higher time frame of the M 15 charts is indicating an uptren
Scalp SWING indicator. It works on any time frame and Instruments It works on trending and ranging markets. The signals are robust and does not repaint. The system is robust and requires no supporting indicator. You don’t need any multiple indicators to trade the markets. The alerts/ notifications can be enabled to gain prompt entries. The entries are at Top and Bottom of Trend Cycles It is Very accurate and robust system- yet extremely simplified tools for the pro traders. Sc
REVERSAL AREA INDICATOR  This Indicator will generate signals on top and bottom of the swings . It will check for some support and resistance found and generate the signals at such areas. There is high probability of the price moving in favorable directions as they are signals when there is support and resistance . The advantage is that the entries will have small stop loss and high risk to reward ratios as they are near tops and bottoms. 1.       This is an indicator that will provid
Dual Trend Scalper  Advantages You Get  Easy, visual and effective trend detection. you can find the IMPULSE COLOR PANEL FOR QUICK TREND DETECTION  Gives you the ability to filter and further improve your trading strategies. YOU HAVE TREND DETECTION IMPULSE FILTER , AS WELL AS 2 LEVELS OF SUPERTREND.  Enhanced statistics calculation following the entry point, take profit and exit signal. ENTRY CAN BE AS PER VARIATION OF SETTINGS AND PARAMETERS, SL AND TARGETS ALSO CAN BE ADJUSTED  Neve
REVERSAL SIGNALS SCALPER SCANNER  Indicator is a multi purpose tool and very useful to know the EXTREME TURNING POINTS of any pair / stock/ commodity. The extreme levels can be input and it will show you when those levels have reached . So that you can plan your EXTREME REVERSAL TRADES . It is a MULTI TIME FRAME TREND ANALYSIS TOOL AND IT WILL suggest probable changes in the trend and swing . It is very useful for day trading , scalping, and swing trading . SPECIAL FEATURE - CLICK ON THE RE
THE SCALPER SIGNALS BUY AND SELL ENTRIES / REENTRIES , BASED ON THE PRICE ACTION OF BARS  IT HAS MULTIPLE MODES AS SELECTED , Which will provide  different price action signals . The Signals are further filtered using Higher Time Frame Trend Analysis. For Example - (1) The Signals Of reversal points entries of the Higher Time frame can are plotted over any lower time frame , Giving robust signals        (2) The Signal Of Lower time Frame - plotted only when the higher time frame is also in th
Scalper Signals Trader Best and simple Indicator for clear and safe entry and exits. Predefines- multiple targets and stop loss, as per risk reward ratios Signals can be set – based on aggressive or safe algorithm Aggressive entries are also profitable but are raw signals without checking the higher time frame trends Safe entry meanwhile will check if the lower and the higher time frame are both in same direction, thereby having lesser trade entries and more quality. The very robust macd le
Smart Multi Systems 21 STRATEGIES  IN 1 INPUT  FileComment = "";- trade log file  EntryOnly = false;-  "TRUE"- SIGNAL TO SIGNAL MODE Can Exit by Opposite Signal = false;  IndicatorAlerts = false;-  EntryAlerts = true; ExitAlerts = true; Reentry=false( ENABLE reentries) ENTRY SETTING PARAMETERS EntryStyle = EP-SIG+Rev Alert ( 21strategies ) ExitStyle = Rev Alert  ( 8  EXITS strategies )  ENTRY and EXIT SETTINGS =====  KPeriod = 100;   DPeriod = 12;  Slowing = 3;  method = 0;  price = 0;
HNI-SCALP-SWING indicator Indicator can be used for trading with agGressive or safe signals It has a HIGHER TIME FRAME FILTER that can be adjusted to suit the quality of signals  The Entry signals are confirmed with a higher time frame filter . It can be used on any time frames from the smallest to the Highest It can generate signals on the opening and running bar or ON THE CLOSE OF THE BAR - as per the signal setting  PARAMETERS TimeFrames  =  PERIOD_CURRENT; //TimeFrames TimeFrame = Tim
COMPLETE VISUAL TRADING SYSTEM WITH THE BUY SELL SIGNALS - USING  MULTI TIME FRAME TREND ANALYSIS TREND STRENGTH POWER SIGNALS DASHBOARD. TRADE INTRADAY, SHORT OR MEDIUM OR LONG TIME FRAME . ALL THE SIGNALS WITH A MULTIPLE TIME FRAME TREND CONFLUENCE - INDICATES A STRONG MOVE AND CAN BE EASILY TRADED AS HIGH PROBABILITY TRADES. COMPLE TRADING SYSTEM - WITH THE LOGICAL ENTRY , TARGETS AND STOP LOSS . THE ALERTS ON THE DISPLAY SIDE OF THE ALERTS PANEL AREA , WILL INDICATE CLEARLY ALL T
フィルタ:
レビューなし
レビューに返信