• 概要
  • レビュー
  • コメント

Two way Fibonacci indicator

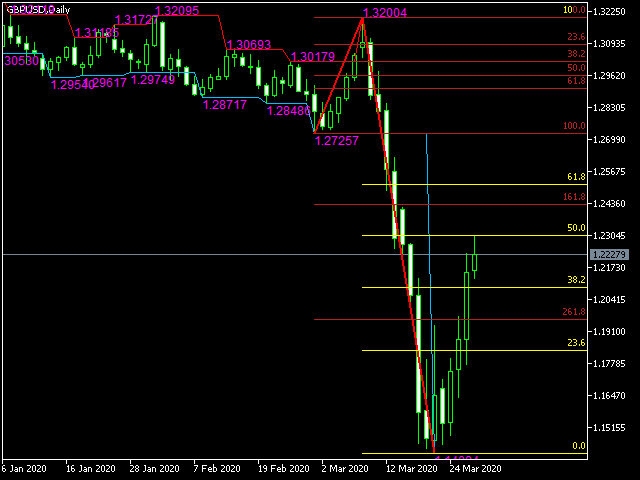
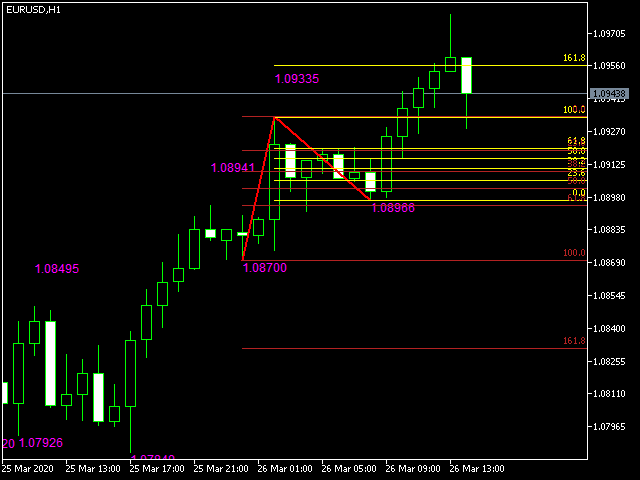
Two-way Fibonacci indicator. The function is to facilitate traders to find their retracement and entry and exit points. The principle of the workpiece of this indicator: First, draw a V shape for the high and low points formed by the fractal indicator, and then draw a golden section proportional line for the V line, which can be applied to any period and currency pair.


おすすめのプロダクト
Mine Farm
Maryna Kauzova
5 (1)
Mine Farm is one of the most classic and time-tested scalping strategies based on the breakdown of strong price levels. Mine Farm is the author's modification of the system for determining entry and exit points into the market... Mine Farm - is the combination of great potential with reliability and safety. Why Mine Farm?! - each order has a short dynamic Stop Loss - the advisor does not use any risky methods (averaging, martingale, grid, locking, etc.) - the advisor tries to get
A new generation progressive indicator from INFINITY. Predictor PRO uses its own entry and exit calculation strategy. Indicator without redrawing signals! This is very important for real trading. The indicator can be used for any currency pairs, metals, cryptocurrencies or indices. The best time of the H1 chart. Unlike other indicators, Predictor PRO shows shows the Buy/Sell entry point and the Close exit point. Calculating the profit of all signals in points on the panel helps to choose th
プレミアムレベルは、正しい予測の精度が80%を超える独自の指標です。 この指標は、最高のトレーディングスペシャリストによって2か月以上テストされています。 あなたが他のどこにも見つけられない作者の指標! スクリーンショットから、このツールの正確さを自分で確認できます。 1は、1キャンドルの有効期限を持つバイナリーオプションの取引に最適です。 2はすべての通貨ペア、株式、商品、暗号通貨で機能します 手順: 赤い矢印が表示されたらすぐにダウントレードを開き、青い矢印が表示されたら閉じます。青い矢印の後に開くこともできます。 試してテストしてください!推奨設定はデフォルトです! 日足チャートで最高の精度を示します! インディケータは、2600 Pipsの収益性に対して、約10Pipsという非常に小さなマージンを使用します。
ICT Kill zone and Macros Indicator mark and display the following zone times on the chart: Kill zones   Kill zone Forex Asian London Open New York Open London Close Central Bank Dealing range Kill zone Indices Asian London Open New York AM New York Lunch New York PM Power Hour Macros London 1 London 2 New York Am 1 New York AM 2 New York Lunch New York PM 1 New York PM 2 Silver bullet London Open New York AM New York PM Sessions Asian London New York Chart The display of  Kill zone ,
Noize Absorption Index - is the manual trading system that measures the difference of pressure between bears forces and bulls forces. Green line - is a noize free index that showing curent situation. Zero value of index shows totally choppy/flat market.Values above zero level shows how powerfull bullish wave is and values below zero measures bearish forces.Up arrow appears on bearish market when it's ready to reverse, dn arrow appears on weak bullish market, as a result of reverse expectation.
Description : Rainbow EA MT5 is a simple Expert advisor based on   Rainbow MT5 indicator witch is based on Moving average with period 34. The indicator is incorporated in the EA, therefore, it is not required for the EA to operate, but if you wish, you can download it from   my product page . The Expert Advisor settings are as follows : Suitable for Timeframes up to H1 The parameters below can be set according to your trading rules. StopLoss ( Stop Loss in pips) TakeProfit ( Take Profit in pi
Reversal First Impulse levels (RFI)      INSTRUCTIONS        RUS       -       ENG              R ecommended to use with an indicator   -   TPSpro  TREND PRO -  Version MT4                 A key element in trading is zones or levels from which decisions to buy or sell a trading instrument are made. Despite attempts by major players to conceal their presence in the market, they inevitably leave traces. Our task was to learn how to identify these traces and interpret them correctly. Main functi
これはほぼ間違いなく、MetaTraderプラットフォームで見つけることができる最も完全な調和価格形成自動認識インジケーターです。 19種類のパターンを検出し、フィボナッチプロジェクションをあなたと同じように真剣に受け止め、潜在的逆転ゾーン(PRZ)を表示し、適切なストップロスとテイクプロフィットレベルを見つけます。 [ インストールガイド | 更新ガイド | トラブルシューティング | よくある質問 | すべての製品 ] 19の異なる調和価格形成を検出します プライマリ、派生および補完フィボナッチ投影(PRZ)をプロットします 過去の価格行動を評価し、過去のすべてのパターンを表示します この指標は、独自の品質とパフォーマンスを分析します 適切なストップロスとテイクプロフィットのレベルを表示します ブレイクアウトを使用して適切な取引を通知します すべてのパターン比をグラフにプロットします 電子メール/音声/視覚アラートを実装します スコット・M・カーニーの本に着想を得て、この指標は最も純粋で急を要するトレーダーのニーズを満たすように設計されています。ただし、トレードを
The Riko Trend indicator is a revolutionary trend trading and filtering solution with all the important features of a trend tool built into one tool! The Riko Trend indicator is good for any trader, suitable for any trader for both forex and binary options. You don’t need to configure anything, everything is perfected by time and experience, it works great during a flat and in a trend. The Riko Trend indicator is a technical analysis tool for financial markets that reflects the current price
VR Cub は、質の高いエントリーポイントを獲得するためのインジケーターです。このインジケーターは、数学的計算を容易にし、ポジションへのエントリーポイントの検索を簡素化するために開発されました。このインジケーターが作成されたトレーディング戦略は、長年にわたってその有効性が証明されてきました。取引戦略のシンプルさはその大きな利点であり、初心者のトレーダーでもうまく取引することができます。 VR Cub はポジション開始ポイントとテイクプロフィットとストップロスのターゲットレベルを計算し、効率と使いやすさを大幅に向上させます。取引の簡単なルールを理解するには、以下の戦略を使用した取引のスクリーンショットを見てください。 設定、設定ファイル、デモ版、説明書、問題解決方法は、以下から入手できます。 [ブログ] レビューを読んだり書いたりすることができます。 [リンク] のバージョン [MetaTrader 4] エントリーポイントの計算ルール ポジションをオープンする エントリーポイントを計算するには、VR Cub ツールを最後の高値から最後の安値までストレッチする必要があります。
数列の一つに「森林火災数列」があります。これは、最も美しい新しいシーケンスの 1 つとして認識されています。その主な特徴は、このシーケンスが線形トレンドを回避することです。最短のものであってもです。この指標の基礎を形成したのはこのプロパティです。 財務時系列を分析する場合、この指標は可能なすべての傾向オプションを拒否しようとします。そして失敗した場合にのみ、トレンドの存在を認識し、適切なシグナルを発します。このアプローチにより、新しいトレンドの始まりの瞬間を正しく判断できます。ただし、偽陽性の可能性もあります。それらの数を減らすために、このインジケーターに追加のフィルターが追加されました。新しいバーが開くとシグナルが生成されます。いずれの場合も再描画は発生しません。 指標パラメータ: Applied Price   - 適用価格定数; Period Main   - インディケータのメイン期間、その有効な値は 5 ~ 60 です。 Period Additional   - 追加の期間。このパラメーターの有効な値は 5 ~ 40 です。 Signal Filter   - 追加の信号
The Antique Trend Indicator is a revolutionary trend trading and filtering solution with all the important features of a trend tool built into one tool! The Antique Trend indicator is good for any trader, suitable for any trader both for Forex and binary options. There is no need to configure anything, everything has been perfected by time and experience, it works great during flats and trends. The Antique Trend indicator is a tool for technical analysis of financial markets, reflecting curre
Introduction The "Two Moving Average Crossover" indicator for MetaTrader 5 (MT5) is a technical analysis tool that displays two moving averages and notifies when the moving averages cross each other. The indicator calculates and plots two moving averages, one of which is faster and the other is slower. When the faster moving average crosses above the slower moving average, it is considered a bullish signal, indicating a potential trend reversal or the start of a new uptrend. Conversely, when th
PipFinite Trend PRO MT5
Karlo Wilson Vendiola
4.87 (666)
Breakthrough Solution For Trend Trading And Filtering With All Important Features Built Inside One Tool! Trend PRO's smart algorithm detects the trend, filters out market noise and gives entry signals with exit levels. The new features with enhanced rules for statistical calculation improved the overall performance of this indicator. Important Information Revealed Maximize the potential of Trend Pro, please visit www.mql5.com/en/blogs/post/713938 The Powerful Expert Advisor Version Automa
The Penta-O is a 6-point retracement harmonacci pattern which usually precedes big market movements. Penta-O patterns can expand and repaint quite a bit. To make things easier this indicator implements a twist: it waits for a donchian breakout in the right direction before signaling the trade. The end result is an otherwise repainting indicator with a very reliable trading signal. The donchian breakout period is entered as an input. [ Installation Guide | Update Guide | Troubleshooting | FAQ | A
SolarTrade Suite 金融指標: Venus 市場指標 - 金融市場の世界で信頼できるガイド! これは、特別な革新的で高度なアルゴリズムを使用して値を計算するオシレーターであり、見た目にも美しいデザインです。 この指標の読み取り値を理解するのは非常に簡単です。青色 - 買い、赤色 - 売り。 色が明るいほど、信号が強くなります。 説明の下部にある SolarTrade Suite シリーズの他の製品をご覧ください。 投資と金融市場の世界を自信を持ってナビゲートしたいですか? SolarTrade Suite 金融指標: Venus 市場指標は、情報に基づいた投資決定を行い、利益を増やすのに役立つように設計された革新的なソフトウェアです。 SolarTrade Suite 金融指標: Venus 市場指標の利点: - 正確な予測: 当社の指標は、高度なアルゴリズムと分析方法を使用して、市場の動きを正確に予測します。 資産を購入および売却するのに最適なタイミングに関するシグナルを取得します。 - ユーザーフレンドリーなインターフェース: 直感的
Free automatic Fibonacci is an indicator that automatically plots a Fibonacci retracement based on the number of bars you select on the BarsToScan setting in the indicator. The Fibonacci is automatically updated in real time as new highest and lowest values appears amongst the selected bars. You can select which level values to be displayed in the indicator settings. You can also select the color of the levels thus enabling the trader to be able to attach the indicator several times with differe
FREE
まず第一に、この取引インジケーターは再描画されず、再描画されず、遅延しないことを強調する価値があります。これにより、手動取引とロボット取引の両方に理想的なものになります。 ユーザーマニュアル:設定、入力、戦略。 アトミックアナリストは、価格の強さとモメンタムを利用して市場でより良いエッジを見つけるためのPA価格アクションインジケーターです。ノイズや誤ったシグナルを除去し、取引ポテンシャルを高めるための高度なフィルターを備えています。複雑なインジケーターの複数のレイヤーを使用して、アトミックアナリストはチャートをスキャンし、複雑な数学的計算をシンプルなシグナルと色に変換します。これにより、どのような初心者トレーダーでも理解して使用し、一貫した取引の決定を行うことができます。 「アトミックアナリスト」は、新規および経験豊富なトレーダー向けにカスタマイズされた包括的な取引ソリューションです。プレミアムインジケーターとトップノッチの機能を1つの取引戦略に組み合わせ、すべてのタイプのトレーダーにとって汎用性のある選択肢にします。 デイリートレーディングとスキャルピング戦略:高速で正確な
トレンドキャッチャー: アラートインジケーター付きのトレンドキャッチャーストラテジーは、市場トレンドやポテンシャルなエントリーポイントやエグジットポイントを特定するのに役立つ多目的な技術分析ツールです。動的なトレンドキャッチャーストラテジーを備えており、市場状況に適応してトレンドの方向を明確に視覚化します。トレーダーは、自身の好みやリスク許容度に合わせてパラメーターをカスタマイズできます。このインジケーターはトレンドの識別を支援し、ポテンシャルなリバーサルをシグナルし、トレイリングストップのメカニズムとして機能し、市場への迅速な対応のためのリアルタイムアラートを提供します。 特徴: - トレンドの識別:上昇トレンドと下降トレンドをシグナルします。 - トレンドのリバーサル:ローソク足の色が上昇から下降に変わった場合やその逆の場合に、ポテンシャルなリバーサルを警告します。 - リアルタイムアラート:新しいトレンドの識別に対するアラートを生成します。 推奨事項: - 通貨ペア:EURUSD、AUDUSD、XAUUSDなど... - タイムフレーム:H1。 - アカウン
FREE
どんなツール(シンボル)でも、グラフのどんな期間でも、買いと売りのフィボナッチレベルの自動的な作成とフォローアップ。 FiboPlus は、次のものを表示している: アップかダウン方向、 ありそうな 値動きのフィボナッチレベル。 エントリーポイントは「アップ矢印」、「ダウン矢印」アイコンで示され、情報はボタンにて再度表示されている。(SELL, BUY) 0から100までのレベルで限られた直角的エリア。トレードは、一つのレベルから他のレベルへ(トレンドなし)。 特長 値動きの予測、市場エントリーポイント、オーダーのための stop loss とtake profit。 作成済みのトレードシステム。 管理ボタンは、フィボナッチオプションの度リラかを選択できるようにする。 買いか売りのオプションを非表示にする。 グラフの他の期間を参照する。 「+」と「―」ボタンは、レベルの自動的再計算しながらグラフを大きく・小さくする。 何のフィボナッチレベルでも。 何の色でも表示。 ボタンをグラフの便利な場所に移動。 パラメーター Language (Russian, English, Deu
ESS の戦略的シグナル このインジケーターは、フィルターが適用されたエンベロープ タイプのキャンドルを検出します。このフィルターは 3 つの戦略で構成されており、測定可能なパラメーター内で可能な最大の効果を識別することができます。 信号は方向ごとに上向き矢印と下向き矢印で示され、アラート、電子メール、モバイルへのプッシュ メッセージを有効または無効にすることもできます。 100% 効果的な指標はありません。そのため、テクニカル分析や他の指標の助けを借りて、独自の戦略の有効性を改善する必要があります。 ESS の戦略的シグナル このインジケーターは、フィルターが適用されたエンベロープ タイプのキャンドルを検出します。このフィルターは 3 つの戦略で構成されており、測定可能なパラメーター内で可能な最大の効果を識別することができます。 信号は方向ごとに上向き矢印と下向き矢印で示され、アラート、電子メール、モバイルへのプッシュ メッセージを有効または無効にすることもできます。 100% 効果的な指標はありません。そのため、テクニカル分析や他の指標の助けを借りて、独自
Binary Options Assistant (BOA) Multi Currency Dashboard for Binary Options (MT5) . You can use any of the BOA Signals Indicators with the dashboard. Just change the BOA Signals Indicator Name in the dashboard settings to the indicator you want to get signals from. For example: CHILL. BLAZE:  BOA_BLAZE_Indicator_v1   Strategy :   BLW Online Trading Binary Options Strategy (3 Moving Average) LAVA:  BOA_LAVA_Indicator_v1   Strategy:   Lady Trader Binary Options Strategy (Bollinger Bands & Stoc
The bullet indicator gives accurate direction of the market structure, it will indicate to you the exact direction whether it be the market is in a downtrend or if it's in an uptrend it will give you that information which will inturn benefits you by saving you the time it takes to analyse that structure, this indicator works on a timeframes and it's most favourable on higher timeframes. How it works: -The green arrow will be at the support of the structure indicating buys -The red arrow will
Volality Index scalper indicator  Meant for Volality pairs such as Volality 10, 25, 50, 75 and 100 The indicator works on all timeframes from the 1 minute to the monthly timeframe the indicator is non repaint the indicator has 3 entry settings 1 color change on zero cross 2 color change on slope change 3 color change on signal line cross Orange line is your sell signal Blue line is your buy signal.
MT4版  |  FAQ Owl Smart Levels Indicator は、 Bill Williams の高度なフラクタル、市場の正しい波構造を構築する Valable ZigZag、エントリの正確なレベルをマークする Fibonacci レベルなどの一般的な市場分析ツールを含む 1 つのインジケーター内の完全な取引システムです。 利益を得るために市場と場所に。 戦略の詳細な説明 インジケータを操作するための指示 顧問-取引助手 プライベートユーザーチャット ->購入後に私に書いて、私はプライベートチャットにあなたを追加し、あなたはそこにすべてのボーナスをダウンロードすることができます 力はシンプルさにあります! Owl Smart Levels 取引システムは非常に使いやすいので、専門家にも、市場を勉強し始めて自分で取引戦略を選択し始めたばかりの人にも適しています。 戦略と指標に秘密の数式や計算方法が隠されているわけではなく、すべての戦略指標は公開されています。 Owl Smart Levels を使用すると、取引を開始するためのシグナルをすばやく確認し、注文を出すため
Maximize Your Trading Opportunities with the "Auto Trendlines" Indicator Discover the "Auto Trendlines" Indicator: "Auto Trendlines" is the essential tool for every technical trader. This indicator automatically plots trend lines, pinpointing support and resistance levels with surgical precision. It's ideal for those looking to capitalize on market breakouts and reversals. Key Features: Automatic Trendline Plotting: Identifies and draws crucial trend lines without manual intervention. Advanced C
Automatic Fibonacci Tool Fibonacci retracements is a popular instrument used by technical analysts to determine potential Support and Resistance areas. In technical analysis, this tool is created by taking two extreme points (usually a peak and a minimum) on the chart and dividing the vertical distance by the key Fibonacci coefficients equal to 23.6%, 38.2%, 50%, 61.8%, and 100%. Our Automatic Fibonacci Tool is programmed to make thigs easier. Using this tool, there is no need to explicitly set
無限からの通貨の強さを測定するためのこの革新的な指標は、長い間取引されているダフ屋やトレーダーにとって不可欠な助手です。 通貨の強さ/弱さを分析するためのシステムは、世界の主要なトレーダーによって市場で長い間知られており、使用されてきました。 任意の裁定取引は、この分析なしでは完全ではありません。 私たちの指標は、互いに関連して基本通貨の強さを簡単に決定します。 これは、インスタント分析を可能にし、最強のエントリポイントを検索し、すべてまたは現在の通貨ペアの折れ線グラフが表示されます。 インジケータは直感的で、すぐに見つけて任意のペアに切り替えることができ、地下室とメインチャートの両方に配置できるモバイルパネルがあります。 通貨の強さの変化の通知のタイマーモードは、トレーダーに電話で通知を受け取る機会を与えます。  通貨パワーメーターインフィニティ指標を使用するためのいくつかの戦略: 1. 通貨の強さの線形表示のチャートを使用して、交差点を新興トレンドの信号として検索します 2. トレンド反転信号が表示された後、強い通貨の方向に頭皮 3. 通貨の強さの発散分析を使用して、
The "No Reversal Accumatrix AI" is a cutting-edge MetaTrader 5 indicator designed to assist traders in confirming trends without the inconvenience of repainting. Built upon advanced artificial intelligence algorithms, this indicator offers a reliable tool for identifying and validating trends in financial markets. Key Features: Non-Repainting Technology : Unlike traditional indicators prone to repainting, the "No Reversal Accumatrix AI" utilizes innovative algorithms to provide accurate trend co
Indicator and Expert Adviser  EA Available in the comments section of this product. Download with Indicator must have indicator installed for EA to work. Mt5 indicator alerts for bollinger band and envelope extremes occurring at the same time. Buy signal alerts occur when A bullish candle has formed below both the lower bollinger band and the lower envelope  Bar must open and close below both these indicators. Sell signal occur when A bear bar is formed above the upper bollinger band and upp
このプロダクトを購入した人は以下も購入しています
TPSpro TREND PRO  - is a trend indicator that automatically analyzes the market and provides information about the trend and each of its changes, as well as giving signals for entering trades without redrawing! The indicator uses each candle, analyzing them separately. referring to different impulses - up or down impulse. Exact entry points into transactions for currencies, crypto, metals, stocks, indices!  Version MT4               DETAILED DESCRIPTION               R ecommended to use with an
まず第一に、このトレーディングシステムがノンリペイント、ノンリドロー、ノンラグのインジケーターであることを強調する価値がある。これにより、手動取引とロボット取引の両方に理想的なものになっています。 オンラインコース、マニュアル、プリセットのダウンロード。 「スマートトレンドトレーディングシステム MT5」は、新規および経験豊富なトレーダー向けにカスタマイズされた包括的なトレーディングソリューションです。10以上のプレミアムインジケーターを組み合わせ、7つ以上の堅実なトレーディング戦略を備えており、多様な市場状況に対応する多目的な選択肢となっています。 トレンドフォロー戦略:トレンドを効果的に乗り越えるための正確なエントリーとストップロス管理を提供します。 リバーサル戦略:潜在的なトレンドの反転を特定し、トレーダーがレンジ相場を活用できるようにします。 スキャルピング戦略:高速で正確なデイトレードおよび短期取引のために設計されています。 安定性:すべてのインジケーターはノンリペイント、ノンリドロー、ノンラグであり、信頼性の高いシグナルを保証します。 カスタマイズ:個々の取引の嗜好に合わせ
Quantum Trend Sniper
Bogdan Ion Puscasu
4.92 (48)
ご紹介   クォンタム トレンド スナイパー インジケーターは 、トレンド反転を特定して取引する方法を変革する画期的な MQL5 インジケーターです。 13年以上の取引経験を持つ経験豊富なトレーダーのチームによって開発されました。     クォンタムトレンドスナイパーインジケーター   は、非常に高い精度でトレンドの反転を識別する革新的な方法で、あなたのトレーディングの旅を新たな高みに押し上げるように設計されています。 ***Quantum Trend Sniper Indicatorを購入すると、Quantum Breakout Indicatorを無料で入手できます!*** クォンタム ブレイクアウト インジケーターは、トレンドの反転を特定するとアラートを発し、矢印を示し、3 つのテイクプロフィットレベルを提案します。 初心者トレーダーにもプロのトレーダーにも適しています。 量子EAチャネル:       ここをクリック MT4のバージョン:       ここをクリック 推奨事項: 期間:すべての時間枠。最良の結果を得るには、M
これはMT5のインジケーターで、再描画なしで取引に参入するための正確なシグナルを提供します。 外国為替、暗号通貨、金属、株式、インデックスなど、あらゆる金融資産に適用できます。かなり正確な見積もりを提供し、取引を開始して終了するのに最適な時期を教えてくれます。1つのシグナルを処理しただけでインジケーターの元が取れた例の 動画 (6:22)をご覧ください。Entry PointsPro インジケーターの助けを借りたほとんどのトレーダーの最初の1週間の結果が改善しています。 Telegramグループ に登録してください。Entry Points Proインジケーターのメリットは次の通りです。 再描画のないエントリーシグナル 再描画されるインジケーターでは一度表示されたシグナルが削除されて大きな金銭的損失につながることがありますが、これと異なり、表示されて確認されたシグナルは消えることがありません。 エラーなしの取引開始 インジケーターアルゴリズムによって取引を開始する(資産を売買する)理想的な瞬間を見つけることができます。それを使用するすべてのトレーダーの成功率が向上します。
今、147ドル(いくつかの更新後に499ドルに増加します) - 無制限のアカウント(PCSまたはMac) RelicusRoad ユーザー マニュアル + トレーニング ビデオ + プライベート Discord グループへのアクセス + VIP ステータス 市場の新しい見方 RelicusRoad は、外国為替、先物、暗号通貨、株式、および指数の世界で最も強力な取引インジケーターであり、トレーダーに収益を維持するために必要なすべての情報とツールを提供します。初心者から上級者まで、すべてのトレーダーが成功するためのテクニカル分析と取引計画を提供します。これは、将来の市場を予測するのに十分な情報を提供する重要な取引指標です。意味をなさないチャート上のいくつかの異なる指標ではなく、完全な解決策を信じています.これは、信号、矢印 + 価格アクション情報を表示するオールインワンのインジケーターで、他に類を見ない非常に正確です。 強力な AI に基づいて、RelicusRoad は不足している情報とツールを提供して、あなたを教育し、トレーディングのプロ、成功したトレーダーにします。
Gartley Hunter Multi - An indicator for searching for harmonic patterns simultaneously on dozens of trading instruments and on all possible timeframes. Manual (Be sure to read before purchasing) | Version for MT4 Advantages 1. Patterns: Gartley, Butterfly, Shark, Crab. Bat, Alternate Bat, Deep Crab, Cypher 2. Simultaneous search for patterns on dozens of trading instruments and on all possible timeframes 3. Search for patterns of all possible sizes. From the smallest to the largest 4. A
Step into the realm of Forex trading with confidence and precision using XQ, a cutting-edge Forex indicator designed to elevate your trading game to unprecedented heights. Whether you're a seasoned trader or just stepping into the world of currency exchange, XQ Forex Indicator empowers you with the insights and signals needed to make informed trading decisions. The signal conditions are a combination of three indicators, and XQ Forex Indicator only display  medium and long-term trends . The ind
サポート線と抵抗線のプロットにうんざりしていませんか? サポートレジスタンス は、非常に興味深いひねりを加えてチャート内のサポートとレジスタンスラインを自動検出およびプロットするマルチタイムフレームインジケーターです。価格レベルは時間とともにテストされ、その重要性が高まるにつれて、ラインは太くなり、暗くなります。 [ インストールガイド | 更新ガイド | トラブルシューティング | よくある質問 | すべての製品 ] 一晩でテクニカル分析を強化 チャートを閲覧せずに重要な価格レベルを検出 一目ですべての価格レベルの相対的な強さを認識する すべての取引で最大30時間のプロットラインを節約 インジケーターは、すべての価格レベルの年齢を表示します インジケーターは再描画されていません 過去および現在の価格レベルは近接によって崩壊し、現在の市場行動に合わせて調整されます。動作は、必ずしもピークではない場所に線が引かれます。 価格レベルは、時間とともに拒否されるにつれて、より暗く、より広くなります ノイズを避けるために、重要でない価格レベルは定期的にクリアされます カスタマイズ可能な時間枠の
Introduction to X3 Chart Pattern Scanner X3 Cherart Pattern Scanner is the non-repainting and non-lagging indicator detecting X3 chart patterns including Harmonic pattern, Elliott Wave pattern, X3 patterns, and Japanese Candlestick patterns. Historical patterns match with signal patterns. Hence, you can readily develop the solid trading strategy in your chart. More importantly, this superb pattern scanner can detect the optimal pattern of its kind. In addition, you can switch on and off individu
現在33%オフ 初心者にもエキスパートトレーダーにも最適なソリューション このインジケーターは独自の機能と新しい公式を多数内蔵しており、ユニークで高品質かつ手頃な取引ツールです。このアップデートでは、2つの時間枠ゾーンを表示できるようになります。より長いTFだけでなく、チャートTFとより長いTF(ネストゾーンを表示)の両方を表示できます。すべてのSupply Demandトレーダーの皆さんのお気に召すはずです。:) 重要情報の公開 Advanced Supply Demandの可能性を最大化するには、 https://www.mql5.com/ja/blogs/post/720245 にアクセスしてください。   エントリーまたはターゲットの正確なトリガーポイントを正確に特定できれば取引がどのように改善されるか想像してみてください。新しい基盤となるアルゴリズムに基づいて構築されているため、買い手と売り手の間の潜在的な不均衡をさらに簡単に特定できます。これは、最も強い需要と供給のゾーンと、過去のパフォーマンス(古いゾーンを表示)がグラフィカルに表現されるためです。これらの機能は、最適
ご紹介     Quantum Breakout PRO は 、ブレイクアウト ゾーンの取引方法を変革する画期的な MQL5 インジケーターです。 13年以上の取引経験を持つ経験豊富なトレーダーのチームによって開発されました。     クォンタム ブレイクアウト プロ   は、革新的でダイナミックなブレイクアウト ゾーン戦略により、あなたのトレーディングの旅を新たな高みに押し上げるように設計されています。 クォンタム ブレイクアウト インジケーターは、5 つの利益ターゲット ゾーンを備えたブレイクアウト ゾーン上のシグナル矢印と、ブレイクアウト ボックスに基づいたストップロスの提案を提供します。 初心者トレーダーにもプロのトレーダーにも適しています。 量子EAチャネル:       ここをクリック 重要!購入後、インストールマニュアルを受け取るためにプライベートメッセージを送ってください。 推奨事項: 時間枠: M15 通貨ペア: GBPJPY、EURJPY、USDJPY、NZDUSD、XAUUSD アカウントの種類: ECN、Raw、またはス
TPA True Price Action indicator reveals the true price action of the market makers through 100% non-repainting signals strictly at the close of a candle! TPA shows entries and re-entries, every time the bulls are definitely stronger than the bears and vice versa. Not to confuse with red/green candles. The shift of power gets confirmed at the earliest stage and is ONE exit strategy of several. There are available now two free parts of the TPA User Guide for our customers. The first "The Basics"
Elliott Wave Trend was designed for the scientific wave counting. This tool focuses to get rid of the vagueness of the classic Elliott Wave Counting using the guideline from the template and pattern approach. In doing so, firstly Elliott Wave Trend offers the template for your wave counting. Secondly, it offers Wave Structural Score to assist to identify accurate wave formation. It offers both impulse wave Structural Score and corrective wave Structure Score. Structural Score is the rating to sh
FX Volume MT5
Daniel Stein
4.94 (17)
mql5と Telegramの モーニング・ブリーフィングで、詳細とスクリーンショットを含む毎日のマーケット・アップデートをご覧 ください! FX Volumeは、ブローカーの視点から市場のセンチメントをリアルに洞察する、最初で唯一の出来高インジケーターです。 ブローカーのような機関投資家が外国為替市場でどのようなポジションをとっているか、COTレポートよりもはるかに速く、素晴らしい洞察を提供します。 この情報をチャート上で直接見ることは、あなたの取引にとって真のゲームチェンジャーであり、画期的なソリューションです。 以下のようなユニークなマーケットデータ洞察から利益を得てください。 比率は 、通貨のロングポジションとショートポジションの比率をパーセントで表示します。 比率の変化は 、選択した期間内のロング比率とその変化率を表示します。 Volumes Totalは 、通貨の取引量(ロングとショート)の合計をロット単位で表示します。 Volumes Long :全通貨のロングポジションの取引量を表示します。 Volumes(ショート )は、全通貨のショートポジションの取引量を表示
The AT Forex Indicator MT5 is a sophisticated trading tool designed to provide traders with a comprehensive analysis of multiple currency pairs. This powerful indicator simplifies the complex nature of the forex market, making it accessible for both novice and experienced traders. AT Forex Indicator uses advanced algorithms to detect trends, patterns and is an essential tool for traders aiming to enhance their forex trading performance. With its robust features, ease of use, and reliable signal
If you want to find good trading opportunities, then you must trade near the Trend Line. This allows you to have a tighter         stop loss   on your trades — which improves your       risk to reward . But that’s not all… Because if you combine Trend Line with Support and Resistance, that’s where you find the best trading opportunities. Now you might wonder: “So when do I enter a trade?” Well, you can use reversal     candlestick patterns   (like the   Hammer, Bullish Engulfing, etc.) as your e
Royal Scalping Indicator is an advanced price adaptive indicator designed to generate high-quality trading signals. Built-in multi-timeframe and multi-currency capabilities make it even more powerful to have configurations based on different symbols and timeframes. This indicator is perfect for scalp trades as well as swing trades. Royal Scalping is not just an indicator, but a trading strategy itself. Features Price Adaptive Trend Detector Algorithm Multi-Timeframe and Multi-Currency Trend Low
このインジケーターは、最も適切なエントリーとエグジットポイントを表示します。また、取引をよりよく分析するために、すべてのシグナルの統計データを表示します。 このインジケーターを使うことで、市場をより深く理解することができるようになります。 トレンドの力が弱まり始めると(パネルに表示されます)、トレンドラインは水平位置に引き寄せられ、これは取引を終了するシグナルです。または、平均/中央の利益水準に達したときに終了することもできます。 このインジケーターは、2010年からの私の取引経験の結果です。 MT4用インジケーターバージョン 特徴 このインジケーターは再描画しません。ヒストリカルチャートに表示されているものは、リアルタイムでも表示されます。 暗号通貨、株式、金属、指数、商品、通貨など、あらゆる資産の取引に使用できる。 すべてのタイムフレームで動作します。 エントリーするためのシグナルは、新しいローソク足のオープニングで表示されます。 取引終了のシグナルは暫定的に表示され、より大きな利益で取引を終了できることが多いからです。 左上には、取引統計の詳細パネルがあり、最小
Bill Williams Advanced is designed for automatic chart analysis using Bill Williams' "Profitunity" system. The indicator analyzes four timeframes at once. Manual (Be sure to read before purchasing) Advantages 1. Automatically analyzes the chart using the "Profitunity" system of Bill Williams. The found signals are placed in a table in the corner of the screen. 2. Equipped with a trend filter based on the Alligator indicator. Most of the system signals are recommended to be used only accordi
次世代の自動化された需要と供給のゾーン。どのチャートでも機能する新しい革新的なアルゴリズム。すべてのゾーンは、市場の価格行動に従って動的に作成されています。 2種類のアラート --> 1) 価格がゾーンに達したとき 2) 新しいゾーンが形成されたとき もう 1 つの役に立たない指標はありません。実績のある完全な取引戦略を手に入れることができます。     新機能:     価格が需給ゾーンに達したときにアラートを出す     新しい需給ゾーンが作成されたときにアラートを発します     プッシュ通知アラート     ピップ単位のゾーン幅ラベル     MTF のもう 1 つのタイムフレーム。したがって、現在より 2 時間足高いのではなく、現在より 3 時間足し上に見えるようになります。     アラート/ゾーン/MTF 機能を有効/無効にするボタン あなたが得る利点:     取引から感情を取り除きます。     取引エントリをオブジェクト化します。     確率の高いセットアップで利益
The Volumebyprice.com Indicator for MetaTrader 5 features Volume Profile and Market Profile TPO (Time Price Opportunity). Volume and TPO histogram bar and line charts. Volume Footprint charts. TPO letter and block marker collapsed and split structure charts. Static, dynamic and flexible range segmentation and compositing methods with relative and absolute visualizations. Session hours filtering and segment concatenation with Market Watch and custom user specifications. Graphical layering, posit
Introduction to Fractal Pattern Scanner Fractal Indicator refers to the technical indicator that makes use of the fractal geometry found in the financial market. Fractal Pattern Scanner is the advanced Fractal Indicator that brings the latest trading technology after the extensive research and development work in the fractal geometry in the financial market. The most important feature in Fractal Pattern Scanner is the ability to measure the turning point probability as well as the trend probabil
トレンドトレーディング は、タイミングのプルバックとブレイクアウトにより、市場で起こっているトレンドから可能な限り利益を得るように設計された指標です。確立されたトレンドの中で価格が何をしているかを分析することにより、取引の機会を見つけます。 [ インストールガイド | 更新ガイド | トラブルシューティング | よくある質問 | すべての製品 ] 自信を持って効率的に金融市場を取引する むち打ちにならずに確立されたトレンドから利益を得る 収益性の高いプルバック、ブレイクアウト、早期の逆転を認識する この指標は、独自の品質とパフォーマンスを分析します 複数時間枠のダッシュボードを実装します インジケーターは再描画されていません 電子メール/音声/視覚アラートを実装します 確立されたトレンドは多くの取引機会を提供しますが、ほとんどのトレンド指標はそれらを完全に無視しています。インジケーターの解釈はかなり簡単です: (1) トレンドの変化 (2) トレンドの方向への後退 (3) トレンドの方向へのブレイクアウト 赤いダッシュ は下降トレンド中の修正です 青いダッシュ は上昇ト
WHY IS OUR FXACCCURATE LS MT5 THE PROFITABLE ? PROTECT YOUR CAPITAL WITH RISK MANAGEMENT Gives entry, stop and target levels from time to time. It finds Trading opportunities by analyzing what the price is doing during established trends. POWERFUL INDICATOR FOR A RELIABLE STRATEGIES We have made these indicators with a lot of years of hard work. It is made at a very advanced level. Established trends provide dozens of trading opportunities, but most trend indicators completely ignore them!
スイングトレーディング は、トレンドの方向のスイングと可能な反転スイングを検出するように設計された最初のインジケーターです。トレーディングの文献で広く説明されているベースラインスイングトレーディングアプローチを使用します。インディケータは、いくつかの価格と時間のベクトルを調査して、全体的なトレンドの方向を追跡し、市場が売られ過ぎまたは買われ過ぎて修正の準備ができている状況を検出します。 [ インストールガイド | 更新ガイド | トラブルシューティング | よくある質問 | すべての製品 ] むち打ちを起こさずに市場スイングの利益 インジケーターは常にトレンドの方向を表示します 色付きの価格帯は機会のベースラインを表します 色付きのダッシュは、可能な反転スイングを表します この指標は、独自の品質とパフォーマンスを分析します 複数時間枠のダッシュボードを実装します カスタマイズ可能なトレンドおよびスイング期間 電子メール/サウンド/プッシュアラートを実装します インジケータは再描画またはバックペインティングではありません Swing Tradingとは Swing Tradi
このインディケータは、価格アクション分析とドンチャンチャネルのみを使用して、ジグザグ方式で価格の反転を検出します。再描画やバックペインティングを一切行わずに、短期取引向けに特別に設計されています。それは彼らの操作のタイミングを増やすことを目指している賢明なトレーダーにとって素晴らしいツールです。 [ インストールガイド | 更新ガイド | トラブルシューティング | よくある質問 | すべての製品 ] 驚くほど簡単に取引できます すべての時間枠で価値を提供します 自己分析統計を実装します 電子メール/音声/視覚アラートを実装します 可変長のブレイクアウトと混雑ゾーンに基づいて、インディケータは価格アクションのみを使用して取引を選択し、市場が非常に高速に行っていることに反応します。 過去のシグナルの潜在的な利益が表示されます この指標は、独自の品質とパフォーマンスを分析します 負けブレイクアウトは強調表示され、説明されます インジケータは、非バックペインティングおよび非再ペイントです この指標は、日中のトレーダーが単一の価格反転を見逃さないようにするのに役立ちます。ただし、す
The iChannels
BeeXXI Corporation
5 (1)
Ultra-fast recognition of parabolic channels (as well as linear, horizontal and wavy channels) throughout the depth of history, creating a hierarchy of channels. Required setting: Max bars in chart: Unlimited This indicator is designed primarily for algorithmic trading, but can also be used for manual trading.  This indicator will have a very active evolution in the near future and detailed descriptions on how to apply to create robots
IVISTscalp5
Vadym Zhukovskyi
5 (5)
iVISTscalp5インジケーターをご紹介します。このインジケーターは、トレーディングにおいて独自でありながら効果的です。時間データに基づくこのインジケーターは、多年にわたる経験と金融市場の深い分析の結果です。iVISTscalp5インジケーターは、手動トレーディングにとって優れたツールです。便利さ、簡単さ、可視化 - すべての複雑さが内部に隠されています。私たちは、iVISTscalp5インジケーターの設定と使用を最大限に簡素化しました。このインジケーターは、MT5ターミナルにあるすべての金融商品に適しています。 稼働時間は、4時から20時(UTC+3)です。 iVISTscalp5インジケーターメニュー(スクリーンショット1を参照): History - 引用を計算する週数 dT_min - 時間間隔の選択(分) TFline - 水平ボリュームの作成(時間枠) BARSline - 水平ボリュームの作成(バー数) TFtrend1 - デイリーチャンネルの作成(時間枠) BARStrend1 - デイリーチャンネルの作成(バー数) TFtrend2 - 週次チャンネルの作成(時
3 Indicators in 1 indicator Strategy based on price action Made specifically for the best forex currency pairs Can be used in the best time frame of the market at a very reasonable price This indicator is basically 3 different indicatos . But we have combined these 3 indicators in 1 indicator so that you can use 3 indicators at the lowest price. All three strategies are based on price action. But based on different trends. Long term, medium term and short term Attributes : No repaintin
プレシジョン・インデックス・オシレーター(Pi-Osc)は、Precision Trading SystemsのRoger Medcalfによるものです。 バージョン2は、チャートにスーパーファストでロードされるように注意深く再コードされ、その他の技術的な改良も組み込まれて、エクスペリエンスを向上させています。 Pi-Oscは、市場が強制的に行かなければならない、すべての人のストップを取り除くためのポイントである、極限のエクソースト・ポイントを見つけるために設計された正確な取引タイミング信号を提供するために作成されました。 この製品は、極限のポイントがどこにあるかを知るという古代の問題を解決し、トレーダーの生活をはるかにシンプルにします。 これは、業界標準のオシレーターとは異なる強力な要素を持つ高度なコンセンサス・インジケーターです。 使用されている一部の機能には、需要指数、マネーフロー、RSI、スティリング、パターン認識、出来高分析、標準偏差の極値などがあり、異なる長さでこれらのバリエーションが多く含まれています。 初めて見ると、訓練されていない目には、他の
作者のその他のプロダクト
In foreign exchange trading, the most important investment principle is to ensure the safety of the principal, and risk prevention and control is the primary operation concept. How to manage the account funds is to control the position size and the profit and loss of the order, this EA is designed based on this idea. It can directly manage the risk control of the trading account and realize two functions. One is to close the position according to the profit and loss ratio, and the other is to au
Fibonacci indicator based on fractal.This software can automatically draw the golden section proportional line of two trend lines, and mark all the recent high and low prices.And the percentage value of volatility is a multi-cycle, multi-currency oscillation indicator.It is very effective for traders to find support and resistance lines and find entry and exit points near them.
Account Fund Income Trend Line Indicator 1. This indicator is used to automatically draw a curve and a histogram of the profit amount of the trading order that has been closed in the current account and the account balance after the position,and the three data of the transaction volume, which is applicable to all cycles of the chart.2. The three data can be exported into CSV files by date, which is convenient for data analysis of third-party software.  3. The indicator contains an external para
Two-way Fibonacci trading system。 This EA software is an EA trading system based on two-way FIBO line as an entry signal, plus fixed stop-loss and stop-loss for risk control. Safe and controllable. Every trade must have a stop loss and take profit.Main functions: 1. Trading volume: can adopt fixed and automatic adjustment of trading volume. Automatically adjust the trading lot size to open a position at the rate of 1 lot per 10,000 USD margin Fixed lot, can be set externally. 2. Take profit and
Trading system based on pure candle line. This software is based on the relationship between the upper and lower candles as an entry signal, plus fixed stop loss for risk control of the Expert Advisor system. Safe and controllable. Only one order transaction is made at a time, and a stop loss must be set, leaving the market two days later. The main function: 1. Trading volume: Both fixed and automatic trading volume adjustment modes can be adopted. Automatically adjust the trading lot size to op
フィルタ:
レビューなし
レビューに返信