Risk Reward Panel
- インディケータ
- HESAMEDDIN ABDOLRAHIM RAHI
- バージョン: 2.0
- アップデート済み: 1 1月 2022
- アクティベーション: 5
Risk Reward Panel
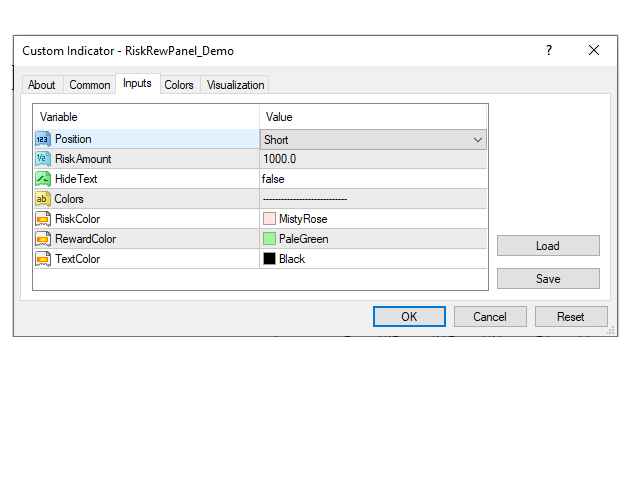
This is a useful tool to plan a trade risk to reward visually. The indicator is very simple to use with minimum settings.
Long or Short
You can use the indicator for both long and short positions.
Lot Size Calculator
You can also use this indicator as a lot size calculator. If you set the risk amount the indicator will calculate the lot size for you based on the stop loss line. You do not need to calculate the lot size manually.