MWC Ratio 5
- インディケータ
- Joerg Hamann
- バージョン: 2.1
- アップデート済み: 7 8月 2021
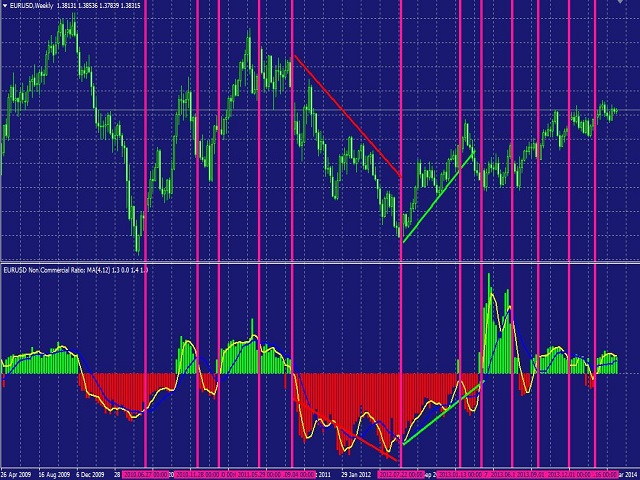
The Commitments of Traders Ratio Indicator is one of these things you never thought about it before you really see the magic behind it. The indicator shows the Ratio of long/short positions released by the CFTC once a week.
If you have a look on the Sreenshot you can see two (three) zones of interest.
Important note: MAs are not available in version 1.0.
- Zone 1: The Switches (Red -> Green, Green -> Red)
- Zone 2: MA cross
- Zone 3: If you combine this with the COX indicator an additional zone will appear. You also can experiment with Ratio crossing MA.
If one of theses things happens and some of your favorite Indicator set on H4/D1 ringing in the same way it's time to think about an entry point.
Obviously the MWC Ratio is also a very good big Trend Indicator!
Please make sure that you download the MWC_Demo.zip file and unpack it into [...]/MQL5/Files folder.
-> www.myweeklycot.com/teaser-demo


does not work