VWAP Stdev Bands
- インディケータ
- Diogo Martins De Souza
- バージョン: 2.30
- アップデート済み: 10 3月 2020
- アクティベーション: 5
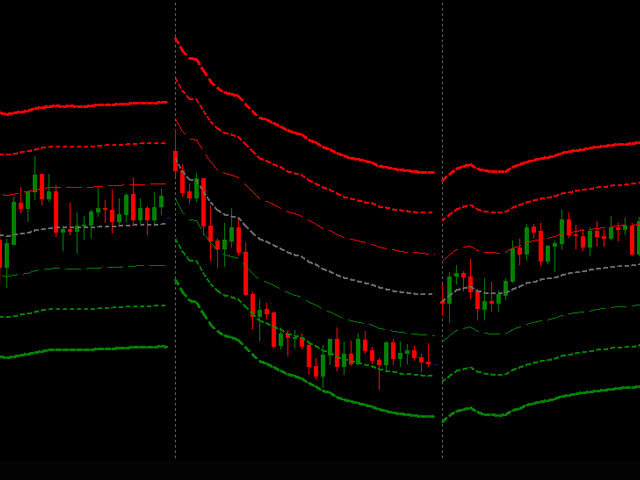
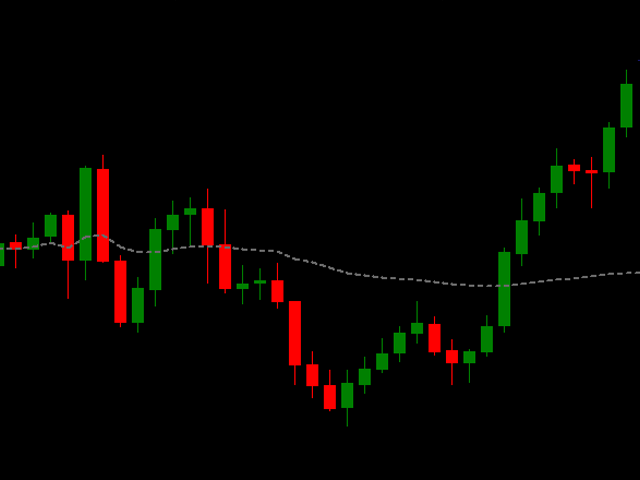
This indicator plots VWAP with 4 Standard Deviation bands.
In finance, volume-weighted average price (VWAP) is the ratio of the value traded to total volume traded over a particular time horizon (usually one day). It is a measure of the average price at which a stock is traded over the trading horizon.
VWAP is often used as a trading benchmark by investors who aim to be as passive as possible in their execution. Many pension funds, and some mutual funds, fall into this category. The aim of using a VWAP trading target is to ensure that the trader executing the order does so in-line with volume on the market. It is sometimes argued that such execution reduces transaction costs by minimizing market impact costs (the additional cost due to the market impact, i.e. the adverse effect of a trader’s activities on the price of a security).
VWAP is often used in algorithmic trading. Trading algorithms that use VWAP as a target belong to a class of algorithms known as volume participation algorithms.
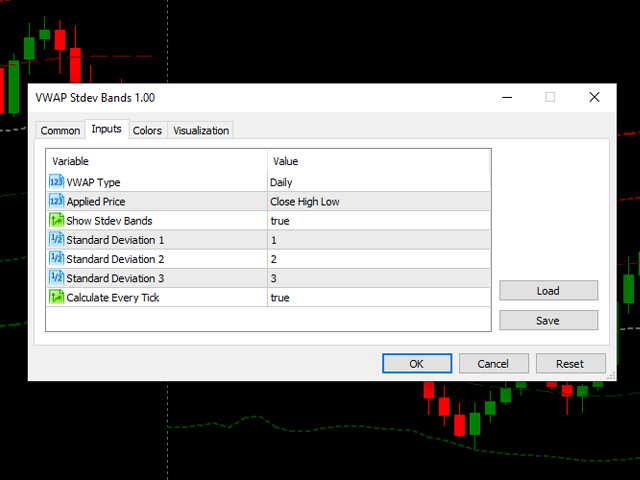
Parameters:
- VWAP Type:
- Daily
- Weekly
- Monthly
- Applied Price:
- Open
- Close
- High
- Low
- Open Close
- High Low
- Close High Low
- Open Close High Low
- Show Stdev Bands
- Standard Deviation 1
- Standard Deviation 2
- Standard Deviation 3
- Standard Deviation 4
- Calculate Every Tick
ATTENTION! For use in Expert Advisors:
Buffers Index:
- VWAP = 0
- Upper Band 4 = 2
- Upper Band 3 = 4
- Upper Band 2 = 6
- Upper Band 1 = 8
- Lower Band 1 = 10
- Lower Band 2 = 12
- Lower Band 3 = 14
- Lower Band 4 = 16







Doesn't show deviation of bands as it describes. Dont buy