Trend Strength Analyzer 4
- インディケータ
- Andrey Sorokin
- バージョン: 1.0
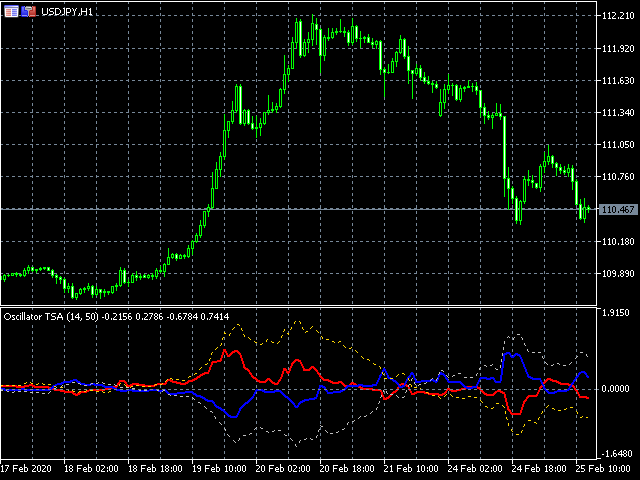
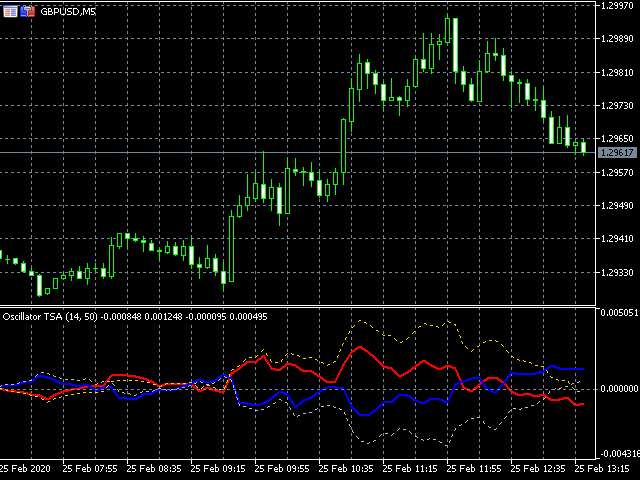
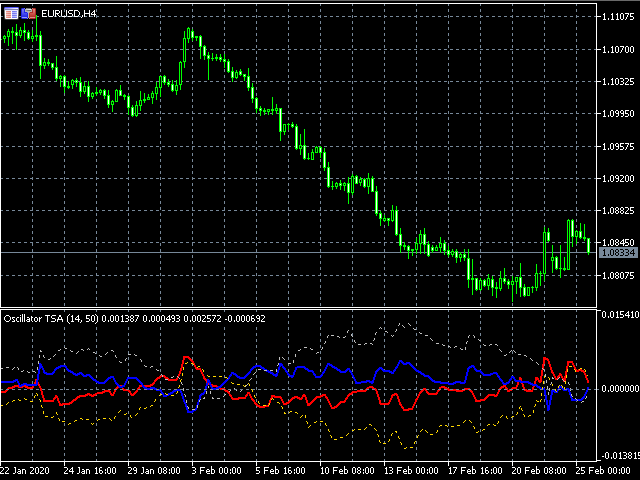
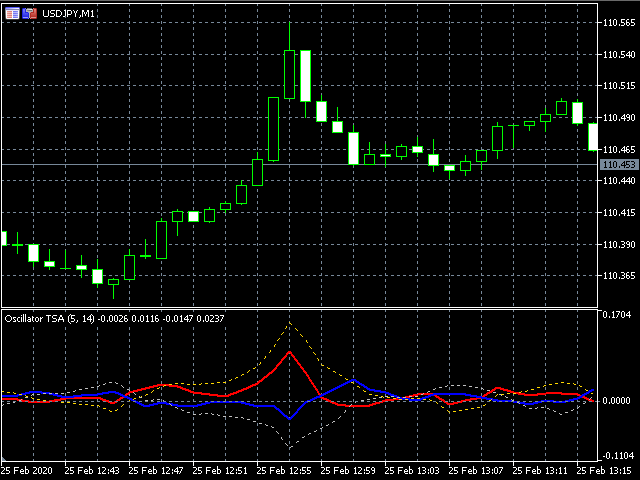
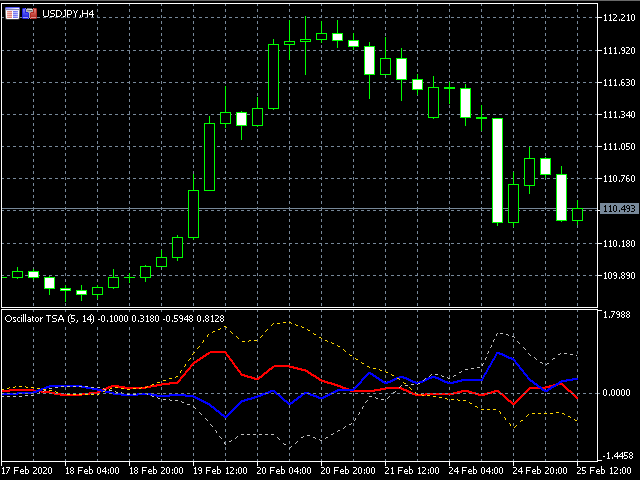
The technical indicator Trend Strength Analyzer measures the deviation of the price of an instrument from average values over a specific period of time. A comparative analysis of the relative strength of bulls and bears underlies the indicator. If bulls prevail, an upward trend. If bears are stronger - a downward trend.
Settings:
Strike Energy (2 solid lines) = 14.
Influence Power (2 dotted lines) = 50.
The TSA oscillator is effective in an active market. The most commonly used indicator signals are discrepancies, intersections, transitions from the zone of negative values to the zone of positive values and vice versa. The divergence of the lines suggests that one of the parties takes over: buyers or sellers. The convergence of the lines warns of a change in the balance of power of opponents. Crossing lines means a change in trend.