• 概要
  • レビュー (95)
  • コメント (267)
  • 最新情報

Trend Screener

4.79

トレンドインジケーター、1つのツールに組み込まれたすべての重要なトレンド機能を備えたトレンドトレーディングとフィルタリングのための画期的なユニークなソリューション! これは、すべてのシンボル/商品(外国為替、商品、暗号通貨、インデックス、株式)で使用できる100%再描画されていないマルチタイムフレームおよびマルチ通貨インジケーターです。

トレンドスクリーナーは、チャート内のドットで矢印トレンドシグナルを提供するインジケーターに続く効率的なインジケーターです。 トレンド分析インジケーターで使用できる機能:

1.トレンドスキャナー。

2.最大利益分析を備えたトレンドライン。

3.トレンド通貨強度メーター。

4.アラート付きのトレンド反転ドット。

5.アラート付きの強いトレンドドット。

6.トレンド矢印

毎日の分析例、毎日のシグナルパフォーマンス...など、トレンドスクリーナーインジケーターを使用して、ここで見つけることができます:ここをクリックしてください


期間限定オファー:トレンドスクリーナーインジケーターは、50ドルと生涯でのみご利用いただけます。 (元の価格125 $)
MQL5ブログにアクセスすると、分析例、毎日の信号パフォーマンスなどを含むすべてのプレミアム指標を見つけることができます。 : ここをクリック


2つの指標で構成されるトレンドシステム:
1.Trend Screener Indicator :トレンドダッシュボード、チャートのトレンドライン、エントリーポイントなどを表示します。

2.Trend Line Map Indicator:ダッシュボードとして売買を表示し、アクティブなシグナルは利益/損失...などを表示します。

        トレンドラインマップインジケーターをダウンロード


Youtube ビデオのチュートリアル :

MQL5 ブログをチェックすると、トレンド スクリーナー インジケーターの使用方法と取引方法を説明する多くの YouTube ビデオ チュートリアルを見つけることができます。 すべてのビデオを検索するには、ここをクリックしてください。


主な機能

  • トレンド強度アナライザー。
  • マルチタイムフレームおよびマルチ通貨トレンド分析。
  • トレンドダッシュボード
  • トレンド反転シグナル。 (ドット信号)
  • 強いトレンドシグナル。 (ドット信号)
  • トレンドライン


ドキュメント(手順)

すべてのトレンドスクリーナーのドキュメント(手順)と戦略の詳細は、MQL5ブログのこの投稿で入手できます:ここをクリックしてください。


コンタクト

ご不明な点がある場合やサポートが必要な場合は、プライベートメッセージでご連絡ください。


著者

SAYADI ACHREF、フィンテックソフトウェアエンジニアおよびFinansyaの創設者。


レビュー 20
waqarqureshi1
57
waqarqureshi1 2024.08.05 14:25 
 

Amazing

Nagib Mahfuj Nayem
37
Nagib Mahfuj Nayem 2024.08.02 18:27 
 

This is really Insane. I just used only one week but more than 500 pips made with this indicator with only GOLD. And his support is really top notch. 100% Recommended.

Gimel Abayon Roda
334
Gimel Abayon Roda 2024.07.16 07:07 
 

I have been using this indicator to analyze the market trend. The dashboard is very useful in identifying the overall market direction. The CSM trend is useful in identifying the strong, weak and ranging currencies. I am using this in 15min timeframe. Though not recommended by the seller to use it in timeframes lower than 30mins, the indicator can still help generate positive pips, especially when you use it with support and resistance indicator.

おすすめのプロダクト
トレンドラインマップインジケーターは、トレンドスクリーナーインジケーターのアドオンです。トレンドスクリーナー(トレンドラインシグナル)によって生成されたすべてのシグナルのスキャナーとして機能します。 これは、トレンドスクリーナーインジケーターに基づくトレンドラインスキャナーです。 Trend Screener Pro インジケーターがない場合、Trend Line Map Proは機能しません。 ブログにアクセスすると、トレンドラインマップインジケーターの無料バージョンをダウンロードできます。 Metatrader Testerの制限なしで、購入する前に試してみてください。 :    ここをクリック 1.簡単になる利点 通貨と時間枠に基づいて売買シグナルを表示します。 チャートに矢印が表示されてから価格が増減したピップ数を評価します。 (トレンドスクリーナーインジケーター矢印) 信号のタイミングを表示します。 アラートを売買するための複数の時間枠と複数の通貨のアラートを取得します。 2.トレンドラインマップの使用方法 売買シグナルダッシュボードを表示す
の紹介     Quantum平均足PRO チャート 市場のトレンドに対する明確な洞察を提供するように設計された平均足キャンドルは、ノイズを除去し、誤ったシグナルを排除する能力で知られています。混乱を招く価格変動に別れを告げ、よりスムーズで信頼性の高いチャート表現を導入しましょう。 Quantum Heiken Ashi PRO を真にユニークなものにしているのは、従来のローソク足データを読みやすい色のバーに変換する革新的なフォーミュラです。赤と緑のバーはそれぞれ弱気トレンドと強気トレンドをエレガントに強調し、潜在的なエントリーポイントとエグジットポイントを驚くほど正確に見つけることができます。 量子EAチャネル:       ここをクリック MT5のバージョン:       ここをクリック この注目すべき指標には、いくつかの重要な利点があります。 明確性の向上: 価格変動を平滑化することで、平均足バーは市場トレンドをより明確に表現し、有利な取引機会を特定しやすくします。 ノイズの削減: 誤ったシグナルを引き起こすことが多い不安定な価格変動に別れを告げます。 Quan
MT4 の R 2EMA Color インジケーターは、2 つの EMA のクロスオーバーに基づく堅実な取引シグナルを提供します。 キーポイント 価格が 2 つの緑色の EMA を超えて閉じると、買いトレード シグナルが作成されます。 価格が 2 つの赤い EMA を超えて閉じると、売りトレード シグナルが作成されます。 R 2EMA Color Forex インジケーターにより、売買のタイミングをより簡単に判断できます 2 つの EMA ラインが緑色に変わると、買いシグナルが発生します。 2 つの EMA ラインが赤くなると、売りシグナルが発生します。 それと取引する方法は? 2 つの EMA シグナル ラインが赤色から緑色に変わるとすぐに買い取引を開始します。トレンドは現在ポジティブです。 2 つの EMA シグナル ラインが緑色から赤色に変わるとすぐに売りトレードを開始します。トレンドは現在ネガティブです。 チャート上で反対の取引シグナルが発生したら、取引を終了します。 R 2EMA Color インジケーターで取引を開始および終了するために、お好みの取引方法を自由
This indicator applies the  biquad high pass filter to the price-chart data, and displays the filter output for the OHLC as candlesticks. The candlesticks corresponds to the actual calculations of the filter value  during the formation of each price bar (not from all historical highs lows or closes). The shape of the bars therefore corresponds directly to the shape of each price bar. High pass filters are an underappreciated type of oscillator that are seldom used in technical analysis in the st
FREE
Noize Absorption Index - is the manual trading system that measures the difference of pressure between bears forces and bulls forces. Green line - is a noize free index that showing curent situation. Zero value of index shows totally choppy/flat market.Values above zero level shows how powerfull bullish wave is and values below zero measures bearish forces.Up arrow appears on bearish market when it's ready to reverse, dn arrow appears on weak bullish market, as a result of reverse expectation. S
これは、キャンドルの終値を予測する指標です。 このインジケータは、主にD1チャートでの使用を目的としていますが. この指標は、従来の外国為替取引とバイナリオプション取引の両方に適しています。 インジケーターは、スタンドアロンのトレーディングシステムとして使用することも、既存のトレーディングシステムへの追加として機能させることもできます。 このインジケーターは、現在のキャンドルを分析し、キャンドル自体の内部の特定の強度係数と、前のキャンドルのパラメーターを計算します。 したがって、この指標は、市場の動きのさらなる方向性と現在のキャンドルの終値を予測します。 この方法のおかげで、この指標は、短期の日中取引だけでなく、中期および長期の取引にも適しています。 インジケーターを使用すると、市場の状況の分析中にインジケーターが生成する潜在的な信号の数を設定できます。 インジケーターの設定には、このための特別なパラメーターがあります。 また、インジケーターは、チャート上のメッセージの形式で、電子メールで、およびPUSH通知の形式で、新しい信号について通知することができます。 購入後は必ず私に書いて
Super Reversal Pattern Indicator Unlock the power of advanced pattern recognition with our Super Reversal Pattern Indicator. Designed for traders seeking precision and reliability, this indicator identifies one of the most effective reversal patterns in technical analysis, offering a significant edge in your trading strategy. Key Features: Non-Repainting Accuracy: Enjoy the confidence of non-repainting technology. Once a Super Reversal Pattern is detected, it remains static, providing consis
MACD Color for GOLD  Use for looking moving-way of graph and checking will be buy or sell  Easy for looking by see the color of trand. Red is down / Blue is up.  Can to use it with every time-frame by 1. Long Trade : Use it with time-frame H1 /  H4 /  Daily  2.Short Trade : Use it with  time-frame  M5 / M15  / M 30 /  H1 and you can see when you will open or close the orders by see this indicator by well by see signal line cut with color line again in opposite. and you can use this indicator for
Classic Fractals indicator for MT4, with additional Trendlines connecting the latest couples of fractals ( fractals are showing highest high, and lowest low on each period) Rules for trendlines: -if new top fractal is below the last one = new resistance line -if new bot fractal is above the last one = new support line -Trendlines can be hidden -Fractals can be hidden Fractal Period = can be both even or uneven number, as it is setting for half (one side) of the bars sequence
Binary Options Support Resistance Indicator This indicator is designed for binary options trading and effectively shows retracements from support and resistance levels. Signals appear on the current candle. A red arrow pointing downwards indicates a potential selling opportunity, while a blue arrow pointing upwards suggests buying opportunities. All that needs adjustment is the color of the signal arrows. It is recommended to use it on the M1-M5 timeframes as signals are frequent on these timef
The Volumebyprice.com Indicator for MetaTrader 4 features Volume Profile and Market Profile TPO (Time Price Opportunity). Volume and TPO histogram bar and line charts. Volume Footprint charts. TPO letter and block marker collapsed and split structure charts. Static, dynamic and flexible range segmentation and compositing methods with relative and absolute visualizations. Session hours filtering and segment concatenation with Market Watch and custom user specifications. Graphical layering, posit
TWO PAIRS SQUARE HEDGE METER INDICATOR Try this brilliant 2 pairs square indicator It draws a square wave of the relation between your two inputs symbols when square wave indicates -1 then it is very great opportunity to SELL pair1 and BUY Pair2 when square wave indicates +1 then it is very great opportunity to BUY pair1 and SELL Pair2 the inputs are : 2 pairs of symbols         then index value : i use 20 for M30 charts ( you can try other values : 40/50 for M15 , : 30 for M30 , : 10 for H1 ,
Power Renko is an indicator which plots Renko bricks underneath the chart using a histogram. You can select the brick size and the timeframe of the Renko bricks as well as whether or not to use the close price or the high/low price of the candles. Renko bricks are based on price alone, not time, therefor the Renko bricks will not be aligned with the chart's time. They are extremely useful for trend trading and many different strategies can be formed from them. Buffers are provided allowing you t
The Rapid indicator is a ready binary options trading system . The system is designed for trading on a five-minute interval with the 15-minute expiration and with the payout at least 85%, it is designed for traders using web terminals and MetaTrader 4 platform. Available financial instruments: EURUSD, EURCHF, GBPUSD, GBPJPY, USDJPY and XAGUSD. This is a counter-trend system, i.e. it waits for the price reversal of a traded asset. The indicator signals are not redrawn, they appear after the close
This indicator works on MT4 and is very easy to use. When you receive a signal from it, you wait for that candle with the signal to close and you enter your trade at the beginning of the next new candle . A red arrow means sell and a green arrow means buy. All arrows comes with Alert  like for easy identification of trade signal. Are you okay with that? 1 minute candle 1 minute expire
Indicator for binary options arrow is easy to use and does not require configuration works on all currency pairs, cryptocurrencies buy signal blue up arrow sell signal red down arrow tips do not trade during news and 15-30 minutes before their release, as the market is too volatile and there is a lot of noise it is worth entering trades one or two candles from the current period (recommended for 1 candle) timeframe up to m 15 recommended money management fixed lot or fixed percentage of the depo
YK-Fibo Pivot Indicator: Trade Smarter with Fibonacci Pivot Points The YK-Fibo Pivot Indicator is a powerful technical analysis tool that combines the precision of Fibonacci retracements with the insights of Pivot Points. Whether you're a novice or seasoned trader, this indicator empowers you to spot profitable opportunities in the market with ease. Why Choose YK-Fibo Pivot? Pinpoint Support & Resistance: By calculating Fibonacci levels based on the previous day's high, low, and close prices, y
NEW check the FULL Version Including the private ICT tools limited so far until the release of the full 2016 Mentorship Core Content to the public. Indicator type: Money Management Calculator; Forex Position Size Calculator; Fixed or ATR value for Stop Loss and Take Profit levels; Average Position Size Indicator (True Average Price); Acc ount Information; Stop-out Level, Margin and Risk Exposure Warning, Forex Sessions; Institutional Levels Grid; Major Highs and Lows, Detailed Account Report an
Hi Trader, We are strategy development for Binary and Forex tools, our product have success for binary trading 1 min - 2 min experation. At the moment I build indicator for trading all day, not like Bonosu series with specific time. We launch A-Boss Stats Indicator for trading 1 minute to 5 minutes experation is mean can trade from 1 minutes - 5 minutes. Specification of A Boss Stats trading binary option: Work with all MT4 broker. Chart Time Frame M1 only, can use M5 Experation time for contact
This is a new strategy for SUPPLY DEMAND areas It is based on a calculation using the tick volume to detect the big price action in market for both bear /bull actions this smart volume action candles are used to determine the supply and demand areas prices in between main supply and demand lines indicate sideway market  up arrows will be shown when prices moves above the main supply and the secondary supply lines Down arrows will be shown when prices moves below the main demand and the secondary
5 signal in 1  Product     TimeFrame   Recommend   1m-5m recommend  signal   TF  5m    Banks Pro Binary Option is Indicator for binary option Can Use Manaul Trade or Robot on Platform  Mt2Trading  https://www.mt2trading.com/?ref=104    Time Trading   good work  EU session    Recommend  Curency   EUR  GBP USD        careful   AUD JPY      Recommend  Martingale 2-5 Step   Recommend  set profit  2%-5%/Day Setting Brake  News Event High volatility   recommend  15-30 min Have Problem Contract
Advanced Stochastic Scalper - is a professional indicator based on the popular Stochastic Oscillator. Advanced Stochastic Scalper is an oscillator with dynamic overbought and oversold levels, while in the standard Stochastic Oscillator, these levels are static and do not change. This allows Advanced Stochastic Scalper to adapt to the ever-changing market. When a buy or a sell signal appears, an arrow is drawn on the chart and an alert is triggered allowing you to open a position in a timely mann
This indicator scans and displays currency pairs that have recently aligned moving averages on a given timeframe. You can configure which pairs the indicator will scan. It also includes all types of alert options. Bullish MA Alignment =  MA1>MA2>MA3>MA4>MA5 Bearish MA Alignment =  MA1<MA2<MA3<MA4<MA5 Features Attach to one chart and scans all the currency pairs configured and visible in the Market Watch Window It can monitor all the available timeframes from M1 to MN1 and sends alerts on ever
VR Cub
Vladimir Pastushak
VR Cub は、質の高いエントリーポイントを獲得するためのインジケーターです。このインジケーターは、数学的計算を容易にし、ポジションへのエントリーポイントの検索を簡素化するために開発されました。このインジケーターが作成されたトレーディング戦略は、長年にわたってその有効性が証明されてきました。取引戦略のシンプルさはその大きな利点であり、初心者のトレーダーでもうまく取引することができます。 VR Cub はポジション開始ポイントとテイクプロフィットとストップロスのターゲットレベルを計算し、効率と使いやすさを大幅に向上させます。取引の簡単なルールを理解するには、以下の戦略を使用した取引のスクリーンショットを見てください。 設定、設定ファイル、デモ版、説明書、問題解決方法は、以下から入手できます。 [ブログ] レビューを読んだり書いたりすることができます。 [リンク] のバージョン [MetaTrader 5] エントリーポイントの計算ルール ポジションをオープンする エントリーポイントを計算するには、VR Cub ツールを最後の高値から最後の安値までストレッチする必要があります。
This indicator is a conventional analytical tool for tick volumes changes. It calculates tick volumes for buys and sells separately, and their delta on every bar, and displays volumes by price clusters (cells) within a specified bar (usually the latest one). The algorithm used internally is the same as in the indicator VolumeDelta , but results are shown as cumulative volume delta bars (candlesticks). Analogous indicator for MetaTrader 5 exists - VolumeDeltaBars . This is a limited substitution
The indicator is designed to trade binary options on small time frames up to m 30 Signals The blue up arrow is a buy signal. The red dn arrow is a sell signal. The signal will appear together with the advent of a new candle  and during formation Signals on the current candle Expiration time one candle from the timeframe on which you are trading You can use moving average to filter out false signals. Or escort support levels. This tool is reliable in trading.
Скрипт собирает размеры всех ценовых волн на текущем графике, которые не меньше заданной величины, и сохраняет их в CSV файл. Каждая строка таблицы будет содержать дату/время окончания волны и ее размер. Если вам нужно знать размеры волн в реальном времени, то воспользуйтесь индикатором Wave Size into ZigZag , Wave Size Histogram  или ZZ Histogram . ПАРАМЕТРЫ MinWaveSize:  минимальный размер дял волн, которые попадут в статистику PositiveValues:   true  - в файл сохраняется только размер вол
indicator for trading binary options and forex trading. The indicator does not redraw the readings. when trading binary options, testing was performed. This indicator showed the good results correct predictions. Under these conditions, the eur / usd m1 chart, when a signal appears, the transaction opens in the direction indicated by the indicator for 5 candles, then the truth is (5 minutes since in us the 1-minute chart of a candlestick is 1 minute) the result was. When trading in the forex
ROYAL DUTCH SKUNK USES THE TREND WAVE INDICATOR AND IT CAN IDENTIFY THE BEGINNING AND THE END OF A NEW WAVE TREND MOVEMENT. AS AN OSCILLATOR, THE INDICATOR IDENTIFIES THE OVERBOUGHT AND OVERSOLD ZONES. IT WORKS GREAT TO CATCH THE SHORT TERM PRICE REVERSALS AND USES A MARTINGALE STRATEGY TO CLOSE ALL TRADES IN PROFIT. USE DEFAULT SETTINGS ON H1 OR HIGHER TIME FRAME ON ANY PAIR FOR MORE ACCURATE TRADES WHY THIS EA : Smart entries calculated by 6 great strategies The EA can be run on even a $20000
This indicator is customized for binary option trading like M1 timeframe or turbo option trading. The way a binary option works is from the traders perspective is that you choose whether or not a certain underlying asset (a stock, commodity, currency etc.) is going to go up or down in a certain amount of time. You essentially bet money on this prediction. You are shown how much money up front you will earn if your prediction is correct. If your prediction is wrong, you lose your bet and the mone
このプロダクトを購入した人は以下も購入しています
まず第一に、この取引インジケーターは再描画されず、再描画されず、遅延しないことを強調する価値があります。これにより、手動取引とロボット取引の両方に理想的なものになります。 ユーザーマニュアル:設定、入力、戦略。 アトミックアナリストは、価格の強さとモメンタムを利用して市場でより良いエッジを見つけるためのPA価格アクションインジケーターです。ノイズや誤ったシグナルを除去し、取引ポテンシャルを高めるための高度なフィルターを備えています。複雑なインジケーターの複数のレイヤーを使用して、アトミックアナリストはチャートをスキャンし、複雑な数学的計算をシンプルなシグナルと色に変換します。これにより、どのような初心者トレーダーでも理解して使用し、一貫した取引の決定を行うことができます。 「アトミックアナリスト」は、新規および経験豊富なトレーダー向けにカスタマイズされた包括的な取引ソリューションです。プレミアムインジケーターとトップノッチの機能を1つの取引戦略に組み合わせ、すべてのタイプのトレーダーにとって汎用性のある選択肢にします。 デイリートレーディングとスキャルピング戦略:高
An exclusive indicator that utilizes an innovative algorithm to swiftly and accurately determine the market trend. The indicator automatically calculates opening, closing, and profit levels, providing detailed trading statistics. With these features, you can choose the most appropriate trading instrument for the current market conditions. Additionally, you can easily integrate your own arrow indicators into Scalper Inside Pro to quickly evaluate their statistics and profitability. Scalper Inside
TPSpro TREND PRO は 、市場を自動的に分析し、トレンドとその各変化に関する情報を提供し、再描画せずに取引に参加するためのシグナルを提供するトレンド指標です。 インディケータは各ローソク足を使用し、個別に分析します。さまざまなインパルス(アップまたはダウンインパルス)を指します。通貨、仮想通貨、金属、株、指数の取引への正確なエントリーポイント! バージョンMT5                   インジケーターの完全な説明   インジケーター -   RFI LEVELS と併用することをお勧めします。 主な機能: レンダリングなしで正確な入力信号! シグナルが表示された場合、それは関連性を維持します。これは、シグナルを提供してからそれを変更する可能性があり、入金時の資金の損失につながる可能性があるリドローインジケーターとの重要な違いです。より高い確率と精度で市場に参入できるようになりました。矢印が表示された後、ターゲットに達する (利益確定) か反転シグナルが表示されるまで、ローソク足を色付けする機能もあります。 STOP LOSS / TAKE PROFIT
最初のパルスレベルを反転 (RFI)     指示する     ロシア     -        utilizar con   el indicador の ESP 推奨事項 -   TPSpro トレンド プロフェッショナル版 -   MT5のバージョン 最も重要なことは、将来においても最も重要なことです。 機能のプリンシパル: ゾーンのほとんどは、ベンダーとコンプラドールによってアクティブ化されます。 状況を直感的に把握できるよう、初期の衝動を修正します。 LOGIC AI: MUESTRA zonas (círculos) parabuscar puntos de entrada cuando se activa una plantilla 視覚的に優れた視覚効果があり、最も重要な機能がすべて揃っていることに注意してください。 優れたニベレス/ゾーンの視覚化 (modo MTF) 世界で最も人気のある場所/ゾーンです。これを使用するのに最適な方法です (   TPSproTREND PRO   )。 アルゴリズム プロフェッショナル セパラド パソ ア パソ パラ オペラ それは
ご紹介   クォンタム トレンド スナイパー インジケーターは 、トレンド反転を特定して取引する方法を変革する画期的な MQL5 インジケーターです。 13年以上の取引経験を持つ経験豊富なトレーダーのチームによって開発されました。     クォンタムトレンドスナイパーインジケーター   は、非常に高い精度でトレンドの反転を識別する革新的な方法で、あなたのトレーディングの旅を新たな高みに押し上げるように設計されています。 ***Quantum Trend Sniper Indicatorを購入すると、Quantum Breakout Indicatorを無料で入手できます!*** クォンタム ブレイクアウト インジケーターは、トレンドの反転を特定するとアラートを発し、矢印を示し、3 つのテイクプロフィットレベルを提案します。 初心者トレーダーにもプロのトレーダーにも適しています。 量子EAチャネル:       ここをクリック MT5のバージョン:       ここをクリック 推奨事項: 期間: すべての時間枠。最良の結果を得るには、
今、147ドル(いくつかの更新後に499ドルに増加します) - 無制限のアカウント(PCSまたはMac) RelicusRoad ユーザー マニュアル + トレーニング ビデオ + プライベート Discord グループへのアクセス + VIP ステータス 市場の新しい見方 RelicusRoad は、外国為替、先物、暗号通貨、株式、および指数の世界で最も強力な取引インジケーターであり、トレーダーに収益を維持するために必要なすべての情報とツールを提供します。初心者から上級者まで、すべてのトレーダーが成功するためのテクニカル分析と取引計画を提供します。これは、将来の市場を予測するのに十分な情報を提供する重要な取引指標です。意味をなさないチャート上のいくつかの異なる指標ではなく、完全な解決策を信じています.これは、信号、矢印 + 価格アクション情報を表示するオールインワンのインジケーターで、他に類を見ない非常に正確です。 強力な AI に基づいて、RelicusRoad は不足している情報とツールを提供して、あなたを教育し、トレーディングのプロ、成功したトレーダーにします。
現在20%OFF! 初心者やエキスパートトレーダーのためのベストソリューション! このダッシュボードソフトウェアは、28の通貨ペアで動作しています。それは私達の主要な指標(高度な通貨の強さ28と高度な通貨インパルス)の2に基づいています。それは全体の外国為替市場の大きい概観を与えます。それは、すべての(9)時間枠で28の外国為替ペアのための高度な通貨の強さの値、通貨の動きの速度と信号を示しています。チャート上で1つのインディケータを使用して市場全体を観察し、トレンドやスキャルピングの機会をピンポイントで見つけることができたら、あなたのトレードがどのように改善されるか想像してみてください。 このインディケータには、強い通貨と弱い通貨の識別、潜在的な取引の識別と確認がより簡単になるような機能が搭載されています。このインディケータは、通貨の強さや弱さが増加しているか減少しているか、また、すべての時間枠でどのように機能しているかをグラフィカルに表示します。 新機能として、現在の市場環境の変化に適応するダイナミックなマーケットフィボナッチレベルが追加され、すでに当社のAdvan
Bomb Bank シグナル: MetaTrader 4 の信頼度インジケーター Bomb Bank Signal は、金融市場で最も関連性の高いトレンドを特定するように設計された MetaTrader 4 の強力なインジケーターです。動きを正確に予測するツールをお探しなら、Bomb Bank が最適です。 仕組み: このインジケーターは、出来高分析、ローソク足終値、対称トレンドという 3 つの異なる方法を組み合わせて、売買の機会を検出してシグナルを送ります。 Bomb Bank は、買いの機会を特定するときは「爆弾」のようなものであり、売りシグナルを検出するときは「ドクロ」のようなものです。 ボムバンクはなぜ違うのですか? 完全な信頼性: Bomb Bank Signal は信号を削除しません。一度シグナルが発せられると、シグナルは残り続けるので、チャンスを逃すことはありません。 極めて高い精度: Bomb Bank は誤った信号を送信しません。リアルタイムで最新情報を更新し、市場の進化に合わせて調整しながら、以前のシグナルの透明性を維持します。 ライブアップデ
FX Volume
Daniel Stein
4.48 (27)
mql5と Telegramの モーニング・ブリーフィングで、詳細とスクリーンショットを含む毎日のマーケット・アップデートをご覧 ください! FX Volumeは、ブローカーの視点から市場のセンチメントをリアルに洞察する、最初で唯一の出来高インジケーターです。 ブローカーのような機関投資家が外国為替市場でどのようなポジションをとっているか、COTレポートよりもはるかに速く、素晴らしい洞察を提供します。 この情報をチャート上で直接見ることは、あなたの取引にとって真のゲームチェンジャーであり、画期的なソリューションです。 以下のようなユニークなマーケットデータ洞察から利益を得てください。 比率は 、通貨のロングポジションとショートポジションの比率をパーセントで表示します。 比率の変化は 、選択した期間内のロング比率とその変化率を表示します。 Volumes Totalは 、通貨の取引量(ロングとショート)の合計をロット単位で表示します。 Volumes Long :全通貨のロングポジションの取引量を表示します。 Volumes(ショート )は、全通貨のショートポジションの取引量を表示
Best Currency Strength Indicator
Tumelo Patrick Rakotsoane
4.54 (41)
Advanced Currency Strength Indicator The Advanced Divergence Currency Strength Indicator. Not only it breaks down all 28 forex currency pairs and calculates the strength of individual currencies across all timeframes , but, You'll be analyzing the WHOLE forex market in 1 window (In just 1 minute) . This indicator is very powerful because it reveals the true movements of the market.  It is highly recommended to  analyze charts knowing the performance of individual currencies or the countries ec
製品を購入する前に、以下の情報をお読みください。 Apollo Pips PLUS SP はユニークな製品です。これは、私の新しい「アポロ ピップス」インジケーターと、私のすべての取引インジケーターにアクセスできる「スーパー パック」ボーナスを手に入れたい人のためのものです。 Apollo Pips PLUS SP 製品を購入すると、実際には私の Apollo Pips インジケーターのまったく新しいバージョンを購入することになります。このバージョンのインジケーターには改良されたアルゴリズムと使いやすいパラメーターがあり、あらゆる市場およびあらゆる取引スタイルでインジケーターを使用する機会が得られます。 この製品の購入者は、私のスーパーボーナスとして、他のすべてのインジケーターにも無料でアクセスできます!私のすべての取引ツールにアクセスしたい場合は、この製品が最適です!:) しかし、これがすべてではありません!:) この製品のすべての購入者は、私の新しいインジケーターを無料で入手する資格もあります!:)新しい取引インジケーターを利用できるようになりました。私の特権のある「スーパー パッ
現在20%OFF! 初心者やエキスパートトレーダーに最適なソリューションです。 このインディケータは、エキゾチックペア・コモディティ・インデックス・先物など、あらゆるシンボルの通貨の強さを表示することに特化したインディケータです。金、銀、原油、DAX、US30、MXN、TRY、CNHなどの通貨の強さを表示するために、9行目にどのシンボルでも追加することができます。独自の機能を多数搭載し、新しい計算式を採用したため、ユニークで高品質、かつ手頃な価格のトレーディングツールとなっています。新しいトレンドやスキャルピングチャンスのトリガーポイントを正確に把握することができるため、あなたのトレードがどのように改善されるか想像してみてください。 ユーザーマニュアル:ここをクリック   https://www.mql5.com/en/blogs/post/708876 すべての時間枠に対応します。あなたはすぐにトレンドを見ることができるようになります! 新しいアルゴリズムに基づいて設計されているため、潜在的な取引の特定と確認がより簡単になります。これは、8つの主要通貨と1つのシンボ
Gold Channel is a volatility-based indicator, developed with a specific timing algorithm for the XAUUSD pair, which consists of finding possible corrections in the market. This indicator shows two outer lines, an inner line (retracement line) and an arrow sign, where the theory of the channel is to help identify overbought and oversold conditions in the market. The market price will generally fall between the boundaries of the channel. If prices touch or move outside the channel it is a tra
Enigmera
Ivan Stefanov
5 (2)
エニグメラ:市場の中核 https://www.enigmera.com はじめに このインディケータと取引システムは、金融市場に対する驚くべきアプローチです。ENIGMERAは、フラクタルサイクルを使用して、サポートとレジスタンスレベルを正確に計算します。本格的な蓄積局面を示し、方向性と目標を示します。 トレンド中でも調整中でも機能するシステムです。 どのように作動するのか? ENIGMERAは、支持線・抵抗線、目標線、乖離線の3つのラインで構成されています。このシステムは、過去のデータを現在と未来に外挿する典型的な市場指標とは異なり、現在の完全な画像を提供します。支持線上にある場合、それは本当の支持を意味し、抵抗線上にある場合、それは本当の抵抗を意味する。ある水準が破られた場合、それはトレンドの変化を意味する。再描画はしない。 市場は常に進化しているため、ENIGMERAはその評価ツールを適応させ、定期的に戦略を修正しています。  これにより、すべてのシナリオが徹底的に評価されることが保証されます。この市場指標の独自性は、その能力を見れば明らかです。  ENIGM
PZ Day Trading
PZ TRADING SLU
3.67 (3)
このインディケータは、価格アクション分析とドンチャンチャネルのみを使用して、ジグザグ方式で価格の反転を検出します。再描画やバックペインティングを一切行わずに、短期取引向けに特別に設計されています。それは彼らの操作のタイミングを増やすことを目指している賢明なトレーダーにとって素晴らしいツールです。 [ インストールガイド | 更新ガイド | トラブルシューティング | よくある質問 | すべての製品 ] 驚くほど簡単に取引できます すべての時間枠で価値を提供します 自己分析統計を実装します 電子メール/音声/視覚アラートを実装します 可変長のブレイクアウトと混雑ゾーンに基づいて、インディケータは価格アクションのみを使用して取引を選択し、市場が非常に高速に行っていることに反応します。 過去のシグナルの潜在的な利益が表示されます この指標は、独自の品質とパフォーマンスを分析します 負けブレイクアウトは強調表示され、説明されます インジケータは、非バックペインティングおよび非再ペイントです この指標は、日中のトレーダーが単一の価格反転を見逃さないようにするのに役立ちます。ただし、す
回帰取引を意味する専門的かつ定量的なアプローチを実装する独自の指標。これは、価格が予測可能かつ測定可能な方法で迂回して平均に戻るという事実を利用しており、非定量的な取引戦略を大幅に上回る明確な出入りルールを可能にします。 [ Installation Guide | Update Guide | Troubleshooting | FAQ | All Products ] 明確な取引シグナル 驚くほど簡単に取引できます カスタマイズ可能な色とサイズ パフォーマンス統計を実装します ほとんどの取引戦略を上回ります 適切なSLおよびTPレベルを表示します 電子メール/音声/視覚アラートを実装します 使い方 インディケータは、より高い時間枠からの完全にカスタマイズ可能な移動平均の周りの標準偏差を測定し、トレンドフォローアプローチを使用して正確に取引を見つけます。取引は、現在のチャートの価格アクションに飛び込むことによって見つけられ、価格が選択したより高い時間枠から計算された平均価格帯に戻ったときに閉じられます。それがコード化される方法のために、指標は高ボラティリティと強いトレンドの
Cycle Sniper
Elmira Memish
4.38 (32)
NEW YEAR SALE PRICE FOR LIMITED TIME!!! Please contact us after your purchase and we will send you the complimentary indicators to complete the system Cycle Sniper is not a holy grail but when you use it in a system which is explained in the videos, you will feel the difference. If you are not willing to focus on the charts designed with Cycle Sniper and other free tools we provide, we recommend not buying this indicator. We recommend watching the videos about the indiactor and system before pu
このインディケータは、当社の2つの製品 Advanced Currency IMPULSE with ALERT  +   Currency Strength Exotics . のスーパーコンビネーションです。 このインジケーターは全ての時間枠で作動し、8つの主要通貨と1つのシンボルの強弱のインパルスをグラフで表示します。 このインジケータは、金、エキゾチックペア、商品、インデックス、先物など、あらゆるシンボルの通貨強度の加速度を表示することに特化されています。金、銀、原油、DAX、US30、MXN、TRY、CNHなどの通貨強度の加速度(インパルスまたは速度)を表示するために、任意のシンボルを9行目に追加できる、この種の最初のものです。 新しいアルゴリズムに基づいて構築され、潜在的な取引の特定と確認がさらに容易になりました。これは、通貨の強さや弱さが加速しているかどうかをグラフィカルに表示し、その加速の速度を測定するためです。加速すると物事は明らかに速く進みますが、これはFX市場でも同じです。つまり、反対方向に加速している通貨をペアリングすれば、潜在的に利益を生む取
30% DISCOUNT ! DISCOUNT ! DISCOUNT ONLY FOR 5 USERS at125$ valid for 1 day only.Grab it The PERFECT TREND HIT creates   BUY and SELL  perfect trend   arrow signals based on ADX EMA AND RSI And all filters inbuilt with accurate trend entries. Furthermore, the indicator and template display the trend direction, strength, and trade recommendation for independent price charts. ROCK WITH THE TREND Moreover, it shows the final trade recommendation to BUY or SELL with all filters and displays that info
Step into the realm of Forex trading with confidence and precision using XQ, a cutting-edge Forex indicator designed to elevate your trading game to unprecedented heights. Whether you're a seasoned trader or just stepping into the world of currency exchange,   XQ Forex Indicator   empowers you with the insights and signals needed to make informed trading decisions. The signal conditions are a combination of three indicators, and XQ Forex Indicator only display  medium and long-term trends . The
これはMT4のインジケーターで、再描画なしで取引に参入するための正確なシグナルを提供します。 外国為替、暗号通貨、金属、株式、インデックスなど、あらゆる金融資産に適用できます。かなり正確な見積もりを提供し、取引を開始して終了するのに最適な時期を教えてくれます。1つのシグナルを処理しただけでインジケーターの元が取れた例の 動画 (6:22)をご覧ください。Entry PointsPro インジケーターの助けを借りたほとんどのトレーダーの最初の1週間の結果が改善しています。 Telegramグループ に登録してください。Entry Points Proインジケーターのメリットは次の通りです。 再描画のないエントリーシグナル 再描画されるインジケーターでは一度表示されたシグナルが削除されて大きな金銭的損失につながることがありますが、これと異なり、表示されて確認されたシグナルは消えることがありません。 エラーなしの取引開始 インジケーターアルゴリズムによって取引を開始する(資産を売買する)理想的な瞬間を見つけることができます。それを使用するすべてのトレーダーの成功率が向上します。
ECM Elite Channel is a volatility-based indicator, developed with a specific time algorithm, which consists of finding possible corrections in the market. This indicator shows two outer lines, an inner line (retracement line) and an arrow sign, where the channel theory is to help identify overbought and oversold conditions in the market. The market price will generally fall between the boundaries of the channel. If prices touch or move outside the channel, it's a trading opportunity. The
NAM Order Blocks
NAM TECH GROUP, CORP.
5 (1)
MT4マルチタイムフレームオーダーブロック検出インジケーター。 特徴 -チャートコントロールパネルで完全にカスタマイズ可能で、完全な相互作用を提供します。 -必要な場所でコントロールパネルを表示および非表示にします。 -複数の時間枠でOBを検出します。 -表示するOBの数量を選択します。 -さまざまなOBユーザーインターフェイス。 -OBのさまざまなフィルター。 -OB近接アラート。 -ADRの高線と低線。 -通知サービス(画面アラート|プッシュ通知)。 概要 注文ブロックは、金融機関や銀行からの注文収集を示す市場行動です。著名な金融機関と中央銀行が外国為替市場を牽引しています。したがって、トレーダーは市場で何をしているのかを知る必要があります。市場が注文ブロックを構築するとき、それは投資決定のほとんどが行われる範囲のように動きます。 注文の構築が完了すると、市場は上向きと下向きの両方に向かって急激に動きます。注文ブロック取引戦略の重要な用語は、機関投資家が行っていることを含むことです。それらは主要な価格ドライバーであるため、機関投
MT My Way
Issara Seeboonrueang
Best strategy,  Easy trade ,  Support of version update in the future MT My Way:  For new traders with no experience It is a very simple trade. Open the order when there is signal and close the order when there is exit or found the next opposite signal. You can set Stop Loss at the arrow and set the distance at Arrow Gap. For experienced traders, It will be very easy to trade. indicator for trade by yourself TRADE: Forex  TIME FRAME:  All Time Frame (Not M1) SYMBOL PAIR: All Sy
フルSTOインジケータ(3つのSTOインジケータのすべてのバージョンを含む:プレミアム、ゴールド、シルバー) - STABLE TRADE OPTIONは、自動バイナリーオプション取引のために設計されています。 注意深くお読みください! 重要 1つのターミナルで、異なる有効期限を持つ2つのテンプレートを作成します。18:01、18:02のテンプレートは有効期限が1~15分、22:00のテンプレートは有効期限が10~20分です。 勝率:過去5年間で71 資金管理: 預金から0.3 このバージョンのインジケータは、モスクワ時間18:01、18:02、22:00の取引にのみ設定され、有効期限は銀と金が1~15分、プレミアムバージョンは10~20分です。シグナルはローソク足の内側に表示され、すぐに取引を開始します。 インジケータは完全に設定されているので、自分で何かを変更する必要はありません。インストールして取引してください! 実際の口座でstoの全バージョンをチェックし、結果を確認するのに2年以上かかりました。長年のテストの結果、最適なパラメータが選択さ
Super Scalp Indicator MT4    is a unique  trend reversal  100% non-repainting  multi-algo indicator that can be used on all symbols/instruments:   forex,   commodities,   cryptocurrencies,   indices,   stocks .    Super Scalp Indicator MT4    will determine the current trend at its early stages, gathering information and data from up to 10 standard algos When indicator give a valid buy or sell signal, a corresponding arrow will be printed on the chart, open trade at start of the next candle/bar
トレンドトレーディング は、タイミングのプルバックとブレイクアウトにより、市場で起こっているトレンドから可能な限り利益を得るように設計された指標です。確立されたトレンドの中で価格が何をしているかを分析することにより、取引の機会を見つけます。 [ インストールガイド | 更新ガイド | トラブルシューティング | よくある質問 | すべての製品 ] 自信を持って効率的に金融市場を取引する むち打ちにならずに確立されたトレンドから利益を得る 収益性の高いプルバック、ブレイクアウト、早期の逆転を認識する この指標は、独自の品質とパフォーマンスを分析します 複数時間枠のダッシュボードを実装します インジケーターは再描画されていません 電子メール/音声/視覚アラートを実装します 確立されたトレンドは多くの取引機会を提供しますが、ほとんどのトレンド指標はそれらを完全に無視しています。インジケーターの解釈はかなり簡単です: (1) トレンドの変化 (2) トレンドの方向への後退 (3) トレンドの方向へのブレイクアウト 赤いダッシュ は下降トレンド中の修正です 青いダッシュ は上昇ト
The AT Forex Indicator MT4 is a sophisticated trading tool designed to provide traders with a comprehensive analysis of multiple currency pairs. This   powerful indicator   simplifies the complex nature of the forex market, making it accessible for both novice and experienced traders. AT Forex Indicator uses   advanced algorithms   to detect trends, patterns and is an essential tool for traders aiming to enhance their forex trading performance. With its robust features, ease of use, and reliabl
How to use Pair Trading Station Pair Trading Station is recommended for H1 time frame and you can use it for any currency pairs. To generate buy and sell signal, follow few steps below to apply Pair Trading Station to your MetaTrader terminal. When you load Pair Trading Station on your chart, Pair Trading station will assess available historical data in your MetaTrader platforms for each currency pair. On your chart, the amount of historical data available will be displayed for each currency pai
TPA True Price Action indicator reveals the true price action of the market makers through 100% non-repainting signals (except early signals mode) strictly at the close of a candle! TPA shows entries and re-entries, every time the bulls are definitely stronger than the bears and vice versa. Not to confuse with red/green candles. The shift of power gets confirmed at the earliest stage and is ONE exit strategy of several. There are available now two free parts of the TPA User Guide for our custo
作者のその他のプロダクト
トレンド スクリーナー インジケーターでトレンド取引の力を解き放ちます。ファジー ロジックと複数通貨システムを活用した究極のトレンド取引ソリューションです。 ファジー ロジックを活用した革新的なトレンド インジケーターである Trend Screener を使用して、トレンド取引を向上させます。 これは、13 を超えるプレミアム ツールと機能、および 3 つの取引戦略を組み合わせた強力なトレンド追跡インジケーターであり、Metatrader をトレンド アナライザーにする多用途の選択肢となります。 期間限定オファー : トレンド スクリーナー インジケーターは、わずか 50 ドルで生涯ご利用いただけます。 (元の価格 125$ ) (オファー延長) Trend Screener の 100% 非再描画精度の揺るぎない精度を体験して、取引の決定が過去の価格変動の影響を受けないようにしてください。 マルチタイムフレームおよびマルチ通貨機能の多用途性を解放し、比類のない自信を持って外国為替、商品、暗号通貨、インデックスの世界を取引できるようにします。 Trend Screener の包括的な
サポートとレジスタンススクリーナーは、1つのインジケーター内に複数のツールを提供するMetaTraderの1つのレベルインジケーターにあります。 利用可能なツールは次のとおりです。 1.市場構造スクリーナー。 2.強気のプルバックゾーン。 3.弱気プルバックゾーン。 4.デイリーピボットポイント 5.毎週のピボットポイント 6.毎月のピボットポイント 7.ハーモニックパターンとボリュームに基づく強力なサポートとレジスタンス。 8.銀行レベルのゾーン。 期間限定オファー:HVサポートおよびレジスタンスインジケーターは、50ドルと生涯でのみご利用いただけます。 (元の価格125 $) MQL5ブログにアクセスすると、分析例を含むすべてのプレミアム指標を見つけることができます。 ここをクリックしてください。 主な機能 ハーモニックおよびボリュームアルゴリズムに基づく強力なサポートおよびレジスタンスゾーン。 ハーモニックおよびボリュームアルゴリズムに基づく強気および弱気のプルバックゾーン。  市場構造スクリーナー 毎日、毎週、毎月のピボットポイント。 ドキュメント すべてのサ
サポートとレジスタンススクリーナーは、1つのインジケーター内に複数のツールを提供するMetaTraderの1つのレベルインジケーターにあります。 利用可能なツールは次のとおりです。 1.市場構造スクリーナー。 2.強気のプルバックゾーン。 3.弱気プルバックゾーン。 4.デイリーピボットポイント 5.毎週のピボットポイント 6.毎月のピボットポイント 7.ハーモニックパターンとボリュームに基づく強力なサポートとレジスタンス。 8.銀行レベルのゾーン。 期間限定オファー:HVサポートおよびレジスタンスインジケーターは、50ドルと生涯でのみご利用いただけます。 (元の価格125 $) Metatrader Backtesterの制限なしでインジケーターを試してみませんか? デモ版をダウンロードするには、ここをクリックしてください。 主な機能     ハーモニックおよびボリュームアルゴリズムに基づく強力なサポートおよびレジスタンスゾーン。     ハーモニックおよびボリュームアルゴリズムに基づく強気および弱気のプルバックゾーン。     市場構造スクリーナー     毎日
トレンドラインマップインジケーターは、トレンドスクリーナーインジケーターのアドオンです。トレンドスクリーナー(トレンドラインシグナル)によって生成されたすべてのシグナルのスキャナーとして機能します。 これは、トレンドスクリーナーインジケーターに基づくトレンドラインスキャナーです。 Trend Screener Pro インジケーターがない場合、Trend Line Map Proは機能しません。 It's a Trend Line Scanner based on Trend Screener Indicator. If you don't have Trend Screener Pro Indicator,     the Trend Line Map Pro will not work . ブログにアクセスすると、トレンドラインマップインジケーターの無料バージョンをダウンロードできます。 Metatrader Testerの制限なしで、購入する前に試してみてください。 :  ここをクリック 1.簡単になる利点 通貨と時間枠に基づいて売買シグナルを表示し
平均日次範囲は、特定の期間にわたって測定された外国為替ペアの平均ピップ範囲を示します。トレーダーはADRを使用して、平均的な1日の動き以外の潜在的な価格行動を視覚化できます。 ADRが平均を上回っている場合、それは毎日のボラティリティが通常よりも高いことを意味します。これは、通貨ペアがその基準を超えて拡大している可能性があることを意味します。 ADRアナライザーは5つの主要な機能で構成されています。 範囲(ADR)スクリーナー:複数通貨のADR分析。 ADRゾーン:ADRゾーンの価格ブームの外で日中に予想される市場範囲を示します。 Xバーゾーン:ユーザーが指定したXバーのX量のブレークを表示します。 毎日の高および低ゾーン:前日の高レベルまたは低レベルの休憩を識別します。 ウィークリーハイゾーンとローゾーン:週の休憩日ハイレベルまたはローレベルを識別します。 期間限定オファー:レンジアナライザーインジケーターは、50ドルと寿命でのみご利用いただけます。 (元の価格125 $) 主な機能 マルチ通貨スクリーナー。 ADRゾーンブレイクアウト すべてのタイプのアラート(ポップ
私たちのサポートまたはレジスタンスレベルは、市場の価格行動が逆転して方向を変え、市場にピークまたはトラフ(スイングポイント)を残したときに形成されます。サポートとレジスタンスのレベルは、取引範囲を切り開くことができます。インジケーターは、インジケーターセットで定義されたバーのX量(期間)に基づいて、スイングハイとスイングローを識別します。 注:価格アクションインジケーターが気に入った場合は、オールインワントレンドインジケーター(トレンドスクリーナー、トレンドライン、ストロングトレンド、トレンドリバーサルシグナルなど)をお試しください。 入手するには、 ここをクリックしてください 主な機能 テクニカル分析の重要な概念は、抵抗またはサポートレベルが破られると、その役割が逆転することです。価格がサポートレベルを下回ると、そのレベルは抵抗力があります。価格が抵抗レベルを超えて上昇した場合、それはしばしばサポートになります。 水平方向のサポートと抵抗のレベルは、これらのレベルの最も基本的なタイプです。それらは単に水平線で識別されます: チャートの緑のレベルは、抵抗レベルです。 チャート
FREE
ブームおよびクラッシュスパイク検出器インジケーターは、主に価格のブームおよびクラッシュを検出するための高度な戦略に基づいてコーディングされています。 価格の高確率のブームとクラッシュを検出するために、複雑なアルゴリズムが組み込まれました。 ブームまたはクラッシュフェーズの可能性について警告します。 ブームフェーズ:価格の上昇が速すぎる場合。 クラッシュフェーズ:価格の低下が速すぎる場合。 期間限定オファー:インジケーターは30ドルと生涯でのみご利用いただけます。 主な機能 プッシュ通知を携帯電話に送信します コンピューターまたはラップトップでポップアップしてアラートを鳴らします 再描画されない矢印を表示します(潜在的なブームの場合は上向きの矢印、潜在的なクラッシュの場合は下向きの矢印) すべてのペアでの作業。 おすすめ 時間枠:H1およびH4 ペアの推奨:トレンドフェーズのペア。 コンタクト ご不明な点がある場合やサポートが必要な場合は、プライベートメッセージでご連絡ください。 著者 SAYADI ACHREF、fintechソフトウェアエンジニアお
トレンドラインマップインジケーターは、トレンドスクリーナーインジケーターのアドオンです。トレンドスクリーナー(トレンドラインシグナル)によって生成されたすべてのシグナルのスキャナーとして機能します。 これは、トレンドスクリーナーインジケーターに基づくトレンドラインスキャナーです。 Trend Screener Pro インジケーターがない場合、Trend Line Map Proは機能しません。 ブログにアクセスすると、トレンドラインマップインジケーターの無料バージョンをダウンロードできます。 Metatrader Testerの制限なしで、購入する前に試してみてください。 :    ここをクリック 1.簡単になる利点 通貨と時間枠に基づいて売買シグナルを表示します。 チャートに矢印が表示されてから価格が増減したピップ数を評価します。 (トレンドスクリーナーインジケーター矢印) 信号のタイミングを表示します。 アラートを売買するための複数の時間枠と複数の通貨のアラートを取得します。 2.トレンドラインマップの使用方法 売買シグナルダッシュボードを表示す
すべてのトレーダーは、1 回の取引で 5% (または 7%) を超えるリスクを負ってはならないことを知っています。これはマネー管理の法則であり、トレーダーは異なる取引レベルに対して異なるストップロス値を使用する必要があるため、使用可能な LotSize を毎回計算する必要があります。このインディケータは、チャートに配置する瞬間に適切な LotSize を計算し、「ストップ ロス ライン」を任意の方向にドラッグするたびに計算します。 期間限定オファー: すべてのプレミアム インジケーターはわずか 50$ で利用できます。MQL5 ブログにアクセスすると、プレミアム インジケーターのすべての詳細を確認できます。ここをクリック。 入力 MAX_RISK_PER_TRADE - トレーダーがトレードごとにリスクを負うパーセンテージ。 CUSTOM_BALANCE - リスクの計算に使用される金額を定義します。 0 => 電卓は口座残高を使用します。 ENTRY_PRICE_LINE_COLOR - TP (テイクプロフィット) ラインの色 STOP_PRICE_LINE_COLO
ブームおよびクラッシュスパイク検出器インジケーターは、主に価格のブームおよびクラッシュを検出するための高度な戦略に基づいてコーディングされています。 価格の高確率のブームとクラッシュを検出するために、複雑なアルゴリズムが組み込まれました。 ブームまたはクラッシュフェーズの可能性について警告します。 ブームフェーズ:価格の上昇が速すぎる場合。 クラッシュフェーズ:価格の低下が速すぎる場合。 期間限定オファー:インジケーターは30ドルと生涯でのみご利用いただけます。 主な機能 プッシュ通知を携帯電話に送信します コンピューターまたはラップトップでポップアップしてアラートを鳴らします 再描画されない矢印を表示します(潜在的なブームの場合は上向きの矢印、潜在的なクラッシュの場合は下向きの矢印) すべてのペアでの作業。 おすすめ 時間枠:H1およびH4 ペアの推奨:トレンドフェーズのペア。 コンタクト ご不明な点がある場合やサポートが必要な場合は、プライベートメッセージでご連絡ください。 著者 SAYADI ACHREF、fintechソフトウェアエンジニアお
通貨強度メーターは、現在どの通貨が強いか、どの通貨が弱いかをすばやく視覚的にガイドします。 メーターは、すべての外国為替クロスペアの強度を測定し、それらに計算を適用して、個々の通貨の全体的な強度を決定します。 28ペアのトレンドに基づいて通貨の強さに基づいて計算します。 MQL5ブログにアクセスすると、インジケーターの無料バージョンをダウンロードできます。 Metatrader Testerの制限なしで、購入する前に試してみてください: ここをクリック 1.ドキュメント すべてのトレンド通貨強度のドキュメント(手順)と戦略の詳細は、MQL5ブログのこの投稿で入手できます: ここをクリックしてください。 2.お問い合わせ ご不明な点がある場合やサポートが必要な場合は、プライベートメッセージでご連絡ください。 3.作成者 SAYADI ACHREF、フィンテックソフトウェアエンジニア、Finansyaの創設者。
すべてのトレーダーは、1 回の取引で 5% (または 7%) を超えるリスクを負ってはならないことを知っています。これはマネー管理の法則であり、トレーダーは異なる取引レベルに対して異なるストップロス値を使用する必要があるため、使用可能な LotSize を毎回計算する必要があります。このインディケータは、チャートに配置する瞬間に適切な LotSize を計算し、「ストップ ロス ライン」を任意の方向にドラッグするたびに計算します。 期間限定オファー: すべてのプレミアム インジケーターはわずか 50$ で利用できます。MQL5 ブログにアクセスすると、プレミアム インジケーターのすべての詳細を確認できます。ここをクリック。 入力 MAX_RISK_PER_TRADE - トレーダーがトレードごとにリスクを負うパーセンテージ。 CUSTOM_BALANCE - リスクの計算に使用される金額を定義します。 0 => 電卓は口座残高を使用します。 ENTRY_PRICE_LINE_COLOR - TP (テイクプロフィット) ラインの色 STOP_PRICE_LINE_COLO
ボラティリティ アナライザーはモメンタム インジケーターであり、タイトな取引範囲での値固め後に価格が大きく上昇する傾向を利用します。このインジケーターは、スクイーズが発火したときの動きの予想される方向を示すために、運動量オシレーターも使用します。このヒストグラムはゼロ ラインの周りで振動し、ゼロ ラインより上のモメンタムの増加はロングを購入する機会を示し、ゼロ ラインを下回るモメンタムはショートの機会を示す可能性があります。 期間限定オファー : インジケーターは、わずか 50 $ で無期限でご利用いただけます。 ( 元の価格 125$ ) 主な機能 横向きトレンド検出器。 低揮発性検出器。 強気の高値と弱気の高値のボラティリティ検出器。 すべての時間枠とすべてのペアで作業します。 ポップアップ アラートとプッシュ通知アラートを提供します。 コンタクト 質問がある場合、またはサポートが必要な場合は、プライベート メッセージでご連絡ください。 警告 すべてのインジケーターとツールは、公式のメタトレーダー ストア (MQL5 マーケット) からのみ入手できます
平均日次範囲は、特定の期間にわたって測定された外国為替ペアの平均ピップ範囲を示します。トレーダーはADRを使用して、平均的な1日の動き以外の潜在的な価格行動を視覚化できます。 ADRが平均を上回っている場合、それは毎日のボラティリティが通常よりも高いことを意味します。これは、通貨ペアがその基準を超えて拡大している可能性があることを意味します。 ADRアナライザーは5つの主要な機能で構成されています。 範囲(ADR)スクリーナー:複数通貨のADR分析。 ADRゾーン:ADRゾーンの価格ブームの外で日中に予想される市場範囲を示します。 Xバーゾーン:ユーザーが指定したXバーのX量のブレークを表示します。 毎日の高および低ゾーン:前日の高レベルまたは低レベルの休憩を識別します。 ウィークリーハイゾーンとローゾーン:週の休憩日ハイレベルまたはローレベルを識別します。 期間限定オファー:レンジアナライザーインジケーターは、50ドルと寿命でのみご利用いただけます。 (元の価格125 $) 主な機能 マルチ通貨スクリーナー。 ADRゾーンブレイクアウト すべてのタイプのアラート(ポップ
ボラティリティ アナライザーはモメンタム インジケーターであり、タイトな取引範囲での値固め後に価格が大きく上昇する傾向を利用します。このインジケーターは、スクイーズが発火したときの動きの予想される方向を示すために、運動量オシレーターも使用します。このヒストグラムはゼロ ラインの周りで振動し、ゼロ ラインより上のモメンタムの増加はロングを購入する機会を示し、ゼロ ラインを下回るモメンタムはショートの機会を示す可能性があります。 期間限定オファー : インジケーターは、わずか 50 $ で無期限でご利用いただけます。 ( 元の価格 125$ ) 主な機能 横向きトレンド検出器。 低揮発性検出器。 強気の高値と弱気の高値のボラティリティ検出器。 すべての時間枠とすべてのペアで作業します。 ポップアップ アラートとプッシュ通知アラートを提供します。 コンタクト 質問がある場合、またはサポートが必要な場合は、プライベート メッセージでご連絡ください。 警告 すべてのインジケーターとツールは、公式のメタトレーダー ストア (MQL5 マーケット) からのみ入手できます
フィルタ:
waqarqureshi1
57
waqarqureshi1 2024.08.05 14:25 
 

Amazing

STE S.S.COMPANY
288645
開発者からの返信 Sayadi Achraf 2024.08.05 15:03
Thank you for taking the time to write your review, sir. My customer satisfaction is always our top priority.
Nagib Mahfuj Nayem
37
Nagib Mahfuj Nayem 2024.08.02 18:27 
 

This is really Insane. I just used only one week but more than 500 pips made with this indicator with only GOLD. And his support is really top notch. 100% Recommended.

STE S.S.COMPANY
288645
開発者からの返信 Sayadi Achraf 2024.08.02 18:29
Hi Mr. Nayem, Thank you for taking the time to write your review of our trend indicator. Since 2020, we have been committed to offering the best trend indicator for our customers, making MetaTrader a true trend analyzer. Wishing you good and safe trading!
Gimel Abayon Roda
334
Gimel Abayon Roda 2024.07.16 07:07 
 

I have been using this indicator to analyze the market trend. The dashboard is very useful in identifying the overall market direction. The CSM trend is useful in identifying the strong, weak and ranging currencies. I am using this in 15min timeframe. Though not recommended by the seller to use it in timeframes lower than 30mins, the indicator can still help generate positive pips, especially when you use it with support and resistance indicator.

STE S.S.COMPANY
288645
開発者からの返信 Sayadi Achraf 2024.07.16 12:20
Thank you for taking the time to write your review MR. Gimel. Since 2020, we have been working hard to keep improving our indicator to offer our customers the best indicator in the market to analyze market trends via many features. I invite you to check the list of all our free and premium indicators here: https://www.mql5.com/en/users/sayadi_lancer/seller
sami57
119
sami57 2024.07.08 23:04 
 

this is the best indicator i use

STE S.S.COMPANY
288645
開発者からの返信 Sayadi Achraf 2024.07.10 13:32
Thank you for taking the time to write your review MR. Sami. We are here to offer all the necessary support for our customers. Since 2020, we have been working hard to keep improving our indicator to offer our customers the best indicator in the market to analyze market trends via many features. I invite you to check all the list of all our free and premium indicators here : https://www.mql5.com/en/users/sayadi_lancer/seller
fatambouzid
47
fatambouzid 2024.05.16 01:35 
 

This is one of the best indicators I have seen ! Multitimeframe trend analysis for selected currency pairs, with a clear trend summary information; currency strength information, plus a trend simulator so you can verify and set your expectations right in terms of TP that is proven by historical signals and success rate statistics, etc. I am using both MT5 and MT4 versions of the indicator as the main signal source for all my trades with a very high success rate for a a week now. From one single chart I have clear visibility to the current market conditions.

Leroy Pastran
310
Leroy Pastran 2024.05.15 18:57 
 

Great HTF Trend Tool! Thanks for creating this system!

Erik
169
Erik 2024.03.25 10:10 
 

I haven't tested the indicator properly yet. But I give 3 stars for the great support. My questions were answered in a short time. Problems were solved quickly. Excellent. The indicator itself only gave me losses.

STE S.S.COMPANY
288645
開発者からの返信 Sayadi Achraf 2024.04.15 02:33
Thank you for taking the time to write your review MR. Erik. We are here to offer all the necessary support for our customers. Since 2020, we have been working hard to keep improving our indicator to offer our customers the best indicator in the market to analyze market trends via many features. I invite you to check all the list of all our free and premium indicators here : https://www.mql5.com/en/users/sayadi_lancer/seller
zakim1984
44
zakim1984 2024.03.19 02:44 
 

I'm using trend screener since a couple of months both MT4 and MT5 versions and its really a great indicator! The author also is very responsive and helpful..

STE S.S.COMPANY
288645
開発者からの返信 Sayadi Achraf 2024.03.19 02:48
Thank you so much sir , for your honest review and your kind words! You dont know how happy i am really you made my day! I wish you more success in your trading! The Trend Screener is the best All-In-One Trend Indicator ! I am really glad that i help and that I could bring some positivity in you trading in general! thank you so much again!
tunsam61
32
tunsam61 2024.03.19 02:01 
 

The trend screener is one of the best indicators in the market if followed correctly. I've had the indicator for 3 days and has greatly helped my ability to predict the market. The developer has excellent customer support and always willing to go extra mile to satisfy his customers and answer any questions. I will recommend this product for anyone who is interested in making money from the financial market.

STE S.S.COMPANY
288645
開発者からの返信 Sayadi Achraf 2024.03.19 02:58
Hi sir, Thank you for taking time to write your review. If you see the trend summary always Up Trend it means that you're MT4 is missing historical data. The trend summary will not give up trend for 15 instruments always. There is something wrong with the installation. I'm sending you now a private message asap to check this issue with you and assisting you to fix it and explain to you the best way to use trend screener indicator because you need to use the trend line for short terms trend and trend summary, just as a filter.
———————
Update: Can you check your private message please? I just sent you a message to assist you from there and ensure that you don’t get confused. Please let me know your feedback sir.
19990228
34
19990228 2024.02.22 14:02 
 

ユーザーは評価に対して何もコメントを残しませんでした

STE S.S.COMPANY
288645
開発者からの返信 Sayadi Achraf 2024.02.22 14:13
Hi sir, Thank you for your review. I'm happy to know that you found our indicator an excellent Smart trend indicator that can assist you in analyzing the Properly market trend and improving your trade accuracy. I'm sending you now a private message to assist you from there.
burnoutnorthbowl1
55
burnoutnorthbowl1 2024.01.22 21:33 
 

I purchased this indicator only a few days ago and I can already tell it is very powerful if used correctly. Now I am going to get the map add on.

STE S.S.COMPANY
288645
開発者からの返信 Sayadi Achraf 2024.01.25 21:19
Thank you soo much for the honest review and the kind words.
We are working day and night to create the best advanced and professional tools in the market. That's the goal here and we can get there only if our standards are held high and professional as well!
Please have a good and safe trading.
DanyLbc747
875
DanyLbc747 2024.01.18 13:08 
 

I purchased Trend Screener based on reviews. I was a bit skeptical. Ultimately, this is by far the most used product I have ever used. The first month I tested it on a demo and today it's been more than 1.5 months that I've been using it daily on a live account. I wasn't as profitable before as I am now. I like to test other products as well, but this one captivated me already during the demo testing. The uniqueness is such that each trader will find his own way according to his style, whether it is scalping, day or swing trading. In essence, only this product is enough for you and you are taken care of. The author is very helpful. After the purchase, I also had a video call with him, where he explained the important steps. The author is above all human-friendly. Thank you for this product and a job well done by the author and his team.

STE S.S.COMPANY
288645
開発者からの返信 Sayadi Achraf 2024.01.18 16:55
Thank you for taking the time to write your review, sir. I'm doing my best to offer the best analytics tools for my customers. My customer's satisfaction is always my top priority. Have a good and safe trading, sir.
Victor L
63
Victor L 2024.01.11 17:23 
 

A wonderful discovery. This tool indicator offers multiple feedback features to alert how the market is moving and enables probable actions one could take. The continuous process instills confidence. The 1x1 service support from Sayadi surely makes it better.

Iulius65
152
Iulius65 2024.01.04 18:21 
 

I bought this amazing indicator three days ago, in this moment I just study how can I better use this tool. I intuit that after I discover how to use it, will have good return in manual trading. From now I am very enthusiastic.

smallwood1988
64
smallwood1988 2023.12.29 16:37 
 

Amazing Indicator, Author so helpfull and understanding. Worth the purchase

STE S.S.COMPANY
288645
開発者からの返信 Sayadi Achraf 2023.12.29 17:14
Thank you for taking the time to write your review. I'm happy to know that you found our indicator a good indicator to use during your trading and analyzing market trends with our smart scanner. -- Please have a good and safe trading.
SUYANTO_SE
162
SUYANTO_SE 2023.12.27 16:20 
 

Excellent product and prompt support. Highly recommend to have this indicator c/w Trend Line Map Indicator. Thank you very much Mr. Sayadi

hari2007
19
hari2007 2023.12.22 11:15 
 

Everything is good but wanted to check will this indicator works in autotrading using mt2trading and mx2trading for binary trading does it takes trades automatically following trendscreener indicator what are settings i need to do please help

STE S.S.COMPANY
288645
開発者からの返信 Sayadi Achraf 2023.12.22 12:14
Hi sir, Thank you for taking the time to write your review. I'm happy to know that you find our trend indicator as a good indicator to use it in your daily trading and analyzing market trends.
---
I'm sending a PM to check more details about what you want to achieve exactly.
Ferdinand Amahan
123
Ferdinand Amahan 2023.12.17 23:57 
 

One of the best TREND INDICATOR in the market. Highly recommended for seasoned and newbie alike..

Syed Nazer Abbas Rizvi
322
Syed Nazer Abbas Rizvi 2023.11.29 16:03 
 

30m , 1H and 4H are very strong signals using Trend Screener, very useful and profitable.

STE S.S.COMPANY
288645
開発者からの返信 Sayadi Achraf 2023.11.29 16:41
We are incredibly grateful for your review and sharing your trading exprience. Your feedback is invaluable as we strive to craft the most advanced and professional trend indicator in the market. This is our unwavering goal, and we can only achieve it by maintaining the highest standards of professionalism and give the best support for our customers. Have a good and safe trading,sir.
Mark Vaines
1821
Mark Vaines 2023.11.24 02:39 
 

useful

STE S.S.COMPANY
288645
開発者からの返信 Sayadi Achraf 2023.11.24 10:29
Thank you so much for your review! I'm happy to know that you find our indicator as a useful trend indicator. The main purpose of offering more than 13 premiums tools and features is to make our indicator useful as much as possible for customers and assist them in analyzing market trends properly..
レビューに返信
バージョン 21.10 2024.06.03
1. Improve signal quality.
2. Add Trend line period.
バージョン 20.10 2023.11.29
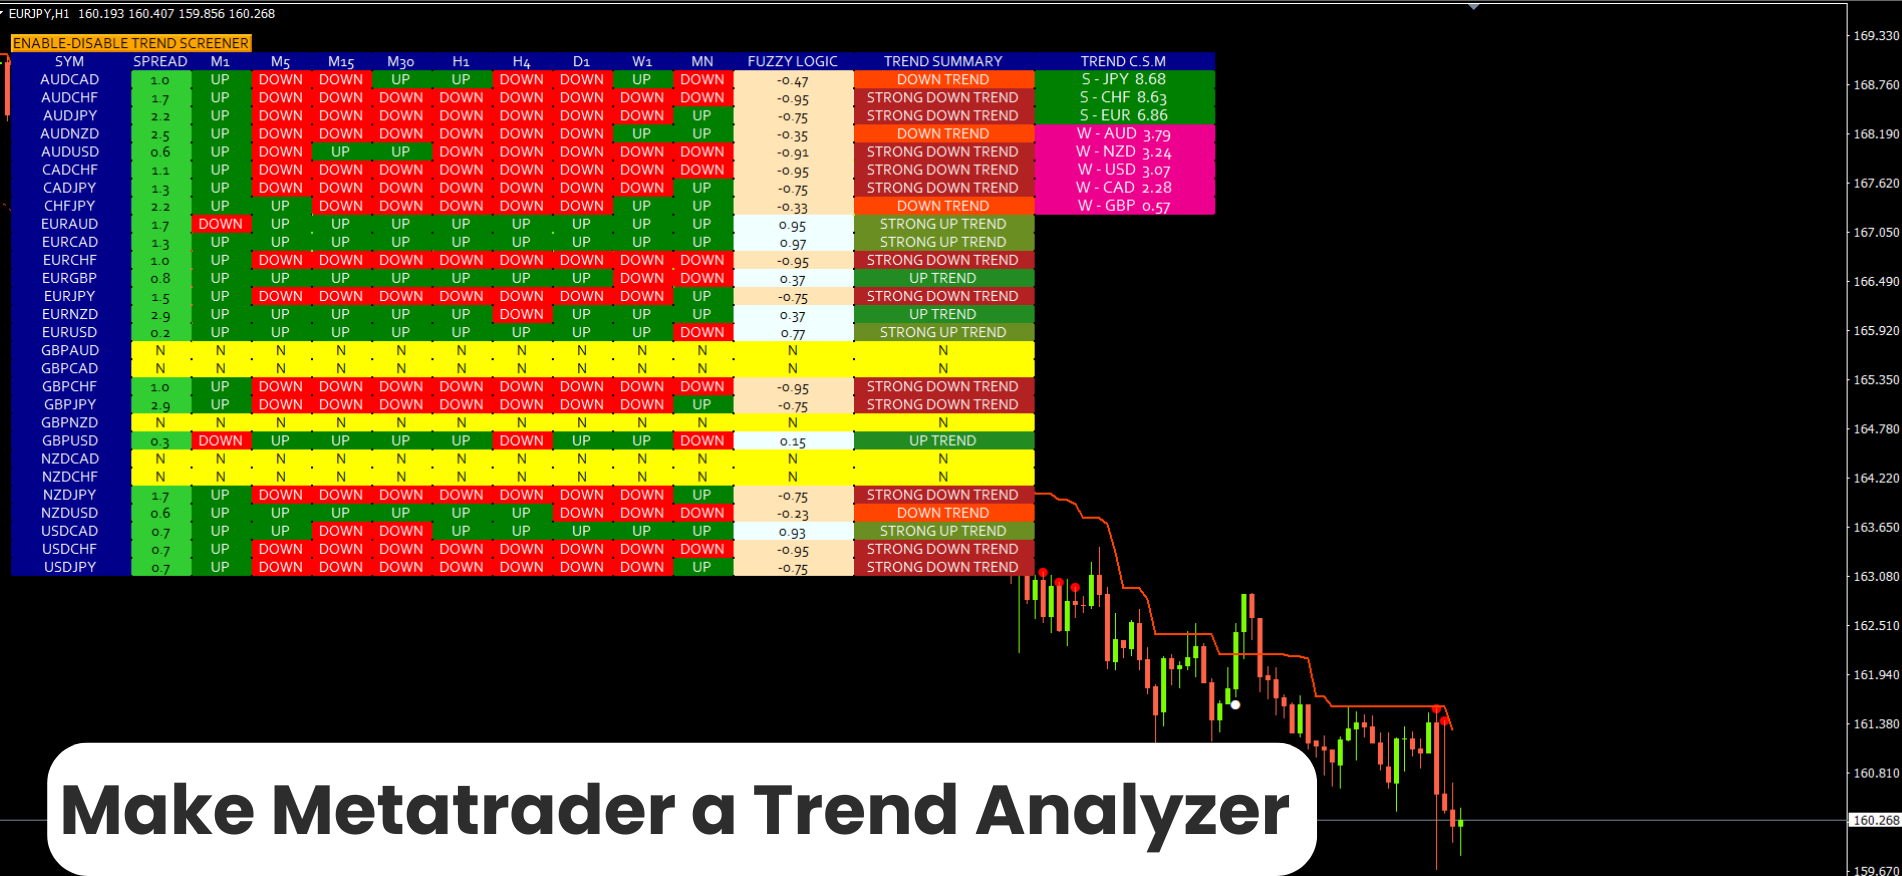
1. Change the Trend Scanner Layout by giving more flexibility in configuration to hide and display every column.
2. Add inputs to change timeframes for every column.
3. Optimize Trend breakout alerts and trend reversal alerts.
4. Add a period for the scanner to be adjusted for faster or slower trend calculation.
5. Change trend lines layout.
6. Optimize indicator setting.
7. Increase Scanner speed.
バージョン 19.21 2023.05.29
1. Fixing Spelling mistakes.
バージョン 19.20 2023.05.26
1. Optimize indicator speed.
2. Improve Trend CSM algorithm.
3. Improve Trend reversals dots.
4. Improve Strong Trend dots.
バージョン 19.3 2022.12.06
1. Improve indicator Speed for calculation with missing data.
バージョン 19.0 2021.08.29
1. Updating Alerts.
バージョン 18.1 2021.08.27
1. Adjusting signals design.
バージョン 18.0 2021.08.27
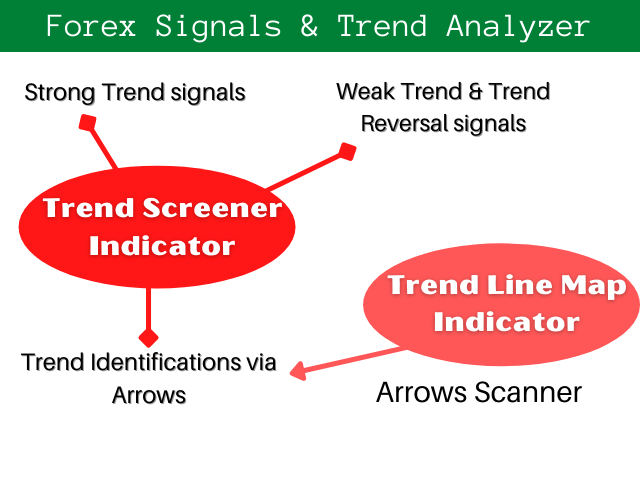
1. Add Strong Trend Signals.
2. Add Reversal Trend Signals.
3. Optimizing Trend Algorithm.
4. Add Scalper TP similator.
バージョン 16.30 2021.06.07
1. Optimizing Trend Dashboard for small timeframes.
バージョン 16.21 2021.05.08
1. Optimizing indicator speed.
バージョン 16.20 2021.04.18
1. Fixing issue with ultimate Screener EA.
バージョン 16.10 2021.04.18
1. Add support for Trend Screener Ultimate.
バージョン 16.0 2021.03.19
1. Add support to swing stoploss for Trend screener EA.
バージョン 15.80 2021.01.06
1. Add support to Trend Turbo EA
バージョン 15.60 2020.10.01
1. Add backtesting feature / Demo testing in the market.
バージョン 15.51 2020.08.22
1. Setting optimization.
バージョン 15.50 2020.08.22
1. Optimizing Suffix and prefix displaying.
バージョン 15.0 2020.07.29
1. Fixing the issue of Suffix / Current Chart Mode.
2. Buffers optimization for Eas.
3. Adjusting the default setting.
バージョン 13.0 2020.06.15
1. Fixing Fuzzy logic score issue in version 12.00.
バージョン 12.10 2020.06.07
Updates :

1. Add new Alert time ( GMT Or BROKER SERVER TIME or Local Computer time ).
2. Add Parameter to define Frequency of the Screener updating. ( Seconds )
3. Add Pairs manager: Display Screener based on Current Chart OR Display Screener based on Custom pairs List.
4. Hide - display button for the Success Rate Simulator.

Fixed issues :
1. Correcting button names.


バージョン 11.10 2020.04.18
1. Add a Spread feature.
バージョン 11.0 2020.04.14
1. Add enable-disable Button based on Customers requests.
バージョン 10.1 2020.04.09
1. Changing the default setting.
バージョン 10.0 2020.04.06
1. Add EAs Supporting with 3 methods.
バージョン 9.2 2020.04.01
1. Fixing issue with the default setting.
バージョン 9.1 2020.03.31
1. Optimization of Stoploss calculator.
バージョン 9.0 2020.03.31
1. Optimizing trend line signal.
バージョン 8.1 2020.03.19
1. Optimizing CSM updating timing.
2. Add enable-disable CSM.
バージョン 8.0 2020.03.17
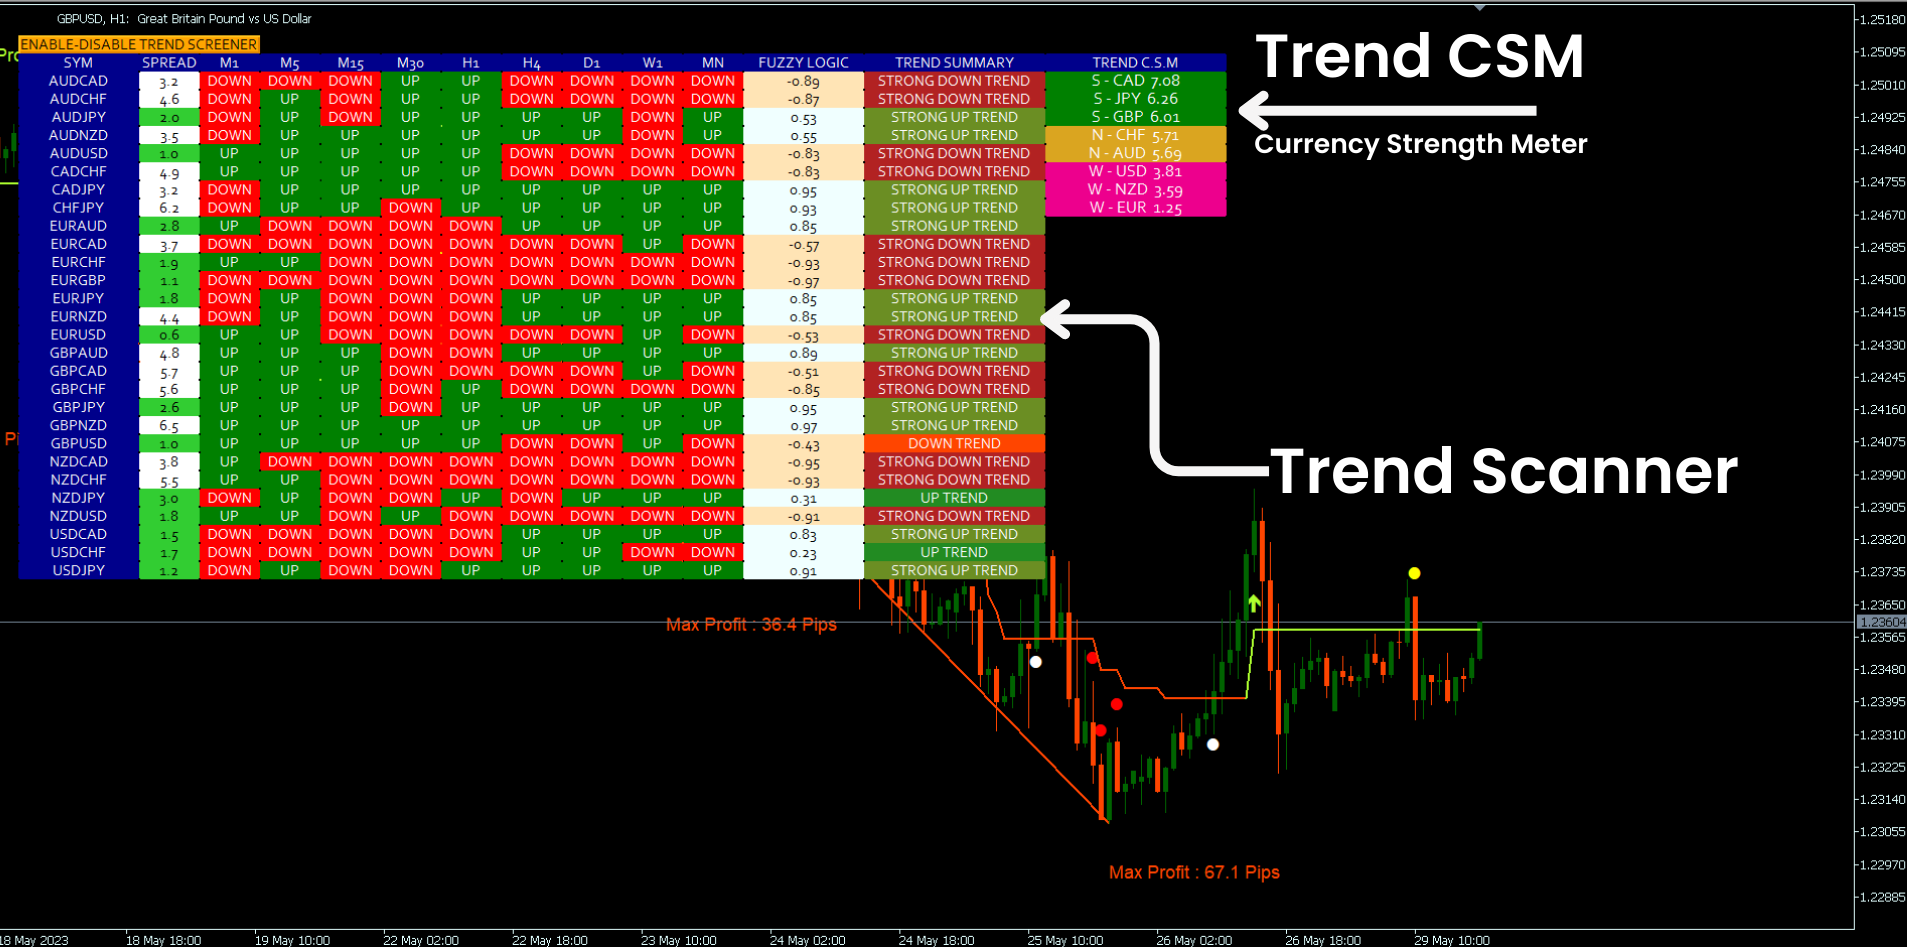
1. Add Currency Strength Meter
バージョン 7.3 2020.03.13
1. Add Prefix and Suffix for pairs like "EURUSD.c"...etc.
バージョン 7.2 2020.03.10
1. Fixing display Success rate simulator.
バージョン 7.1 2020.03.07
1. Adjusting default colors.
バージョン 7.0 2020.03.07
1. Optimizing Fuzzy logic algorithm and Strong Trend identification.
2. Optimizing Alert generating in Strong Trend and Normal Trend.
3. Add feature to display trading type recommendation in Success Rate Simulator.
4. Add Max bars to Run Success Rate Simulator.
バージョン 6.11 2020.03.01
1. Correcting some spelling mistakes.
バージョン 6.10 2020.03.01
1. Add Hide-Display Second Box
バージョン 6.0 2020.03.01
1. Add TP levels and SL per level.
2. Add 2 options for Takeprofit
2.1 Floating TP with three Ratio.
2.2 TP simulator to find the best TP with the best success rate.
3. Add Chart change via Button in Trend Screener.
4. Optimizing button click event.
バージョン 5.50 2020.02.27
1. Add Arrows color feature.
バージョン 5.2 2020.02.26
1. Optimization refresher.
バージョン 5.1 2020.02.26
1. Fixing a refreshing issue.
バージョン 5.0 2020.02.25
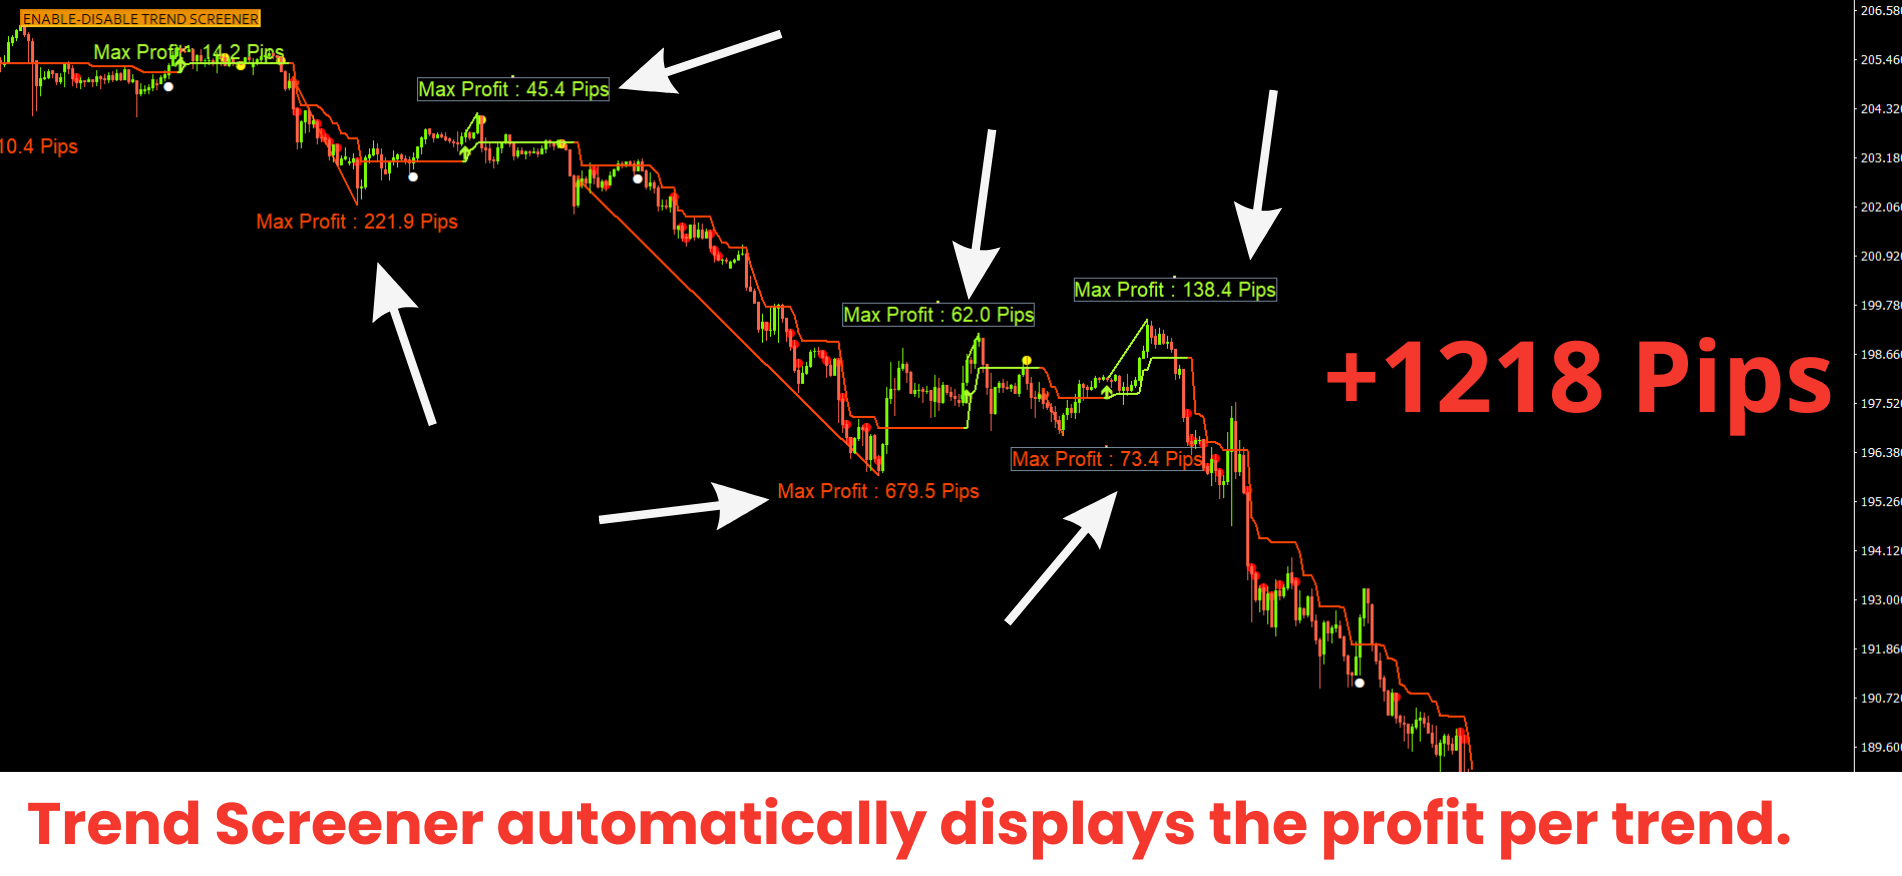
1. Add max profit feature.
2. Optimizing trend line drawing.
バージョン 4.0 2020.02.21
1. Add Alerts Filters.
2. Add List of pairs to display all Currencies in the same charts.
3. Add metals, indices supporting.
バージョン 3.0 2020.02.20
1. Add symbols automatically to the MT4 MarketWatch.
バージョン 2.0 2020.02.16
1. Optimizing trend calculation.
2. Add Alerts features.
バージョン 1.70 2020.02.13
Fixing the EURUSD calculation issue.
バージョン 1.60 2020.02.13
1. Optimizing Fuzzy logic calculation.