• 概要
  • レビュー (91)
  • コメント (262)
  • 最新情報

Trend Screener

4.83

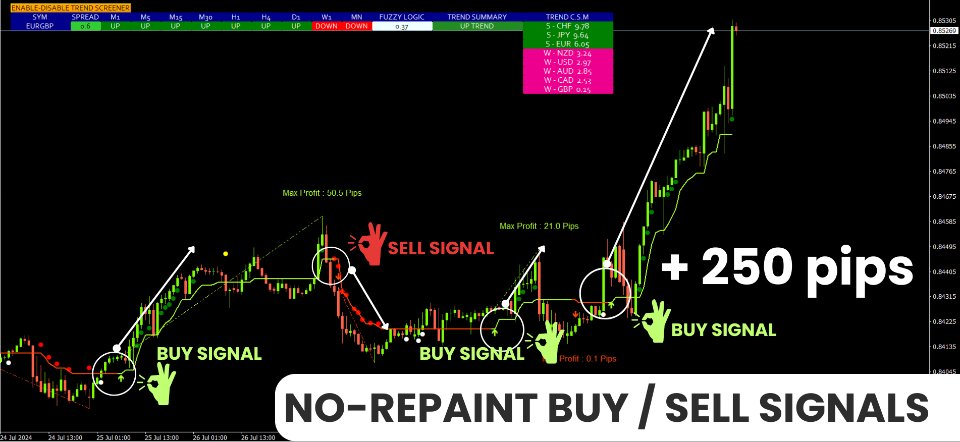
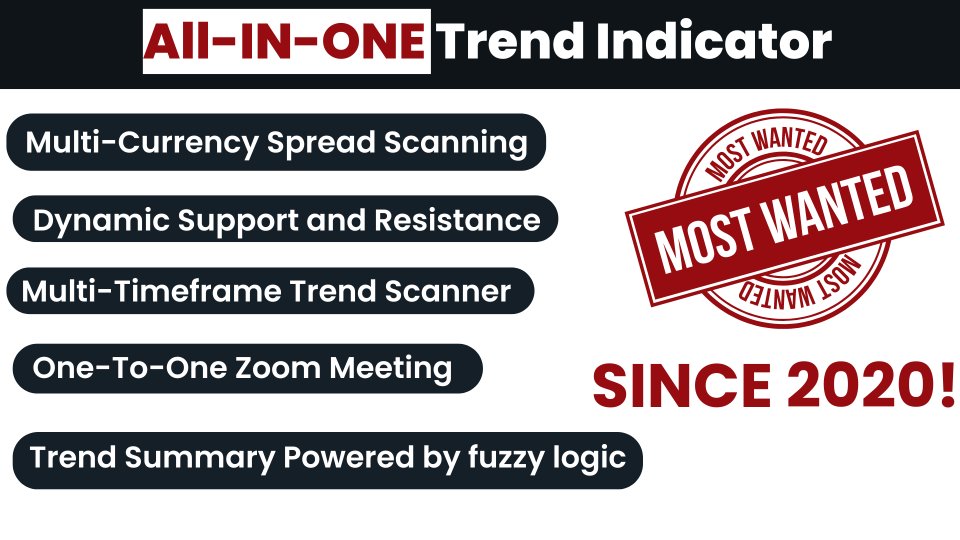
トレンドインジケーター、1つのツールに組み込まれたすべての重要なトレンド機能を備えたトレンドトレーディングとフィルタリングのための画期的なユニークなソリューション! これは、すべてのシンボル/商品(外国為替、商品、暗号通貨、インデックス、株式)で使用できる100%再描画されていないマルチタイムフレームおよびマルチ通貨インジケーターです。

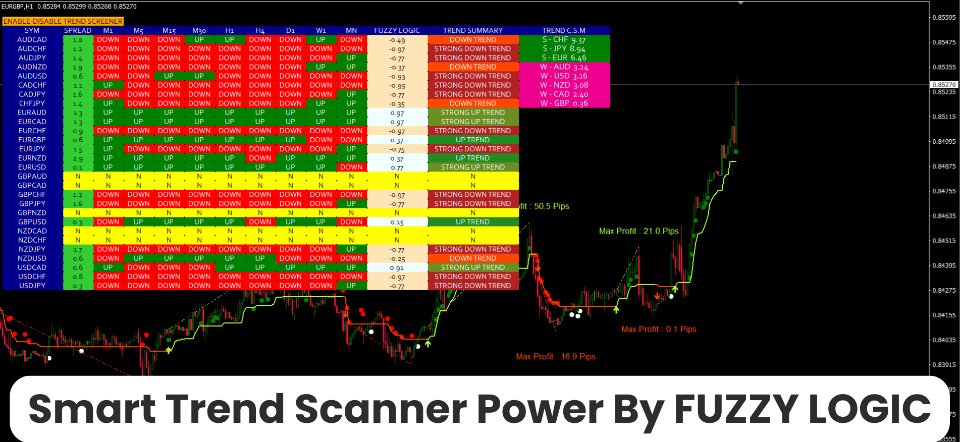
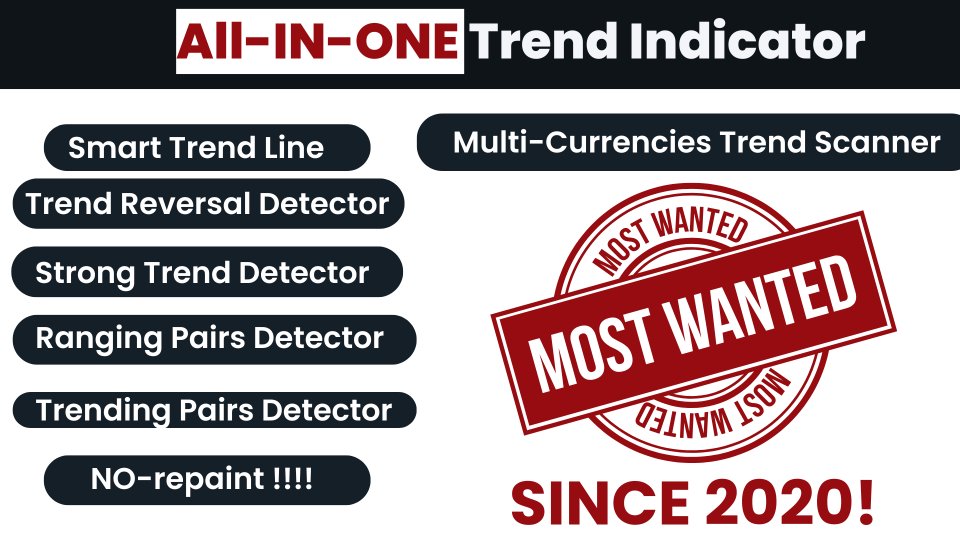
トレンドスクリーナーは、チャート内のドットで矢印トレンドシグナルを提供するインジケーターに続く効率的なインジケーターです。 トレンド分析インジケーターで使用できる機能:

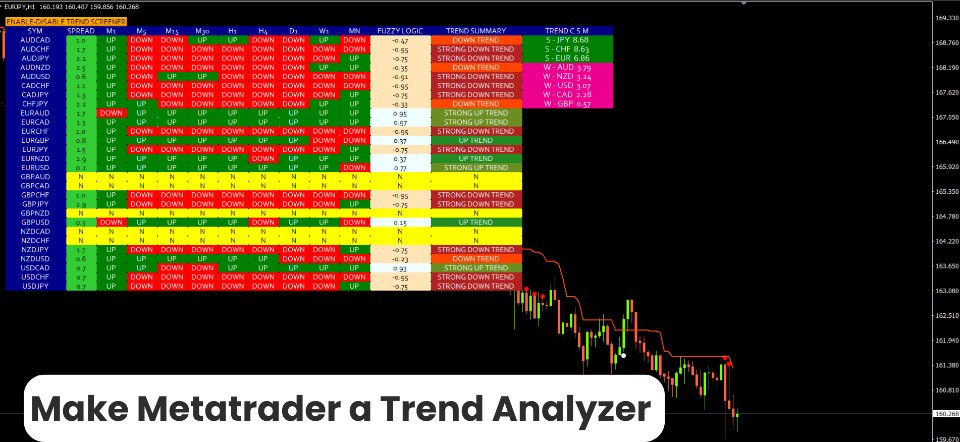
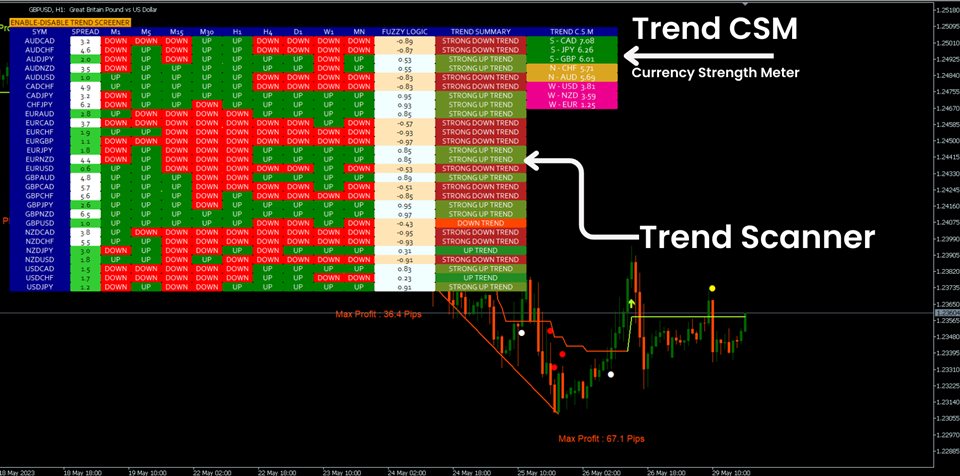
1.トレンドスキャナー。

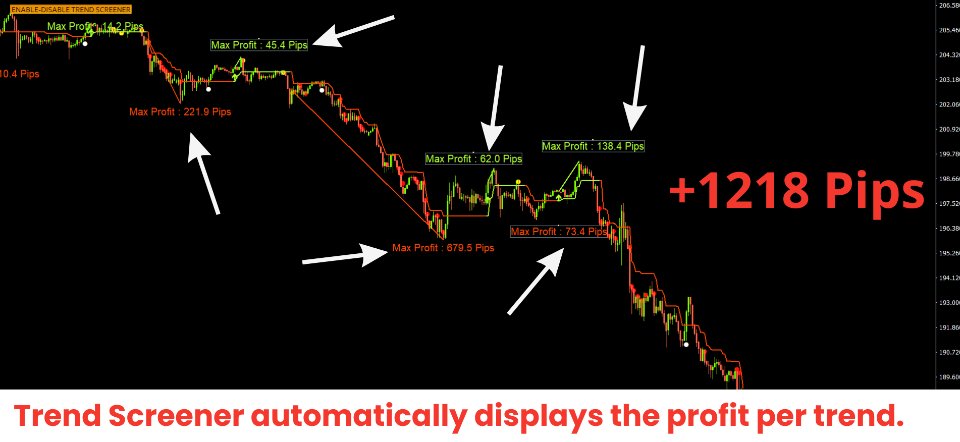
2.最大利益分析を備えたトレンドライン。

3.トレンド通貨強度メーター。

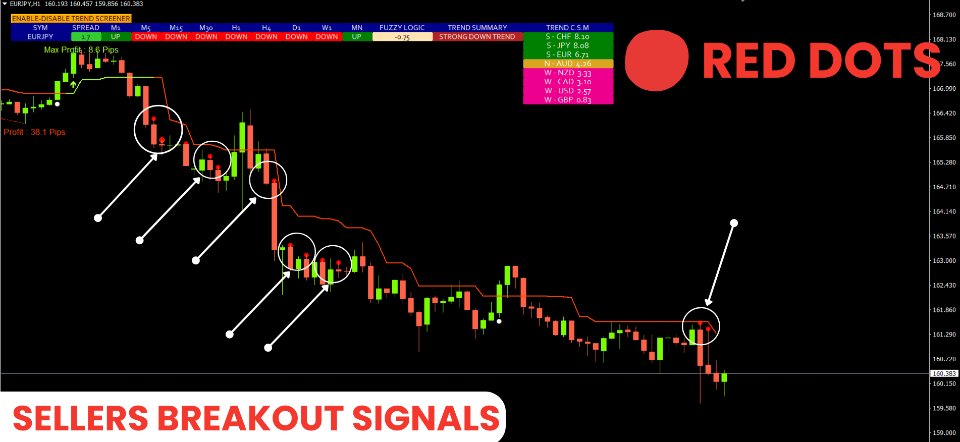
4.アラート付きのトレンド反転ドット。

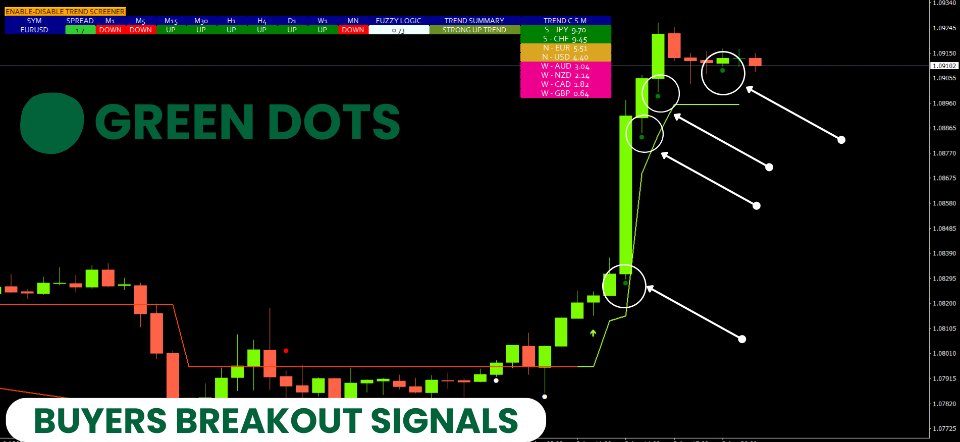
5.アラート付きの強いトレンドドット。

6.トレンド矢印

毎日の分析例、毎日のシグナルパフォーマンス...など、トレンドスクリーナーインジケーターを使用して、ここで見つけることができます:ここをクリックしてください


期間限定オファー:トレンドスクリーナーインジケーターは、50ドルと生涯でのみご利用いただけます。 (元の価格125 $)
MQL5ブログにアクセスすると、分析例、毎日の信号パフォーマンスなどを含むすべてのプレミアム指標を見つけることができます。 : ここをクリック


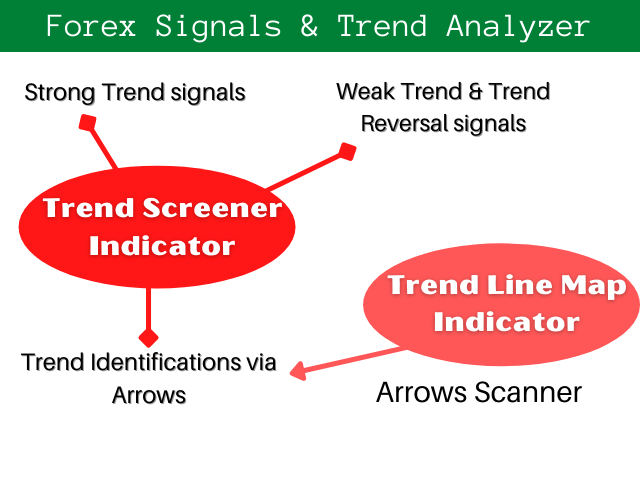
2つの指標で構成されるトレンドシステム:
1.Trend Screener Indicator :トレンドダッシュボード、チャートのトレンドライン、エントリーポイントなどを表示します。

2.Trend Line Map Indicator:ダッシュボードとして売買を表示し、アクティブなシグナルは利益/損失...などを表示します。

        トレンドラインマップインジケーターをダウンロード


Youtube ビデオのチュートリアル :

MQL5 ブログをチェックすると、トレンド スクリーナー インジケーターの使用方法と取引方法を説明する多くの YouTube ビデオ チュートリアルを見つけることができます。 すべてのビデオを検索するには、ここをクリックしてください。


主な機能

  • トレンド強度アナライザー。
  • マルチタイムフレームおよびマルチ通貨トレンド分析。
  • トレンドダッシュボード
  • トレンド反転シグナル。 (ドット信号)
  • 強いトレンドシグナル。 (ドット信号)
  • トレンドライン


ドキュメント(手順)

すべてのトレンドスクリーナーのドキュメント(手順)と戦略の詳細は、MQL5ブログのこの投稿で入手できます:ここをクリックしてください。


コンタクト

ご不明な点がある場合やサポートが必要な場合は、プライベートメッセージでご連絡ください。


著者

SAYADI ACHREF、フィンテックソフトウェアエンジニアおよびFinansyaの創設者。


レビュー 20
leroy
305
leroy 2024.05.15 18:57 
 

Great HTF Trend Tool! Thanks for creating this system!

Erik Jeske
131
Erik Jeske 2024.03.25 10:10 
 

I haven't tested the indicator properly yet. But I give 5 stars for the great support. My questions were answered in a short time. Problems were quickly resolved. Excellent.

tunsam61
32
tunsam61 2024.03.19 02:01 
 

The trend screener is one of the best indicators in the market if followed correctly. I've had the indicator for 3 days and has greatly helped my ability to predict the market. The developer has excellent customer support and always willing to go extra mile to satisfy his customers and answer any questions. I will recommend this product for anyone who is interested in making money from the financial market.

おすすめのプロダクト
Introduction It is common practice for professional trades to hide their stop loss / take profit from their brokers. Either from keeping their strategy to the themselves or from the fear that their broker works against them. Using this indicator, the stop loss / take profit points will be drawn on the product chart using the bid price. So, you can see exactly when the price is hit and close it manually.  Usage Once attached to the chart, the indicator scans the open orders to attach lines fo
の紹介     Quantum平均足PRO チャート 市場のトレンドに対する明確な洞察を提供するように設計された平均足キャンドルは、ノイズを除去し、誤ったシグナルを排除する能力で知られています。混乱を招く価格変動に別れを告げ、よりスムーズで信頼性の高いチャート表現を導入しましょう。 Quantum Heiken Ashi PRO を真にユニークなものにしているのは、従来のローソク足データを読みやすい色のバーに変換する革新的なフォーミュラです。赤と緑のバーはそれぞれ弱気トレンドと強気トレンドをエレガントに強調し、潜在的なエントリーポイントとエグジットポイントを驚くほど正確に見つけることができます。 量子EAチャネル:       ここをクリック MT5のバージョン:       ここをクリック この注目すべき指標には、いくつかの重要な利点があります。 明確性の向上: 価格変動を平滑化することで、平均足バーは市場トレンドをより明確に表現し、有利な取引機会を特定しやすくします。 ノイズの削減: 誤ったシグナルを引き起こすことが多い不安定な価格変動に別れを告げます。 Quan
これは、キャンドルの終値を予測する指標です。 このインジケータは、主にD1チャートでの使用を目的としていますが. この指標は、従来の外国為替取引とバイナリオプション取引の両方に適しています。 インジケーターは、スタンドアロンのトレーディングシステムとして使用することも、既存のトレーディングシステムへの追加として機能させることもできます。 このインジケーターは、現在のキャンドルを分析し、キャンドル自体の内部の特定の強度係数と、前のキャンドルのパラメーターを計算します。 したがって、この指標は、市場の動きのさらなる方向性と現在のキャンドルの終値を予測します。 この方法のおかげで、この指標は、短期の日中取引だけでなく、中期および長期の取引にも適しています。 インジケーターを使用すると、市場の状況の分析中にインジケーターが生成する潜在的な信号の数を設定できます。 インジケーターの設定には、このための特別なパラメーターがあります。 また、インジケーターは、チャート上のメッセージの形式で、電子メールで、およびPUSH通知の形式で、新しい信号について通知することができます。 購入後は必ず私に書いて
YK-Fibo Pivot Indicator: Trade Smarter with Fibonacci Pivot Points The YK-Fibo Pivot Indicator is a powerful technical analysis tool that combines the precision of Fibonacci retracements with the insights of Pivot Points. Whether you're a novice or seasoned trader, this indicator empowers you to spot profitable opportunities in the market with ease. Why Choose YK-Fibo Pivot? Pinpoint Support & Resistance: By calculating Fibonacci levels based on the previous day's high, low, and close prices, y
This is a trend indicator without redrawing Developed instead of the binary options strategy (by the color of the Martingale candlestick) Also works well in forex trading When to open trades (binary options) A signal will appear in the place with a candle signaling the current candle It is recommended to open a deal for one candle of the current timeframe M1 and M5 When a blue dot appears, open a deal up When a red dot appears, open a trade down. How to open trades on Forex. When a signal is rec
This is an arrow indicator without a future function,developed based on the most advanced profit trading algorithms.It has the most innovative and advanced dual trend analysis module, as well as the latest and highly effective market trend prediction algorithm.Trends are your friends, and following larger trends can earn the maximum profit in foreign exchange. This indicator helps traders identify current trends and track them. Someone once made a profit of 10 times in a week by relying on it.No
Noize Absorption Index - is the manual trading system that measures the difference of pressure between bears forces and bulls forces. Green line - is a noize free index that showing curent situation. Zero value of index shows totally choppy/flat market.Values above zero level shows how powerfull bullish wave is and values below zero measures bearish forces.Up arrow appears on bearish market when it's ready to reverse, dn arrow appears on weak bullish market, as a result of reverse expectation. S
Gold Bricks FX USES THE TREND WAVE INDICATOR AND IT CAN IDENTIFY THE BEGINNING AND THE END OF A NEW WAVE TREND MOVEMENT. AS AN OSCILLATOR, THE INDICATOR IDENTIFIES THE OVERBOUGHT AND OVERSOLD ZONES. IT WORKS GREAT TO CATCH THE SHORT TERM PRICE REVERSALS AND USES A MARTINGALE STRATEGY TO CLOSE ALL TRADES IN PROFIT. USE DEFAULT SETTINGS ON H1 OR HIGHER TIME FRAME ON ANY PAIR FOR MORE ACCURATE TRADES WHY THIS EA : Smart entries calculated by 4 great strategies The EA can be run on even a
Taurusは、当社独自の実際の取引量データを活用し、すでに効果的であったMean Reversion戦略を改良するための献身的な努力の頂点を象徴しています。各シンボルを独自のベストな設定で取引し、卓越したリスク・リワード・レシオとバランスの取れたストレスのない取引体験をユーザーに提供します。 主要データ 独自のリアル出来高データに基づく平均回帰戦略 グリッド、マーチンゲール、平均化を使用しない本格的なリスク管理 28の主要なFXシンボルすべてを、それぞれの最適な設定で処理 シンボルごとに最大1トレード、常にストップロスを固定 すべてのトレーダーに適した、取引ごとに100%調整可能なリスク 100%FIFO対応 100%プロップファーム対応 リンク タウラスFAQ - クリック Taurus Chat - クリック 取引シグナル - クリック テクニカル要件 1.お願い 以下のURL をターミナルのプロパティで許可されたURLのリストに 追加して ください。 - 出来高データ用 -> https://stein.investments - ニュースモジュール -> h
Classic Fractals indicator for MT4, with additional Trendlines connecting the latest couples of fractals ( fractals are showing highest high, and lowest low on each period) Rules for trendlines: -if new top fractal is below the last one = new resistance line -if new bot fractal is above the last one = new support line -Trendlines can be hidden -Fractals can be hidden Fractal Period = can be both even or uneven number, as it is setting for half (one side) of the bars sequence
Shark Deal Book
Philip Pankaj Suthagar
4 (3)
Term  "shark"  in the business world denotes a high volume investor who just made a good investment in a highly Potential business deal.So, sharks are the ones who make the market move. In our case, if an American shark bought a Japanese company, he/she has to convert American dollars into Japanese yen to make the deal. So, the demand for the Japanese yen will increase sharply. Thus USD/JPY will go short rapidly if the deal was from the shark. Another example, In the case of forex, if fed increa
This product is a part of  ON Trade Waves Patterns Harmonic Elliot Wolfe you can test free version on EURJPY from this link  Wolf Waves Indicator ウルフウェーブを発見しよう - あなたの究極の取引ツール! どんな時間軸でも簡単にウルフウェーブを見つけるための強力なツールを探していますか?もう探す必要はありません!私たちのウルフウェーブインジケーターは、その仕事を簡単にこなします。なぜこのインジケーターがあなたにぴったりか、以下でご紹介します。 主な特徴: 自動検出: ウルフウェーブインジケーターは、複雑なアルゴリズムを使用して、チャート上のキーポイントを自動的に見つけ、対応するラインを描画します。手動でパターンを探す手間が不要です。 使いやすさ: このインジケーターはシンプルなデザインで、経験豊富なトレーダーからウルフウェーブ初心者まで、誰でも簡単に利用できます。 高精度: 数多くのウルフウェーブインジケーターの中で、当社のものは完璧
TT Arrows is a trend based indicator that very succesfully predicts the start of the new trend.  The indicator is working with all trading instruments and in M5, M15, H1 and H4 timeframes. Up arrow signals a good time to enter a bullish trade while down arrow signals a good time to enter a bearish trade. The trade should be taken when the candle that has the arrow is closed. Following this strategy you will have have a high percentage of winning trades. Enjoy!
数列の一つに「森林火災数列」があります。これは、最も美しい新しいシーケンスの 1 つとして認識されています。その主な特徴は、このシーケンスが線形トレンドを回避することです。最短のものであってもです。この指標の基礎を形成したのはこのプロパティです。 財務時系列を分析する場合、この指標は可能なすべての傾向オプションを拒否しようとします。そして失敗した場合にのみ、トレンドの存在を認識し、適切なシグナルを発します。このアプローチにより、新しいトレンドの始まりの瞬間を正しく判断できます。ただし、偽陽性の可能性もあります。それらの数を減らすために、このインジケーターに追加のフィルターが追加されました。新しいバーが開くとシグナルが生成されます。いずれの場合も再描画は発生しません。 指標パラメータ: Applied Price - 適用価格定数; Period Main - インディケータのメイン期間、その有効な値は 5 ~ 60 です。 Period Additional - 追加の期間。このパラメーターの有効な値は 5 ~ 40 です。 Signal Filter - 追加の信号フィルター、有効
indicator for trading binary options and forex trading. The indicator does not redraw the readings. when trading binary options, testing was performed. This indicator showed the good results correct predictions. Under these conditions, the eur / usd m1 chart, when a signal appears, the transaction opens in the direction indicated by the indicator for 5 candles, then the truth is (5 minutes since in us the 1-minute chart of a candlestick is 1 minute) the result was. When trading in the forex
Awesome Oscillator by Bill Williams with the ability to fine-tune and replace the averaging algorithms of the indicator, which significantly expands the possibilities of using this oscillator in algorithmic trading and brings it closer in its properties to such an indicator as the MACD. To reduce price noise, the final indicator is processed with an additional Smooth averaging. The indicator has the ability to give alerts, send mail messages and push signals when the direction of movement of th
Perfect for one minutes high trading and scalping. This indicator is very effective for trading on one minutes, in the hour. A combination of moving averages and STOCHASTICS calculation to produce a very convincing signal every hour. Blue colour signals a buy opportunity. Follow the X signs for possible buy points. The Blue average line serves as possible trend direction and support. Red colour signals a sell opportunity. Follow the X signs for possible sell points. The Red average line serves a
まず第一に、この取引ツールはノンリペイント、ノンリドロー、ノンラグの指標であり、プロの取引に理想的ですことを強調する価値があります。 オンラインコース、ユーザーマニュアル、デモ。 スマートプライスアクションコンセプトインジケーターは、新米から経験豊富なトレーダーまで、非常 に強力なツールです。Inner Circle Trader AnalysisやSmart Money Concepts Trading Strategiesなど、20以上の有用な指標を1つに組み合わせています。このインジケーターはスマートマネーコンセプトに焦点を当て、大手機関の取引方法を提供し、彼らの動きを予測するのに役立ちます。 特に、流動性分析に優れており、機関がどのように取引しているかを理解しやすくしています。市場のトレンドを予測し、価格の動きを慎重に分析するのに優れています。機関の戦略とトレードを合わせることで、市場の動向についてより正確な予測ができます。このインジケーターは多目的であり、市場構造を分析し、重要な注文ブロックを特定し、さまざまなパターンを認識するのに優れています。 このインジケー
Owl smart levels
Sergey Ermolov
4.63 (54)
MT5版  |   FAQ Owl Smart Levels Indicator   は、 Bill Williams   の高度なフラクタル、市場の正しい波構造を構築する Valable ZigZag、エントリの正確なレベルをマークする Fibonacci レベルなどの一般的な市場分析ツールを含む 1 つのインジケーター内の完全な取引システムです。 利益を得るために市場と場所に。 戦略の詳細な説明 インジケータを操作するための指示 顧問-取引助手 プライベートユーザーチャット ->購入後に私に書いて、私はプライベートチャットにあなたを追加し、あなたはそこにすべてのボーナスをダウンロードすることができます 力はシンプルさにあります! Owl Smart Levels   取引システムは非常に使いやすいので、専門家にも、市場を勉強し始めて自分で取引戦略を選択し始めたばかりの人にも適しています。 戦略と指標に秘密の数式や計算方法が隠されているわけではなく、すべての戦略指標は公開されています。 Owl Smart Levels を使用すると、取引を開始するためのシグナルをすばやく確認し、
5 signal in 1  Product     TimeFrame   Recommend   1m-5m recommend  signal   TF  5m    Banks Pro Binary Option is Indicator for binary option Can Use Manaul Trade or Robot on Platform  Mt2Trading  https://www.mt2trading.com/?ref=104    Time Trading   good work  EU session    Recommend  Curency   EUR  GBP USD        careful   AUD JPY      Recommend  Martingale 2-5 Step   Recommend  set profit  2%-5%/Day Setting Brake  News Event High volatility   recommend  15-30 min Have Problem Contract
トレンドラインマップインジケーターは、トレンドスクリーナーインジケーターのアドオンです。トレンドスクリーナー(トレンドラインシグナル)によって生成されたすべてのシグナルのスキャナーとして機能します。 これは、トレンドスクリーナーインジケーターに基づくトレンドラインスキャナーです。 Trend Screener Pro インジケーターがない場合、Trend Line Map Proは機能しません。 ブログにアクセスすると、トレンドラインマップインジケーターの無料バージョンをダウンロードできます。 Metatrader Testerの制限なしで、購入する前に試してみてください。 :    ここをクリック 1.簡単になる利点 通貨と時間枠に基づいて売買シグナルを表示します。 チャートに矢印が表示されてから価格が増減したピップ数を評価します。 (トレンドスクリーナーインジケーター矢印) 信号のタイミングを表示します。 アラートを売買するための複数の時間枠と複数の通貨のアラートを取得します。 2.トレンドラインマップの使用方法 売買シグナルダッシュボードを表示す
Levels ATR
Hafis Mohamed Yacine
The ATR Levels Indicator For MT4 is an indicator that is built specifically for traders who use the Meta Trader 4 for their trading analysis, charting of different currency pairs and trading assets, doing their technical analysis and making trading decisions all through the trading day as they work. One of the first major advantages of using the ATR Levels Indicator For MT4 is that it automatically helps the trader to spot very important levels in the markets based on the Average True Range In
This is a new strategy for SUPPLY DEMAND areas It is based on a calculation using the tick volume to detect the big price action in market for both bear /bull actions this smart volume action candles are used to determine the supply and demand areas prices in between main supply and demand lines indicate sideway market  up arrows will be shown when prices moves above the main supply and the secondary supply lines Down arrows will be shown when prices moves below the main demand and the secondary
The Th3Eng PipFinite indicator is based on a very excellent analysis of the right trend direction with perfect custom algorithms. It show the true direction and the best point to start trading. With StopLoss point and Three Take Profit points. Also it show the right pivot of the price and small points to order to replace the dynamic support and resistance channel, Which surrounds the price. And Finally it draws a very helpful Box on the left side on the chart includes (take profits and Stop loss
A trend indicator based on the Ichimoku Kinko Hyo and MACD. The ICloud Scalper Trend Indy is an improved variant of the Ichimoku Kinko Hyo and MACD, which shows the moment of trend following quite accurately. It is often used as a signal filter. Combination of two indicators makes a better use of these advantages: Ichimoku Kinko Hyo identifies the trend, while MACD determines the short-term movements and signals in the trend direction. Messages/Sounds (Notifications and sound settings) ON/OFF
We present you the indicator "Candle closing counter", which will become your indispensable assistant in the world of trading. That’s why knowing when the candle will close can help: If you like to trade using candle patterns, you will know when the candle will be closed. This indicator will allow you to check if a known pattern has formed and if there is a possibility of trading. The indicator will help you to prepare for market opening and market closure. You can set a timer to create a p
MT4 の R 2EMA Color インジケーターは、2 つの EMA のクロスオーバーに基づく堅実な取引シグナルを提供します。 キーポイント 価格が 2 つの緑色の EMA を超えて閉じると、買いトレード シグナルが作成されます。 価格が 2 つの赤い EMA を超えて閉じると、売りトレード シグナルが作成されます。 R 2EMA Color Forex インジケーターにより、売買のタイミングをより簡単に判断できます 2 つの EMA ラインが緑色に変わると、買いシグナルが発生します。 2 つの EMA ラインが赤くなると、売りシグナルが発生します。 それと取引する方法は? 2 つの EMA シグナル ラインが赤色から緑色に変わるとすぐに買い取引を開始します。トレンドは現在ポジティブです。 2 つの EMA シグナル ラインが緑色から赤色に変わるとすぐに売りトレードを開始します。トレンドは現在ネガティブです。 チャート上で反対の取引シグナルが発生したら、取引を終了します。 R 2EMA Color インジケーターで取引を開始および終了するために、お好みの取引方法を自由
Intraday Levels shows intraday levels grid for intraday trading Shows a grid for the day levels, gives you a guide to know the trend and to measure intraday trades (stop-loss and take-profit). Parameters are: Levels Mode: Basic mode: Shows highest, lowest and middle levels. Advanced mode: Shows highest, lowest, middle and intermediate levels. Fibonacci mode: Shows session Fibonacci retracements levels. Momentum mode: Shows delayed Advanced levels to identify momentum. Smooth Period (Momentum
MACD Color for GOLD  Use for looking moving-way of graph and checking will be buy or sell  Easy for looking by see the color of trand. Red is down / Blue is up.  Can to use it with every time-frame by 1. Long Trade : Use it with time-frame H1 /  H4 /  Daily  2.Short Trade : Use it with  time-frame  M5 / M15  / M 30 /  H1 and you can see when you will open or close the orders by see this indicator by well by see signal line cut with color line again in opposite. and you can use this indicator for
This indicator allows to analyze a chart using the rule of supple and demand. You will see zones of sales and purchases and determine the most profitable points to open positions. The indicator is based on the principle of market fractality. Chart zones show places where a strong buyer or seller has made the price reverse and change its direction. The indicator has several types of zones calculation. Color and type of zones displaying are set as desired. The zone width can be displayed in pips.
このプロダクトを購入した人は以下も購入しています
Reversal First Impulse levels (RFI)    INSTRUCTIONS        RUS       -       ENG              R ecommended to use with an indicator   -   TREND PRO -  Version MT5 A key element in trading is zones or levels from which decisions to buy or sell a trading instrument are made. Despite attempts by major players to conceal their presence in the market, they inevitably leave traces. Our task was to learn how to identify these traces and interpret them correctly. Main functions: Displaying active zones
まず第一に、この取引インジケーターは再描画されず、再描画されず、遅延しないことを強調する価値があります。これにより、手動取引とロボット取引の両方に理想的なものになります。 ユーザーマニュアル:設定、入力、戦略。 アトミックアナリストは、価格の強さとモメンタムを利用して市場でより良いエッジを見つけるためのPA価格アクションインジケーターです。ノイズや誤ったシグナルを除去し、取引ポテンシャルを高めるための高度なフィルターを備えています。複雑なインジケーターの複数のレイヤーを使用して、アトミックアナリストはチャートをスキャンし、複雑な数学的計算をシンプルなシグナルと色に変換します。これにより、どのような初心者トレーダーでも理解して使用し、一貫した取引の決定を行うことができます。 「アトミックアナリスト」は、新規および経験豊富なトレーダー向けにカスタマイズされた包括的な取引ソリューションです。プレミアムインジケーターとトップノッチの機能を1つの取引戦略に組み合わせ、すべてのタイプのトレーダーにとって汎用性のある選択肢にします。 デイリートレーディングとスキャルピング戦略:高
Enigmera
Ivan Stefanov
5 (3)
エニグメラ:市場の中核 https://www.enigmera.com はじめに このインディケータと取引システムは、金融市場に対する驚くべきアプローチです。ENIGMERAは、フラクタルサイクルを使用して、サポートとレジスタンスレベルを正確に計算します。本格的な蓄積局面を示し、方向性と目標を示します。 トレンド中でも調整中でも機能するシステムです。 どのように作動するのか? ENIGMERAは、支持線・抵抗線、目標線、乖離線の3つのラインで構成されています。このシステムは、過去のデータを現在と未来に外挿する典型的な市場指標とは異なり、現在の完全な画像を提供します。支持線上にある場合、それは本当の支持を意味し、抵抗線上にある場合、それは本当の抵抗を意味する。ある水準が破られた場合、それはトレンドの変化を意味する。再描画はしない。 市場は常に進化しているため、ENIGMERAはその評価ツールを適応させ、定期的に戦略を修正しています。  これにより、すべてのシナリオが徹底的に評価されることが保証されます。この市場指標の独自性は、その能力を見れば明らかです。  ENIGM
現在20%OFF! 初心者やエキスパートトレーダーのためのベストソリューション! このダッシュボードソフトウェアは、28の通貨ペアで動作しています。それは私達の主要な指標(高度な通貨の強さ28と高度な通貨インパルス)の2に基づいています。それは全体の外国為替市場の大きい概観を与えます。それは、すべての(9)時間枠で28の外国為替ペアのための高度な通貨の強さの値、通貨の動きの速度と信号を示しています。チャート上で1つのインディケータを使用して市場全体を観察し、トレンドやスキャルピングの機会をピンポイントで見つけることができたら、あなたのトレードがどのように改善されるか想像してみてください。 このインディケータには、強い通貨と弱い通貨の識別、潜在的な取引の識別と確認がより簡単になるような機能が搭載されています。このインディケータは、通貨の強さや弱さが増加しているか減少しているか、また、すべての時間枠でどのように機能しているかをグラフィカルに表示します。 新機能として、現在の市場環境の変化に適応するダイナミックなマーケットフィボナッチレベルが追加され、すでに当社のAdvan
Indicator : RealValueIndicator Description : RealValueIndicator is a powerful tool designed specifically for trading on the EURUSD pair. This indicator analyzes all EUR and USD pairs, calculates their real currency strength values, and displays them as a single realistic value to give you a head start on price. This indicator will tell you moves before they happen if you use it right. RealValueIndicator allows you to get a quick and accurate overview of the EURUSD currency pair tops and bottoms,
Gold Channel is a volatility-based indicator, developed with a specific timing algorithm for the XAUUSD pair, which consists of finding possible corrections in the market. This indicator shows two outer lines, an inner line (retracement line) and an arrow sign, where the theory of the channel is to help identify overbought and oversold conditions in the market. The market price will generally fall between the boundaries of the channel. If prices touch or move outside the channel it is a tra
ECM Elite Channel is a volatility-based indicator, developed with a specific time algorithm, which consists of finding possible corrections in the market. This indicator shows two outer lines, an inner line (retracement line) and an arrow sign, where the channel theory is to help identify overbought and oversold conditions in the market. The market price will generally fall between the boundaries of the channel. If prices touch or move outside the channel, it's a trading opportunity. The
Gann Signal is a very simple indicator at first glance, but hidden inside is many years of experience in studying W.D.Ganna methods. The indicator gives accurate BUY/SELL signals, without redrawing. The indicator is very easy to use. All you need to do is attach it to your chart and follow its recommendations. The indicator constantly analyzes the market for entry opportunities. When such an opportunity appears, the indicator gives a signal in the form of an arrow. I repeat, all signals are NOT
Please send me Direct message on MQL5 CHAT after purchasing the Indicator for Training and Installation Support There are some additional files that is important to use with the Indicator . So be sure to contact me after purchasing the Indicator So that I can add you for training and support . If you find any difficulty with installation then send me Direct message here So that I can connect with you via Anydesk or Teamview for the product installation. " Smart Order Block Indicator " to find
Introduction to X3 Chart Pattern Scanner X3 Cherart Pattern Scanner is the non-repainting and non-lagging indicator detecting X3 chart patterns including Harmonic pattern, Elliott Wave pattern, X3 patterns, and Japanese Candlestick patterns. Historical patterns match with signal patterns. Hence, you can readily develop the solid trading strategy in your chart. More importantly, this superb pattern scanner can detect the optimal pattern of its kind. In addition, you can switch on and off individu
TrendMaestro
Stefano Frisetti
5 (3)
note: this indicator is for METATRADER4, if you want the version for METATRADER5 this is the link:  https://www.mql5.com/it/market/product/108106 TRENDMAESTRO ver 2.4 TRENDMAESTRO recognizes a new TREND in the bud, he never makes mistakes. The certainty of identifying a new TREND is priceless. DESCRIPTION TRENDMAESTRO identifies a new TREND in the bud, this indicator examines the volatility, volumes and momentum to identify the moment in which there is an explosion of one or more of these data a
もちろんです。以下は、提供いただいたテキストの日本語への翻訳です: MT4用の天文学指標をご紹介します:究極の天体トレーディングコンパニオン トレーディング体験を天空の高みに高める準備はできていますか?私たちの革命的なMT4用の天文学指標をご紹介します。この革新的なツールは、複雑なアルゴリズムの力を借りて、類まれなる天文学的洞察と精密な計算を提供します。 あなたの指先で宇宙の情報を: 宝のような天文学的データが明らかになる包括的なパネルをご覧ください。惑星の地理的/太陽中心座標、太陽と地球の距離、星の大きさ、伸び、星座、黄道座標および赤道座標、さらには水平座標まで、それぞれが綿密に計算され美しく表示されています。指標によって生成される垂直線は時間値に対応し、トレーディングの旅に宇宙の視点を提供します。 惑星のラインと関係: グラフを飾る惑星のラインの魔法を体験し、スケールと角度をカスタマイズできます。直感的なコントロールパネルを介して各惑星のラインの表示を簡単に切り替えることができます。指定された時刻範囲内での合会、六分会、四分会、三分会、対会、逆行の指標で天体の関係の芸術を発見してく
収益性の高い取引機会を簡単に特定するのに役立つ強力な外国為替取引インジケーターをお探しですか?ビースト スーパー シグナル以外に探す必要はありません。 この使いやすいトレンドベースのインジケーターは、市場の状況を継続的に監視し、新しいトレンドを検索したり、既存のトレンドに飛びついたりします。ビースト スーパー シグナルは、すべての内部戦略が一致し、互いに 100% 合流したときに売買シグナルを発するため、追加の確認は不要です。シグナル矢印アラートを受け取ったら、単に売買します。 購入後、プライベート VIP グループに追加されるようにメッセージを送ってください! (完全な製品購入のみ)。 購入後、最新の最適化されたセット ファイルについてメッセージを送ってください。 MT5バージョンは こちらから入手できます。 Beast Super Signal EA は こちらから 入手できます。 コメント セクションをチェックして、最新の結果を確認してください。 ビースト スーパー シグナルは、1:1、1:2、または 1:3 のリスクと報酬の比率に基づいて、エントリ
Volatility Trend System - a trading system that gives signals for entries. The volatility system gives linear and point signals in the direction of the trend, as well as signals to exit it, without redrawing and delays. The trend indicator monitors the direction of the medium-term trend, shows the direction and its change. The signal indicator is based on changes in volatility and shows market entries. The indicator is equipped with several types of alerts. Can be applied to various trading
NAM Order Blocks
NAM TECH GROUP, CORP.
5 (1)
MT4マルチタイムフレームオーダーブロック検出インジケーター。 特徴 -チャートコントロールパネルで完全にカスタマイズ可能で、完全な相互作用を提供します。 -必要な場所でコントロールパネルを表示および非表示にします。 -複数の時間枠でOBを検出します。 -表示するOBの数量を選択します。 -さまざまなOBユーザーインターフェイス。 -OBのさまざまなフィルター。 -OB近接アラート。 -ADRの高線と低線。 -通知サービス(画面アラート|プッシュ通知)。 概要 注文ブロックは、金融機関や銀行からの注文収集を示す市場行動です。著名な金融機関と中央銀行が外国為替市場を牽引しています。したがって、トレーダーは市場で何をしているのかを知る必要があります。市場が注文ブロックを構築するとき、それは投資決定のほとんどが行われる範囲のように動きます。 注文の構築が完了すると、市場は上向きと下向きの両方に向かって急激に動きます。注文ブロック取引戦略の重要な用語は、機関投資家が行っていることを含むことです。それらは主要な価格ドライバーであるため、機関投
トレンドトレーディング は、タイミングのプルバックとブレイクアウトにより、市場で起こっているトレンドから可能な限り利益を得るように設計された指標です。確立されたトレンドの中で価格が何をしているかを分析することにより、取引の機会を見つけます。 [ インストールガイド | 更新ガイド | トラブルシューティング | よくある質問 | すべての製品 ] 自信を持って効率的に金融市場を取引する むち打ちにならずに確立されたトレンドから利益を得る 収益性の高いプルバック、ブレイクアウト、早期の逆転を認識する この指標は、独自の品質とパフォーマンスを分析します 複数時間枠のダッシュボードを実装します インジケーターは再描画されていません 電子メール/音声/視覚アラートを実装します 確立されたトレンドは多くの取引機会を提供しますが、ほとんどのトレンド指標はそれらを完全に無視しています。インジケーターの解釈はかなり簡単です: (1) トレンドの変化 (2) トレンドの方向への後退 (3) トレンドの方向へのブレイクアウト 赤いダッシュ は下降トレンド中の修正です 青いダッシュ は上昇ト
The Volume by Price Indicator for MetaTrader 4 features Volume Profile and Market Profile TPO (Time Price Opportunity). Volume and TPO histogram bar and line charts. Volume Footprint charts. TPO letter and block marker collapsed and split structure charts. Session filtering and grouping. Static, dynamic and flexible range segmentation and compositing methods with relative and absolute visualizations. Graphical layering, positioning and styling options to suit the user's analytic and aesthetic n
Cycle Sniper
Elmira Memish
4.39 (36)
NEW YEAR SALE PRICE FOR LIMITED TIME!!! Please contact us after your purchase and we will send you the complimentary indicators to complete the system Cycle Sniper is not a holy grail but when you use it in a system which is explained in the videos, you will feel the difference. If you are not willing to focus on the charts designed with Cycle Sniper and other free tools we provide, we recommend not buying this indicator. We recommend watching the videos about the indiactor and system before pu
How to use Pair Trading Station Pair Trading Station is recommended for H1 time frame and you can use it for any currency pairs. To generate buy and sell signal, follow few steps below to apply Pair Trading Station to your MetaTrader terminal. When you load Pair Trading Station on your chart, Pair Trading station will assess available historical data in your MetaTrader platforms for each currency pair. On your chart, the amount of historical data available will be displayed for each currency pai
The indicator " ZigZag on Trend " is an assistant in determining the direction of price movement, as well as a calculator of bars and points. It consists of a trend indicator, which follows the price direction by the trend line presented in the form of a zigzag and a counter calculating the number of bars traversed in the direction of the trend and the number of points on the vertical scale. (calculations are carried out by the opening of the bar) The indicator does not redraw. For convenience,
Step into the realm of Forex trading with confidence and precision using XQ, a cutting-edge Forex indicator designed to elevate your trading game to unprecedented heights. Whether you're a seasoned trader or just stepping into the world of currency exchange,   XQ Forex Indicator   empowers you with the insights and signals needed to make informed trading decisions. The signal conditions are a combination of three indicators, and XQ Forex Indicator only display  medium and long-term trends . The
Full Forex Market View Dashboard
Opengates Success International
5 (2)
FULL FOREX MARKET VIEWダッシュボードインジケーター これは、トレーダーが市場で何が起こっているかを完全に把握できるようにするために作成されたカスタム指標です。 リアルタイム データを使用して市場にアクセスし、取引を成功させるために必要なあらゆる情報を表示します。 インストール: このインジケーターをウィンドウ チャートに添付する前に、MT4 のマーケット ウォッチ パネルに移動し、不要な通貨ペアまたは取引しないすべての通貨ペアを非表示にして、残りをそこに残します。 その理由は、FFMV ダッシュボードが MT4 の気配値表示に表示されるすべての通貨ペアを表示するためです。 最大 30 通貨ペア以下を表示できます。 MT4 の気配値表示でそれ以上だと、FFMV ダッシュボードのフォントと画像がぼやけて変形します。 正しく表示されません。 使用法:      個人取引の場合      バスケット取引の場合 (方法についてはスクリーンショットを参照してください)      複数注文取引にも使用可能      独自の取引システムなどから
Cyclical indicator for trading and predicting the direction of the market. Shows the cyclical behavior of the price in the form of an oscillator. Gives signals for opening deals when rebounding from the upper and lower boundaries of the oscillator. In the form of a histogram, it shows the smoothed strength of the trend. Will complement any trading strategy, from scalping to intraday. The indicator does not redraw. Suitable for use on all symbols/instruments. Suitable time frames for short-term
回帰取引を意味する専門的かつ定量的なアプローチを実装する独自の指標。これは、価格が予測可能かつ測定可能な方法で迂回して平均に戻るという事実を利用しており、非定量的な取引戦略を大幅に上回る明確な出入りルールを可能にします。 [ Installation Guide | Update Guide | Troubleshooting | FAQ | All Products ] 明確な取引シグナル 驚くほど簡単に取引できます カスタマイズ可能な色とサイズ パフォーマンス統計を実装します ほとんどの取引戦略を上回ります 適切なSLおよびTPレベルを表示します 電子メール/音声/視覚アラートを実装します 使い方 インディケータは、より高い時間枠からの完全にカスタマイズ可能な移動平均の周りの標準偏差を測定し、トレンドフォローアプローチを使用して正確に取引を見つけます。取引は、現在のチャートの価格アクションに飛び込むことによって見つけられ、価格が選択したより高い時間枠から計算された平均価格帯に戻ったときに閉じられます。それがコード化される方法のために、指標は高ボラティリティと強いトレンドの
Indicatorul MOTANO Bună ziua! 24 de ore - REDUCERE PREȚ! Profita! Tocmai am terminat indicatorul MOTANO după multă muncă. Este un indicator de săgeată. Merge perfect pe M15, aproape orice pereche. Săgețile indică intrările de cumpărare și vânzare, iar o țintă de profit de 5,10 sâmburi asigură un profit sigur. Un profit și mai mare poate fi stabilit, în funcție de situație. Dar cuvintele sunt de prisos. Testați-l și trageți propriile concluzii. Notă Este posibil ca acești ind
驚異的なFXインジケーター「Miraculous」をご紹介します。完璧な結果を得るための1時間足を含むすべてのタイムフレームで効果的に機能する、最強の強力な特殊MT4フォレックスインジケーターです。 すべてのタイムフレームで優れた結果を提供する最高のFXインジケーターを探し続けるのに疲れましたか?これ以上探す必要はありません!「Miraculous」フォレックスインジケーターをご紹介します。このインジケーターは、トレーディングの経験を変革し、収益を新たなレベルに引き上げるために設計されました。 先進のテクノロジーと長年にわたる緻密な開発に基づいて構築された「Miraculous」フォレックスインジケーターは、FX市場における力と正確さの頂点となります。この素晴らしいツールは、すべてのレベルのトレーダーのニーズを満たすように設計されており、一貫した収益性を追求する上で比類のない優位性を提供します。 「Miraculous」フォレックスインジケーターの他との違いは、その非常に適応性にあります。デイトレーダー、スウィングトレーダーであろうと、長期ポジションを好む方であろうと、このインジケータ
3 Indicators in 1 indicator Strategy based on price action Made specifically for the best forex currency pairs Can be used in the best time frame of the market at a very reasonable price This indicator is basically 3 different indicatos . But we have combined these 3 indicators in 1 indicator so that you can use 3 indicators at the lowest price. All three strategies are based on price action. But based on different trends. Long term, medium term and short term Attributes : No repaintin
現在20%OFF! このダッシュボードは、複数のシンボルと最大9つのタイムフレームで動作するソフトウェアの非常に強力な部分です。 このソフトは、弊社のメインインジケーター(ベストレビュー:Advanced Supply Demand)をベースにしています。    Advanced Supply Demand ダッシュボードは、素晴らしい概要を提供します。それは示しています。  ゾーン強度評価を含むフィルタリングされた需給値。 ゾーン内/ゾーンへのPips距離。 ネストされたゾーンがハイライトされます。 選択されたシンボルの4種類のアラートを全ての(9)時間枠で提供します。 それはあなたの個人的なニーズに合わせて高度に設定可能です。 あなたの利益! すべてのトレーダーにとって最も重要な質問です。 市場に参入するのに最適なレベルはどこか? 成功のチャンスとリスク/リターンを得るために、強力な供給/需要ゾーン内またはその近くで取引を開始します。 損切りの最適な位置はどこですか? 最も安全なのは、強力な供給/需要ゾーンの下/上にストップを置くことで
Currently Price 20% OFF ( for unlimited use )   BONUS  AUX VIP Club 2024 : Include  EA Airbag  and  Load Data History  to enhance the performance of this tool to its maximum potential  Click Here to Download Files   ( for users only )   Hello World! Introducing.. SMCpro VIP tool and Indicator for MetaTrader 4, designed to revolutionize your trading experience with the ICT Smart Money Concept. This system is meticulously crafted to empower traders with advanced insights and precision in
Backtest with good trend detection results from January 2023 EURUSD Time frame: m15, m30, H1 AUDUSD Time frame: m15, m30 NASDAQ Time frame: m15 S&P 500 Time frame: m15, m30 XAUUSD Time frame: m30 BTCUSD Time frame: H4 These are just some of the assets tested (Please note that past results are no guarantee of future results). Note that this is not a complete strategy, you can use this indicator as an entry trigger after your analysis by setting stop loss and take profit values ​​that you d
作者のその他のプロダクト
トレンド スクリーナー インジケーターでトレンド取引の力を解き放ちます。ファジー ロジックと複数通貨システムを活用した究極のトレンド取引ソリューションです。 ファジー ロジックを活用した革新的なトレンド インジケーターである Trend Screener を使用して、トレンド取引を向上させます。 これは、13 を超えるプレミアム ツールと機能、および 3 つの取引戦略を組み合わせた強力なトレンド追跡インジケーターであり、Metatrader をトレンド アナライザーにする多用途の選択肢となります。 期間限定オファー : トレンド スクリーナー インジケーターは、わずか 50 ドルで生涯ご利用いただけます。 (元の価格 125$ ) (オファー延長) Trend Screener の 100% 非再描画精度の揺るぎない精度を体験して、取引の決定が過去の価格変動の影響を受けないようにしてください。 マルチタイムフレームおよびマルチ通貨機能の多用途性を解放し、比類のない自信を持って外国為替、商品、暗号通貨、インデックスの世界を取引できるようにします。 Trend Screener の包括的な
私たちのサポートまたはレジスタンスレベルは、市場の価格行動が逆転して方向を変え、市場にピークまたはトラフ(スイングポイント)を残したときに形成されます。サポートとレジスタンスのレベルは、取引範囲を切り開くことができます。インジケーターは、インジケーターセットで定義されたバーのX量(期間)に基づいて、スイングハイとスイングローを識別します。 注:価格アクションインジケーターが気に入った場合は、オールインワントレンドインジケーター(トレンドスクリーナー、トレンドライン、ストロングトレンド、トレンドリバーサルシグナルなど)をお試しください。 入手するには、 ここをクリックしてください 主な機能 テクニカル分析の重要な概念は、抵抗またはサポートレベルが破られると、その役割が逆転することです。価格がサポートレベルを下回ると、そのレベルは抵抗力があります。価格が抵抗レベルを超えて上昇した場合、それはしばしばサポートになります。 水平方向のサポートと抵抗のレベルは、これらのレベルの最も基本的なタイプです。それらは単に水平線で識別されます: チャートの緑のレベルは、抵抗レベルです。 チャート
FREE
トレンドラインマップインジケーターは、トレンドスクリーナーインジケーターのアドオンです。トレンドスクリーナー(トレンドラインシグナル)によって生成されたすべてのシグナルのスキャナーとして機能します。 これは、トレンドスクリーナーインジケーターに基づくトレンドラインスキャナーです。 Trend Screener Pro インジケーターがない場合、Trend Line Map Proは機能しません。 It's a Trend Line Scanner based on Trend Screener Indicator. If you don't have Trend Screener Pro Indicator,     the Trend Line Map Pro will not work . ブログにアクセスすると、トレンドラインマップインジケーターの無料バージョンをダウンロードできます。 Metatrader Testerの制限なしで、購入する前に試してみてください。 :  ここをクリック 1.簡単になる利点 通貨と時間枠に基づいて売買シグナルを表示し
トレンドラインマップインジケーターは、トレンドスクリーナーインジケーターのアドオンです。トレンドスクリーナー(トレンドラインシグナル)によって生成されたすべてのシグナルのスキャナーとして機能します。 これは、トレンドスクリーナーインジケーターに基づくトレンドラインスキャナーです。 Trend Screener Pro インジケーターがない場合、Trend Line Map Proは機能しません。 ブログにアクセスすると、トレンドラインマップインジケーターの無料バージョンをダウンロードできます。 Metatrader Testerの制限なしで、購入する前に試してみてください。 :    ここをクリック 1.簡単になる利点 通貨と時間枠に基づいて売買シグナルを表示します。 チャートに矢印が表示されてから価格が増減したピップ数を評価します。 (トレンドスクリーナーインジケーター矢印) 信号のタイミングを表示します。 アラートを売買するための複数の時間枠と複数の通貨のアラートを取得します。 2.トレンドラインマップの使用方法 売買シグナルダッシュボードを表示す
通貨強度メーターは、現在どの通貨が強いか、どの通貨が弱いかをすばやく視覚的にガイドします。 メーターは、すべての外国為替クロスペアの強度を測定し、それらに計算を適用して、個々の通貨の全体的な強度を決定します。 28ペアのトレンドに基づいて通貨の強さに基づいて計算します。 MQL5ブログにアクセスすると、インジケーターの無料バージョンをダウンロードできます。 Metatrader Testerの制限なしで、購入する前に試してみてください: ここをクリック 1.ドキュメント すべてのトレンド通貨強度のドキュメント(手順)と戦略の詳細は、MQL5ブログのこの投稿で入手できます: ここをクリックしてください。 2.お問い合わせ ご不明な点がある場合やサポートが必要な場合は、プライベートメッセージでご連絡ください。 3.作成者 SAYADI ACHREF、フィンテックソフトウェアエンジニア、Finansyaの創設者。
すべてのトレーダーは、1 回の取引で 5% (または 7%) を超えるリスクを負ってはならないことを知っています。これはマネー管理の法則であり、トレーダーは異なる取引レベルに対して異なるストップロス値を使用する必要があるため、使用可能な LotSize を毎回計算する必要があります。このインディケータは、チャートに配置する瞬間に適切な LotSize を計算し、「ストップ ロス ライン」を任意の方向にドラッグするたびに計算します。 期間限定オファー: すべてのプレミアム インジケーターはわずか 50$ で利用できます。MQL5 ブログにアクセスすると、プレミアム インジケーターのすべての詳細を確認できます。ここをクリック。 入力 MAX_RISK_PER_TRADE - トレーダーがトレードごとにリスクを負うパーセンテージ。 CUSTOM_BALANCE - リスクの計算に使用される金額を定義します。 0 => 電卓は口座残高を使用します。 ENTRY_PRICE_LINE_COLOR - TP (テイクプロフィット) ラインの色 STOP_PRICE_LINE_COLO
私たちのインジケーターは、複数のペアのスプレッドを同時に監視するスプレッドスクリーナーを提供します。また、キャンドルタイマーのカウントダウンは、現在のバーが閉じて新しいバーが形成されるまでの残り時間を表示します。 期間限定オファー:すべてのプレミアムインジケーターはわずか50ドルでご利用いただけます。MQL5ブログにアクセスすると、プレミアムインジケーターのすべての詳細を確認できます。   ここをクリック。 主な機能 同時に広がるマルチペアを監視します。 現地時間ではなく、サーバー時間を追跡します。 構成可能なテキストの色とフォントサイズ CPU使用率を削減するために最適化 ペアのパーソナライズされたリスト。 コンタクト ご不明な点がある場合やサポートが必要な場合は、プライベートメッセージでご連絡ください。 警告 警告すべてのインジケーターとツールは、公式のMetatrader Store(MQL5 Market)からのみ入手できます。 著者 SAYADI ACHREF、フィンテックソフトウェアエンジニアおよびFinansyaの創設者
FREE
サポートとレジスタンススクリーナーは、1つのインジケーター内に複数のツールを提供するMetaTraderの1つのレベルインジケーターにあります。 利用可能なツールは次のとおりです。 1.市場構造スクリーナー。 2.強気のプルバックゾーン。 3.弱気プルバックゾーン。 4.デイリーピボットポイント 5.毎週のピボットポイント 6.毎月のピボットポイント 7.ハーモニックパターンとボリュームに基づく強力なサポートとレジスタンス。 8.銀行レベルのゾーン。 期間限定オファー:HVサポートおよびレジスタンスインジケーターは、50ドルと生涯でのみご利用いただけます。 (元の価格125 $) MQL5ブログにアクセスすると、分析例を含むすべてのプレミアム指標を見つけることができます。 ここをクリックしてください。 主な機能 ハーモニックおよびボリュームアルゴリズムに基づく強力なサポートおよびレジスタンスゾーン。 ハーモニックおよびボリュームアルゴリズムに基づく強気および弱気のプルバックゾーン。  市場構造スクリーナー 毎日、毎週、毎月のピボットポイント。 ドキュメント すべてのサ
トレンドとボラティリティアナライザーインジケーターを分析するカスタムMT5(メタトレーダー5)インジケーター。さらに、ほとんどの通貨ペアと時間枠で機能するトレンドの始まりと終わりを識別します。 結論として、ボラティリティアナライザーを追加することで、より正確になるようにスーパートレンドフォーミュラに基づいてコーディングしました。 信頼性の高いサポートとレジスタンスのインジケーターをお探しの場合は、オールインワンレベルのインジケーター(プルバックゾーン、強力なサポート/レジスタンスゾーン、市場構造スクリーナーなど)をお試しください。,  ここをクリック。 主な機能 トレンドの始まりと終わりを特定します。 トレンドの強さを簡単に特定します(最大増加と最大減少) 市場の修正を特定します。 (弱い傾向) Potentielトレンドが始まるとアラートを受け取ります。 アドバンテージ すべてのペア(外国為替、暗号、インデックス、コメディー)での作業 すべての時間枠での作業。 (推奨される時間枠:H1およびH4の時間枠) アラートジェネレータ。 (ポップアップアラート、
FREE
サポートとレジスタンススクリーナーは、1つのインジケーター内に複数のツールを提供するMetaTraderの1つのレベルインジケーターにあります。 利用可能なツールは次のとおりです。 1.市場構造スクリーナー。 2.強気のプルバックゾーン。 3.弱気プルバックゾーン。 4.デイリーピボットポイント 5.毎週のピボットポイント 6.毎月のピボットポイント 7.ハーモニックパターンとボリュームに基づく強力なサポートとレジスタンス。 8.銀行レベルのゾーン。 期間限定オファー:HVサポートおよびレジスタンスインジケーターは、50ドルと生涯でのみご利用いただけます。 (元の価格125 $) Metatrader Backtesterの制限なしでインジケーターを試してみませんか? デモ版をダウンロードするには、ここをクリックしてください。 主な機能     ハーモニックおよびボリュームアルゴリズムに基づく強力なサポートおよびレジスタンスゾーン。     ハーモニックおよびボリュームアルゴリズムに基づく強気および弱気のプルバックゾーン。     市場構造スクリーナー     毎日
ピン バー ディテクターは、チャート上のピン バーの価格行動パターンを見つけるインジケーターです。ピン バーは、「ピノキオ バー」のショートカットです。これは、ドラゴン フライ童子、墓石童子、ハンマー、倒立ハンマー、ハンギング マン、シューティング スターなど、上部または下部に高い影と非常に小さなボディを持つ、日本のローソク足に代わる古典的なバー パターンです。 . 期間限定オファー : インジケーターは、わずか 50 $ で生涯ご利用いただけます。 ( 元の価格 125$ ) 主な機能 強気のピンバー検出器。 弱気ピンバー検出器. 100% 無料インジケーター。 すべての時間枠で作業します。 すべてのペアで作業します。 コンタクト 質問がある場合、またはサポートが必要な場合は、プライベート メッセージでご連絡ください。 警告 すべてのインジケーターとツールは、公式のメタトレーダー ストア (MQL5 マーケット) からのみ入手できます。 プレミアム指標 MQL5 プロファイルにアクセスすると、すべての無料およびプレミアム インジケーターを見つけることがで
FREE
通貨強度メーターは、現在どの通貨が強いか、どの通貨が弱いかをすばやく視覚的にガイドします。 メーターは、すべての外国為替クロスペアの強度を測定し、それらに計算を適用して、個々の通貨の全体的な強度を決定します。 28ペアのトレンドに基づいて通貨の強さに基づいて計算します。 MQL5ブログにアクセスすると、インジケーターの無料バージョンをダウンロードできます。 Metatrader Testerの制限なしで、購入する前に試してみてください: ここをクリック 1.ドキュメント すべてのトレンド通貨強度のドキュメント(手順)と戦略の詳細は、MQL5ブログのこの投稿で入手できます: ここをクリックしてください。 2.お問い合わせ ご不明な点がある場合やサポートが必要な場合は、プライベートメッセージでご連絡ください。 3.作成者 SAYADI ACHREF、フィンテックソフトウェアエンジニア、Finansyaの創設者。
ピン バー ディテクターは、チャート上のピン バーの価格行動パターンを見つけるインジケーターです。ピン バーは、「ピノキオ バー」のショートカットです。これは、ドラゴン フライ童子、墓石童子、ハンマー、倒立ハンマー、ハンギング マン、シューティング スターなど、上部または下部に高い影と非常に小さなボディを持つ、日本のローソク足に代わる古典的なバー パターンです。 . 期間限定オファー : インジケーターは、わずか 50 $ で生涯ご利用いただけます。 ( 元の価格 125$ ) 主な機能 強気のピンバー検出器。 弱気ピンバー検出器. 100% 無料インジケーター。 すべての時間枠で作業します。 すべてのペアで作業します。 コンタクト 質問がある場合、またはサポートが必要な場合は、プライベート メッセージでご連絡ください。 警告 すべてのインジケーターとツールは、公式のメタトレーダー ストア (MQL5 マーケット) からのみ入手できます。 プレミアム指標 MQL5 プロファイルにアクセスすると、すべての無料およびプレミアム インジケーターを見つけることがで
FREE
私たちのインジケーターは、複数のペアのスプレッドを同時に監視するスプレッドスクリーナーを提供します。また、キャンドルタイマーのカウントダウンは、現在のバーが閉じて新しいバーが形成されるまでの残り時間を表示します。 期間限定オファー:すべてのプレミアムインジケーターはわずか50ドルでご利用いただけます。MQL5ブログにアクセスすると、プレミアムインジケーターのすべての詳細を確認できます。 ここをクリック。 主な機能 同時に広がるマルチペアを監視します。 現地時間ではなく、サーバー時間を追跡します。 構成可能なテキストの色とフォントサイズ CPU使用率を削減するために最適化 ペアのパーソナライズされたリスト。 コンタクト ご不明な点がある場合やサポートが必要な場合は、プライベートメッセージでご連絡ください。 警告 警告すべてのインジケーターとツールは、公式のMetatrader Store(MQL5 Market)からのみ入手できます。 著者 SAYADI ACHREF、フィンテックソフトウェアエンジニアおよびFinansyaの創設者
FREE
ブームおよびクラッシュスパイク検出器インジケーターは、主に価格のブームおよびクラッシュを検出するための高度な戦略に基づいてコーディングされています。 価格の高確率のブームとクラッシュを検出するために、複雑なアルゴリズムが組み込まれました。 ブームまたはクラッシュフェーズの可能性について警告します。 ブームフェーズ:価格の上昇が速すぎる場合。 クラッシュフェーズ:価格の低下が速すぎる場合。 期間限定オファー:インジケーターは30ドルと生涯でのみご利用いただけます。 主な機能 プッシュ通知を携帯電話に送信します コンピューターまたはラップトップでポップアップしてアラートを鳴らします 再描画されない矢印を表示します(潜在的なブームの場合は上向きの矢印、潜在的なクラッシュの場合は下向きの矢印) すべてのペアでの作業。 おすすめ 時間枠:H1およびH4 ペアの推奨:トレンドフェーズのペア。 コンタクト ご不明な点がある場合やサポートが必要な場合は、プライベートメッセージでご連絡ください。 著者 SAYADI ACHREF、fintechソフトウェアエンジニアお
ボラティリティ アナライザーはモメンタム インジケーターであり、タイトな取引範囲での値固め後に価格が大きく上昇する傾向を利用します。このインジケーターは、スクイーズが発火したときの動きの予想される方向を示すために、運動量オシレーターも使用します。このヒストグラムはゼロ ラインの周りで振動し、ゼロ ラインより上のモメンタムの増加はロングを購入する機会を示し、ゼロ ラインを下回るモメンタムはショートの機会を示す可能性があります。 期間限定オファー : インジケーターは、わずか 50 $ で無期限でご利用いただけます。 ( 元の価格 125$ ) 主な機能 横向きトレンド検出器。 低揮発性検出器。 強気の高値と弱気の高値のボラティリティ検出器。 すべての時間枠とすべてのペアで作業します。 ポップアップ アラートとプッシュ通知アラートを提供します。 コンタクト 質問がある場合、またはサポートが必要な場合は、プライベート メッセージでご連絡ください。 警告 すべてのインジケーターとツールは、公式のメタトレーダー ストア (MQL5 マーケット) からのみ入手できます
すべてのトレーダーは、1 回の取引で 5% (または 7%) を超えるリスクを負ってはならないことを知っています。これはマネー管理の法則であり、トレーダーは異なる取引レベルに対して異なるストップロス値を使用する必要があるため、使用可能な LotSize を毎回計算する必要があります。このインディケータは、チャートに配置する瞬間に適切な LotSize を計算し、「ストップ ロス ライン」を任意の方向にドラッグするたびに計算します。 期間限定オファー: すべてのプレミアム インジケーターはわずか 50$ で利用できます。MQL5 ブログにアクセスすると、プレミアム インジケーターのすべての詳細を確認できます。ここをクリック。 入力 MAX_RISK_PER_TRADE - トレーダーがトレードごとにリスクを負うパーセンテージ。 CUSTOM_BALANCE - リスクの計算に使用される金額を定義します。 0 => 電卓は口座残高を使用します。 ENTRY_PRICE_LINE_COLOR - TP (テイクプロフィット) ラインの色 STOP_PRICE_LINE_COLO
平均日次範囲は、特定の期間にわたって測定された外国為替ペアの平均ピップ範囲を示します。トレーダーはADRを使用して、平均的な1日の動き以外の潜在的な価格行動を視覚化できます。 ADRが平均を上回っている場合、それは毎日のボラティリティが通常よりも高いことを意味します。これは、通貨ペアがその基準を超えて拡大している可能性があることを意味します。 ADRアナライザーは5つの主要な機能で構成されています。 範囲(ADR)スクリーナー:複数通貨のADR分析。 ADRゾーン:ADRゾーンの価格ブームの外で日中に予想される市場範囲を示します。 Xバーゾーン:ユーザーが指定したXバーのX量のブレークを表示します。 毎日の高および低ゾーン:前日の高レベルまたは低レベルの休憩を識別します。 ウィークリーハイゾーンとローゾーン:週の休憩日ハイレベルまたはローレベルを識別します。 期間限定オファー:レンジアナライザーインジケーターは、50ドルと寿命でのみご利用いただけます。 (元の価格125 $) 主な機能 マルチ通貨スクリーナー。 ADRゾーンブレイクアウト すべてのタイプのアラート(ポップ
ブームおよびクラッシュスパイク検出器インジケーターは、主に価格のブームおよびクラッシュを検出するための高度な戦略に基づいてコーディングされています。 価格の高確率のブームとクラッシュを検出するために、複雑なアルゴリズムが組み込まれました。 ブームまたはクラッシュフェーズの可能性について警告します。 ブームフェーズ:価格の上昇が速すぎる場合。 クラッシュフェーズ:価格の低下が速すぎる場合。 期間限定オファー:インジケーターは30ドルと生涯でのみご利用いただけます。 主な機能 プッシュ通知を携帯電話に送信します コンピューターまたはラップトップでポップアップしてアラートを鳴らします 再描画されない矢印を表示します(潜在的なブームの場合は上向きの矢印、潜在的なクラッシュの場合は下向きの矢印) すべてのペアでの作業。 おすすめ 時間枠:H1およびH4 ペアの推奨:トレンドフェーズのペア。 コンタクト ご不明な点がある場合やサポートが必要な場合は、プライベートメッセージでご連絡ください。 著者 SAYADI ACHREF、fintechソフトウェアエンジニアお
平均日次範囲は、特定の期間にわたって測定された外国為替ペアの平均ピップ範囲を示します。トレーダーはADRを使用して、平均的な1日の動き以外の潜在的な価格行動を視覚化できます。 ADRが平均を上回っている場合、それは毎日のボラティリティが通常よりも高いことを意味します。これは、通貨ペアがその基準を超えて拡大している可能性があることを意味します。 ADRアナライザーは5つの主要な機能で構成されています。 範囲(ADR)スクリーナー:複数通貨のADR分析。 ADRゾーン:ADRゾーンの価格ブームの外で日中に予想される市場範囲を示します。 Xバーゾーン:ユーザーが指定したXバーのX量のブレークを表示します。 毎日の高および低ゾーン:前日の高レベルまたは低レベルの休憩を識別します。 ウィークリーハイゾーンとローゾーン:週の休憩日ハイレベルまたはローレベルを識別します。 期間限定オファー:レンジアナライザーインジケーターは、50ドルと寿命でのみご利用いただけます。 (元の価格125 $) 主な機能 マルチ通貨スクリーナー。 ADRゾーンブレイクアウト すべてのタイプのアラート(ポップ
ボラティリティ アナライザーはモメンタム インジケーターであり、タイトな取引範囲での値固め後に価格が大きく上昇する傾向を利用します。このインジケーターは、スクイーズが発火したときの動きの予想される方向を示すために、運動量オシレーターも使用します。このヒストグラムはゼロ ラインの周りで振動し、ゼロ ラインより上のモメンタムの増加はロングを購入する機会を示し、ゼロ ラインを下回るモメンタムはショートの機会を示す可能性があります。 期間限定オファー : インジケーターは、わずか 50 $ で無期限でご利用いただけます。 ( 元の価格 125$ ) 主な機能 横向きトレンド検出器。 低揮発性検出器。 強気の高値と弱気の高値のボラティリティ検出器。 すべての時間枠とすべてのペアで作業します。 ポップアップ アラートとプッシュ通知アラートを提供します。 コンタクト 質問がある場合、またはサポートが必要な場合は、プライベート メッセージでご連絡ください。 警告 すべてのインジケーターとツールは、公式のメタトレーダー ストア (MQL5 マーケット) からのみ入手できます
フィルタ:
fatambouzid
48
fatambouzid 2024.05.16 01:35 
 

This is one of the best indicators I have seen ! Multitimeframe trend analysis for selected currency pairs, with a clear trend summary information; currency strength information, plus a trend simulator so you can verify and set your expectations right in terms of TP that is proven by historical signals and success rate statistics, etc. I am using both MT5 and MT4 versions of the indicator as the main signal source for all my trades with a very high success rate for a a week now. From one single chart I have clear visibility to the current market conditions.

leroy
305
leroy 2024.05.15 18:57 
 

Great HTF Trend Tool! Thanks for creating this system!

Erik Jeske
131
Erik Jeske 2024.03.25 10:10 
 

I haven't tested the indicator properly yet. But I give 5 stars for the great support. My questions were answered in a short time. Problems were quickly resolved. Excellent.

STE S.S.COMPANY
286443
開発者からの返信 Sayadi Achraf 2024.04.15 02:33
Thank you for taking the time to write your review MR. Erik. We are here to offer all the necessary support for our customers. Since 2020, we have been working hard to keep improving our indicator to offer our customers the best indicator in the market to analyze market trends via many features. I invite you to check all the list of all our free and premium indicators here : https://www.mql5.com/en/users/sayadi_lancer/seller
zakim1984
44
zakim1984 2024.03.19 02:44 
 

I'm using trend screener since a couple of months both MT4 and MT5 versions and its really a great indicator! The author also is very responsive and helpful..

STE S.S.COMPANY
286443
開発者からの返信 Sayadi Achraf 2024.03.19 02:48
Thank you so much sir , for your honest review and your kind words! You dont know how happy i am really you made my day! I wish you more success in your trading! The Trend Screener is the best All-In-One Trend Indicator ! I am really glad that i help and that I could bring some positivity in you trading in general! thank you so much again!
tunsam61
32
tunsam61 2024.03.19 02:01 
 

The trend screener is one of the best indicators in the market if followed correctly. I've had the indicator for 3 days and has greatly helped my ability to predict the market. The developer has excellent customer support and always willing to go extra mile to satisfy his customers and answer any questions. I will recommend this product for anyone who is interested in making money from the financial market.

STE S.S.COMPANY
286443
開発者からの返信 Sayadi Achraf 2024.03.19 02:58
Hi sir, Thank you for taking time to write your review. If you see the trend summary always Up Trend it means that you're MT4 is missing historical data. The trend summary will not give up trend for 15 instruments always. There is something wrong with the installation. I'm sending you now a private message asap to check this issue with you and assisting you to fix it and explain to you the best way to use trend screener indicator because you need to use the trend line for short terms trend and trend summary, just as a filter.
———————
Update: Can you check your private message please? I just sent you a message to assist you from there and ensure that you don’t get confused. Please let me know your feedback sir.
19990228
34
19990228 2024.02.22 14:02 
 

すごく良いシステムだと思いました。 こちら矢印が出た時のアラート機能などあるのでしょうか?

STE S.S.COMPANY
286443
開発者からの返信 Sayadi Achraf 2024.02.22 14:13
Hi sir, Thank you for your review. I'm happy to know that you found our indicator an excellent Smart trend indicator that can assist you in analyzing the Properly market trend and improving your trade accuracy. I'm sending you now a private message to assist you from there.
burnoutnorthbowl1
55
burnoutnorthbowl1 2024.01.22 21:33 
 

I purchased this indicator only a few days ago and I can already tell it is very powerful if used correctly. Now I am going to get the map add on.

STE S.S.COMPANY
286443
開発者からの返信 Sayadi Achraf 2024.01.25 21:19
Thank you soo much for the honest review and the kind words.
We are working day and night to create the best advanced and professional tools in the market. That's the goal here and we can get there only if our standards are held high and professional as well!
Please have a good and safe trading.
DanyLbc747
756
DanyLbc747 2024.01.18 13:08 
 

I purchased Trend Screener based on reviews. I was a bit skeptical. Ultimately, this is by far the most used product I have ever used. The first month I tested it on a demo and today it's been more than 1.5 months that I've been using it daily on a live account. I wasn't as profitable before as I am now. I like to test other products as well, but this one captivated me already during the demo testing. The uniqueness is such that each trader will find his own way according to his style, whether it is scalping, day or swing trading. In essence, only this product is enough for you and you are taken care of. The author is very helpful. After the purchase, I also had a video call with him, where he explained the important steps. The author is above all human-friendly. Thank you for this product and a job well done by the author and his team.

STE S.S.COMPANY
286443
開発者からの返信 Sayadi Achraf 2024.01.18 16:55
Thank you for taking the time to write your review, sir. I'm doing my best to offer the best analytics tools for my customers. My customer's satisfaction is always my top priority. Have a good and safe trading, sir.
Victor L
63
Victor L 2024.01.11 17:23 
 

A wonderful discovery. This tool indicator offers multiple feedback features to alert how the market is moving and enables probable actions one could take. The continuous process instills confidence. The 1x1 service support from Sayadi surely makes it better.

Iulius65
152
Iulius65 2024.01.04 18:21 
 

I bought this amazing indicator three days ago, in this moment I just study how can I better use this tool. I intuit that after I discover how to use it, will have good return in manual trading. From now I am very enthusiastic.

smallwood1988
64
smallwood1988 2023.12.29 16:37 
 

Amazing Indicator, Author so helpfull and understanding. Worth the purchase

STE S.S.COMPANY
286443
開発者からの返信 Sayadi Achraf 2023.12.29 17:14
Thank you for taking the time to write your review. I'm happy to know that you found our indicator a good indicator to use during your trading and analyzing market trends with our smart scanner. -- Please have a good and safe trading.
SUYANTO_SE
161
SUYANTO_SE 2023.12.27 16:20 
 

Excellent product and prompt support. Highly recommend to have this indicator c/w Trend Line Map Indicator. Thank you very much Mr. Sayadi

hari2007
19
hari2007 2023.12.22 11:15 
 

Everything is good but wanted to check will this indicator works in autotrading using mt2trading and mx2trading for binary trading does it takes trades automatically following trendscreener indicator what are settings i need to do please help

STE S.S.COMPANY
286443
開発者からの返信 Sayadi Achraf 2023.12.22 12:14
Hi sir, Thank you for taking the time to write your review. I'm happy to know that you find our trend indicator as a good indicator to use it in your daily trading and analyzing market trends.
---
I'm sending a PM to check more details about what you want to achieve exactly.
Ferdinand Amahan
123
Ferdinand Amahan 2023.12.17 23:57 
 

One of the best TREND INDICATOR in the market. Highly recommended for seasoned and newbie alike..

Syed Nazer Abbas Rizvi
323
Syed Nazer Abbas Rizvi 2023.11.29 16:03 
 

30m , 1H and 4H are very strong signals using Trend Screener, very useful and profitable.

STE S.S.COMPANY
286443
開発者からの返信 Sayadi Achraf 2023.11.29 16:41
We are incredibly grateful for your review and sharing your trading exprience. Your feedback is invaluable as we strive to craft the most advanced and professional trend indicator in the market. This is our unwavering goal, and we can only achieve it by maintaining the highest standards of professionalism and give the best support for our customers. Have a good and safe trading,sir.
Mark Vaines
1821
Mark Vaines 2023.11.24 02:39 
 

useful

STE S.S.COMPANY
286443
開発者からの返信 Sayadi Achraf 2023.11.24 10:29
Thank you so much for your review! I'm happy to know that you find our indicator as a useful trend indicator. The main purpose of offering more than 13 premiums tools and features is to make our indicator useful as much as possible for customers and assist them in analyzing market trends properly..
Michael Mic
58
Michael Mic 2023.11.23 11:56 
 

Very good indicator! I use it all the time in my trading. Sayadi is very helpful if any ajustment or problem ect. Could not ask for more! Thanks Sayadi.

STE S.S.COMPANY
286443
開発者からの返信 Sayadi Achraf 2023.11.24 10:28
Thank you so much for your honest review! The main idea behind our indicator is to provide a trend indicator that provides more than 13 tools and features all optimized to work together and perform to the highest standard in analyzing market trends! I wish that I could add value to your trading and I wish you all the success! I'm always available to provide all necessary support. Thank u.
kw_mt4
290
kw_mt4 2023.11.22 19:35 
 

Good tool for trading multi pairs. Seller also very responsive and helpful with feedback.

STE S.S.COMPANY
286443
開発者からの返信 Sayadi Achraf 2023.11.23 10:44
Thank you so much sir, for your honest review and your kind words!
You don't know how happy because you found our indicator as a good tool! I wish you more success in your trading!
Irfan
1010
Irfan 2023.11.22 06:50 
 

This is an excellent indicator with very good accuracy. Combine it with pull back signal from Support resistance indicator from same developer and trade in trend direction yield good result. Support is excellent.

budidharma1969
201
budidharma1969 2023.11.20 11:58 
 

Hello Sayadi,... Just bought your indicator,... very nice,... Some questions : 1. What TF you prefer to trade ? 2. What TF you prefer to fix the indicator ? Thanks for your kindly attentions, Budi Dharma

STE S.S.COMPANY
286443
開発者からの返信 Sayadi Achraf 2023.11.20 12:25
Dear Mr. Budi , Thank you for taking the time to write your review and I'm happy to know that you found our indicator very nice and helpful.
---
I'm writing you now ASAP to assist you further. Best regards.
SAYADI ashref.
レビューに返信
バージョン 21.10 2024.06.03
1. Improve signal quality.
2. Add Trend line period.
バージョン 20.10 2023.11.29
1. Change the Trend Scanner Layout by giving more flexibility in configuration to hide and display every column.
2. Add inputs to change timeframes for every column.
3. Optimize Trend breakout alerts and trend reversal alerts.
4. Add a period for the scanner to be adjusted for faster or slower trend calculation.
5. Change trend lines layout.
6. Optimize indicator setting.
7. Increase Scanner speed.
バージョン 19.21 2023.05.29
1. Fixing Spelling mistakes.
バージョン 19.20 2023.05.26
1. Optimize indicator speed.
2. Improve Trend CSM algorithm.
3. Improve Trend reversals dots.
4. Improve Strong Trend dots.
バージョン 19.3 2022.12.06
1. Improve indicator Speed for calculation with missing data.
バージョン 19.0 2021.08.29
1. Updating Alerts.
バージョン 18.1 2021.08.27
1. Adjusting signals design.
バージョン 18.0 2021.08.27
1. Add Strong Trend Signals.
2. Add Reversal Trend Signals.
3. Optimizing Trend Algorithm.
4. Add Scalper TP similator.
バージョン 16.30 2021.06.07
1. Optimizing Trend Dashboard for small timeframes.
バージョン 16.21 2021.05.08
1. Optimizing indicator speed.
バージョン 16.20 2021.04.18
1. Fixing issue with ultimate Screener EA.
バージョン 16.10 2021.04.18
1. Add support for Trend Screener Ultimate.
バージョン 16.0 2021.03.19
1. Add support to swing stoploss for Trend screener EA.
バージョン 15.80 2021.01.06
1. Add support to Trend Turbo EA
バージョン 15.60 2020.10.01
1. Add backtesting feature / Demo testing in the market.
バージョン 15.51 2020.08.22
1. Setting optimization.
バージョン 15.50 2020.08.22
1. Optimizing Suffix and prefix displaying.
バージョン 15.0 2020.07.29
1. Fixing the issue of Suffix / Current Chart Mode.
2. Buffers optimization for Eas.
3. Adjusting the default setting.
バージョン 13.0 2020.06.15
1. Fixing Fuzzy logic score issue in version 12.00.
バージョン 12.10 2020.06.07
Updates :

1. Add new Alert time ( GMT Or BROKER SERVER TIME or Local Computer time ).
2. Add Parameter to define Frequency of the Screener updating. ( Seconds )
3. Add Pairs manager: Display Screener based on Current Chart OR Display Screener based on Custom pairs List.
4. Hide - display button for the Success Rate Simulator.

Fixed issues :
1. Correcting button names.


バージョン 11.10 2020.04.18
1. Add a Spread feature.
バージョン 11.0 2020.04.14
1. Add enable-disable Button based on Customers requests.
バージョン 10.1 2020.04.09
1. Changing the default setting.
バージョン 10.0 2020.04.06
1. Add EAs Supporting with 3 methods.
バージョン 9.2 2020.04.01
1. Fixing issue with the default setting.
バージョン 9.1 2020.03.31
1. Optimization of Stoploss calculator.
バージョン 9.0 2020.03.31
1. Optimizing trend line signal.
バージョン 8.1 2020.03.19
1. Optimizing CSM updating timing.
2. Add enable-disable CSM.
バージョン 8.0 2020.03.17
1. Add Currency Strength Meter
バージョン 7.3 2020.03.13
1. Add Prefix and Suffix for pairs like "EURUSD.c"...etc.
バージョン 7.2 2020.03.10
1. Fixing display Success rate simulator.
バージョン 7.1 2020.03.07
1. Adjusting default colors.
バージョン 7.0 2020.03.07
1. Optimizing Fuzzy logic algorithm and Strong Trend identification.
2. Optimizing Alert generating in Strong Trend and Normal Trend.
3. Add feature to display trading type recommendation in Success Rate Simulator.
4. Add Max bars to Run Success Rate Simulator.
バージョン 6.11 2020.03.01
1. Correcting some spelling mistakes.
バージョン 6.10 2020.03.01
1. Add Hide-Display Second Box
バージョン 6.0 2020.03.01
1. Add TP levels and SL per level.
2. Add 2 options for Takeprofit
2.1 Floating TP with three Ratio.
2.2 TP simulator to find the best TP with the best success rate.
3. Add Chart change via Button in Trend Screener.
4. Optimizing button click event.
バージョン 5.50 2020.02.27
1. Add Arrows color feature.
バージョン 5.2 2020.02.26
1. Optimization refresher.
バージョン 5.1 2020.02.26
1. Fixing a refreshing issue.
バージョン 5.0 2020.02.25
1. Add max profit feature.
2. Optimizing trend line drawing.
バージョン 4.0 2020.02.21
1. Add Alerts Filters.
2. Add List of pairs to display all Currencies in the same charts.
3. Add metals, indices supporting.
バージョン 3.0 2020.02.20
1. Add symbols automatically to the MT4 MarketWatch.
バージョン 2.0 2020.02.16
1. Optimizing trend calculation.
2. Add Alerts features.
バージョン 1.70 2020.02.13
Fixing the EURUSD calculation issue.
バージョン 1.60 2020.02.13
1. Optimizing Fuzzy logic calculation.