Powerful Strength Meter
- インディケータ
- Andrey Kozak
- バージョン: 1.0
- アクティベーション: 20
Powerful Strength Meter - a trend direction indicator. The indicator measures the strength of the trend and shows the trader
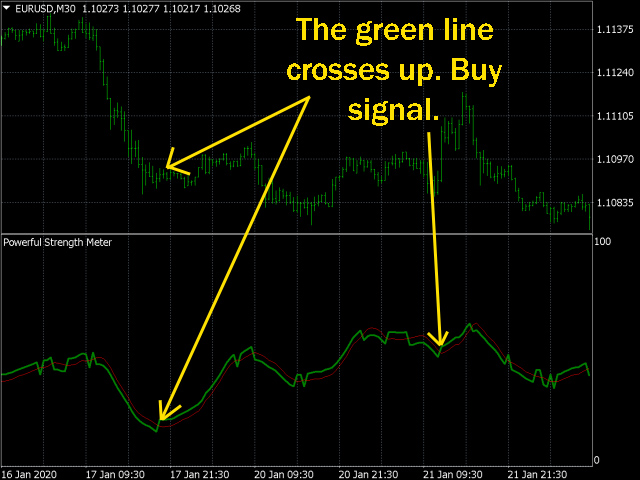
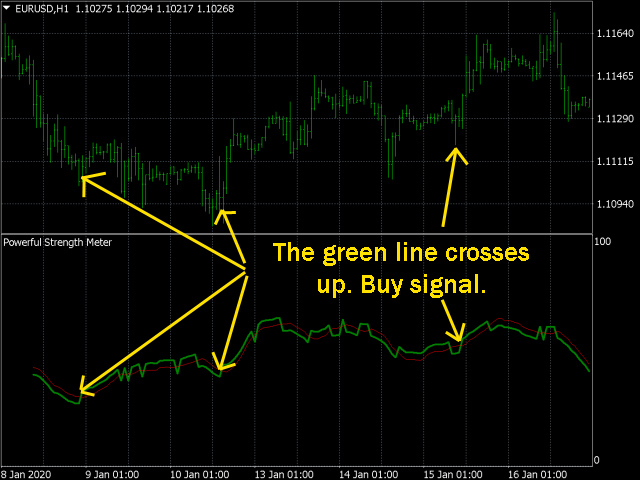
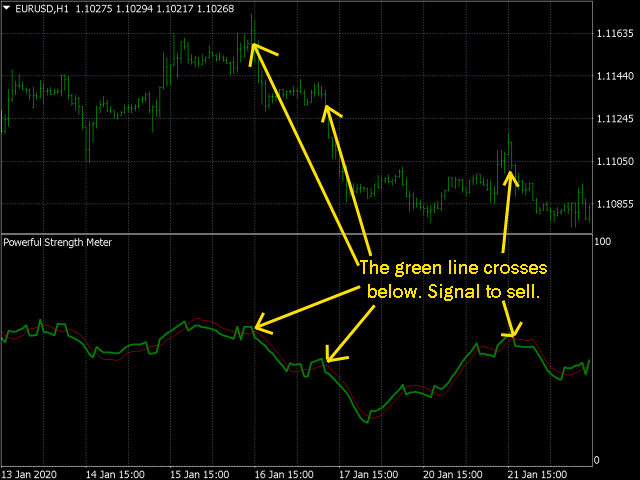
signals in the form of two lines: red and green. Indicator signals are very easy to read. If the green line crosses the red line up - this is a
buy signal. This means that now the price will go up. If the green line crosses the red line from top to bottom - this is a sell signal. The
larger the time frame, the more accurate the indicator signals. You can also, for example, place the indicator on the H1 chart, and
specify the M5 timeframe in the settings. The indicator will show the values from the five-minute timeframe on the hourly timeframe.
So you can simultaneously watch the indicator signals on different timeframes on the same chart. This is especially useful when
trading on a scalping system. You can watch different time frames at the same time.
Powerful Strength Meter is an indicator of trend strength. It measures the strength of the trend over an average period of time
and displays information to the trader in the form of two lines in a separate chart window. The indicator will be very useful for all
traders and beginners and professionals.
It shows: price pivot points, price direction, trend strength. And you can see all this information using one indicator.
Powerful Strength Meter Settings:
- Smoothing - the average value of the trend movement strength.
- period - averaging period.
- TimeFrame - indicate the timeframe from which we want to see the information.
- bars - the number of bars on which the indicator will be displayed.


















an excellent indicator - a bit of a laggard but makes up by giving out accurate and not false signals, hence a very good confirming indicator. Combined it with a fast responsive currency meter or HLOC for defining mid term trends and you have a good combo. a keeper for me.