Market Momentum
- インディケータ
- Flavio Javier Jarabeck
- バージョン: 1.3
- アップデート済み: 18 7月 2023
The Market Momentum indicator is based on the Volume Zone Oscillator (VZO), presented by Waleed Aly Khalil in the 2009 edition of the International Federation of Technical Analysts journal, and presents a fresh view of this market valuable data that is oftenly misunderstood and neglected: VOLUME. With this new approach of "seeing" Volume data, traders can infer more properly market behavior and increase their odds in a winning trade.
"The VZO is a leading volume oscillator; its basic usefulness is in giving leading buy/sell signals based on volume conditions, also to identify overbought/oversold volume conditions, along with mega overbought/oversold situations which lead to a change in sentiment, and most probably, leads to change of the current trend in the timeframe being studied."
"Price is preceded by volume; that’s another important idea in technical analysis. If volume starts to decrease in an uptrend, it is usually a sign that shows that the upward run is about to end."
"We believe that volume should have the same importance as price and should be monitored closely."
"One of the main benefits of the VZO is primarily being able to identify in which zone the volume is positioned, to decide which side we should ride on."
-- Waleed Aly Khalil
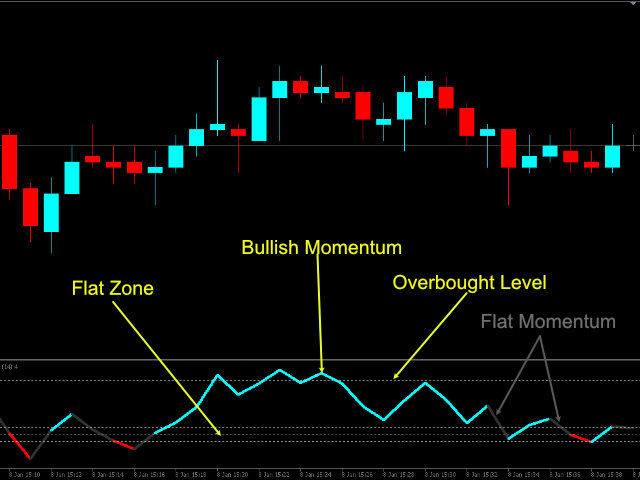
The Market Momentum indicator visually guides traders when the market is above or below the ZERO-line, indicating the probable "side" of the market. You can adapt when the indicator will color the oscillator lines changing the "Flat" values.
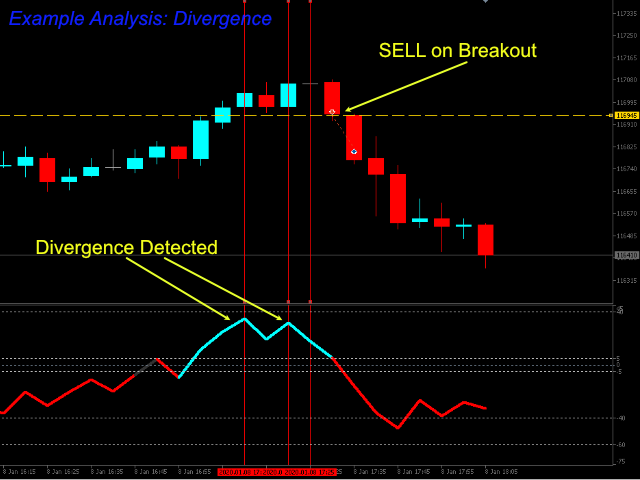
You can also test the theory of the crossing of the Overbought and Oversold thresholds. Or, entering the Zones and paying attention when the oscillator leaves the Zones, watching for divergencies, etc...
I highly recommend the reading of the IFTA article to get additional knowledge about the potential of this indicator.
Enjoy!
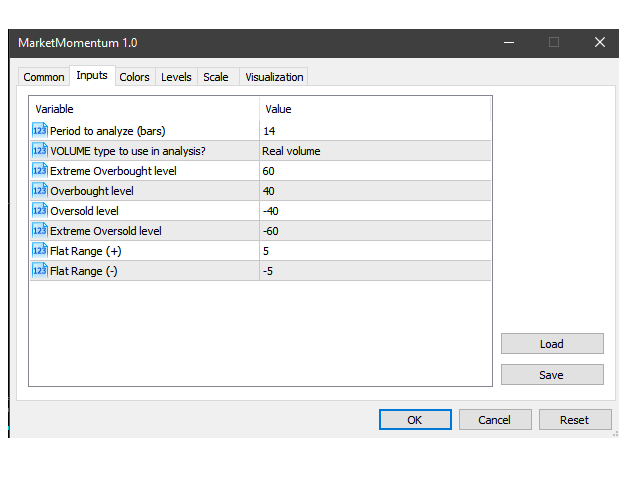
SETTINGS
- Analysis Period (bars)
- Volume Type to Analyze (Ticks or Real Volume)
- Sub-window indicator Levels for Overbought, Extreme Overbought, Oversold, Extreme Oversold and Flat Levels.
- All the optimal settings will depend solely on the analysis over the Symbol and the Timeframe you intend to trade.
- This is a great indicator, but it is NOT Magical. Use it with other tools/analysis to increase the odds of your trade.
- If you already know the power of VZO analysis and need more... Take a Look at the Market Momentum PRO here...
If you like this indicator, all I am asking is a little Review (not a Comment, but a REVIEW!)...
This will mean A LOT to me... And this way I can continue to give away Cool Stuff for Free...
With No Strings Attached! Ever!
Live Long and Prosper!
;)


ok