• 概要
  • レビュー (6)
  • コメント (1)
  • 最新情報

DollarAndEuroIndex

4.83

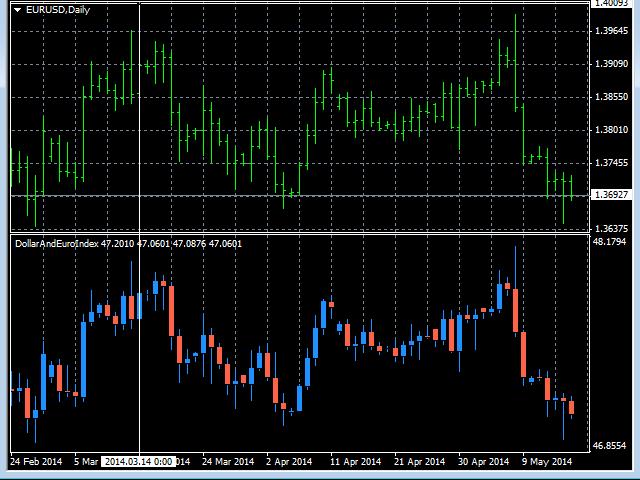
This is an extension of the previous published DollarIndex with the addition of the function for calculating EURO Index under ICE Formula.

Note that the broker should provide the following data:

  • For Dollar Index formula, EURUSD, USDJPY, GBPUSD, USDCAD, USDSEK and USDCHF are needed.
  • For Euro Index formula, EURUSD, EURGBP, EURSEK and EURCHF are needed.

Now in this version if the SEK (the most uncommon) is not provided, the formula still works, since it adds 0.0001 to its value, but the index will be less accurate.

Also note that EURO index was de-listed starting from May 20 2011, so its accuracy is unknown for me due to lack of reference.

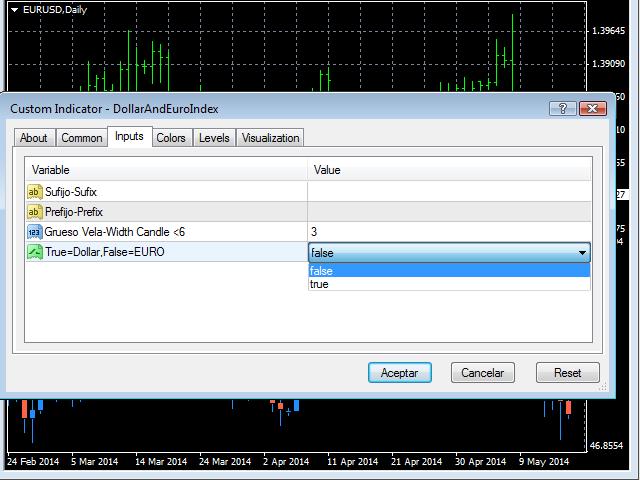
The way to call the indicator for USD is setting the field True=Dollar,False=EURO to False as showed in the pic.

If your broker inserts a prefix before the currency pair name, use Prefix field and write exactly what the broker adds. For example, if the broker adds FX- before EURUSD pair name (FX-EURUSD), add FX- here.

If your broker inserts a suffix after the currency pair name, use Sufix field and write exactly what the broker adds. For example, if the broker adds m after EURUSD pair name (EURUSDm), add m here.

Some slight inaccuracy could be displayed in the values of the pair due to the decimal use and pair valuation, so trading Dollar Index is not recommended. However, if you use the indicator as a reference, it will suit your needs well.

レビュー 6
Valentin Butorin
4123
Valentin Butorin 2020.10.18 12:37 
 

Thanks for sharing.

Alberto Oliver
134
Alberto Oliver 2018.10.19 23:31 
 

Excelent indicator, generates a very precise EURX chart, congrats paisano.

amfels07
493
amfels07 2017.06.05 06:10 
 

Great work Sergio.......... appreciate your efforts on this good indicator sir.......Best of luck!

おすすめのプロダクト
Max LotSize
Luis Alberto Atuncar Sanchez
5 (3)
LotSize Indicator Discover the appropriate lot size to use in your trades based on the available margin. This indicator provides valuable information for risk management. If the indicator shows a value of 0, it means that your balance or available margin is insufficient for trading. It is important to maintain adequate margin levels for safe trading practices. This indicator is exclusively designed for the MT4 platform, a popular and reliable trading platform in the market. With the LotSize Indi
FREE
Reversal Monster Mini
Abdulfattah Yahya Mohammed Alhazmi
The Most advanced and comprehensive EA to trade Trend Reversals/Pullbacks It is a very profitable EA, to trade trends breakout, and manage trades, takeprofit, stoploss, move to breakeven, and trailing stop. The   “Reversal Monster EA”   trades Reversal/Pullbacks when the current price of the pair pullback to a predefined horizontal level or trendline on the currency chart. The opening of the position can be immediate after pullback to the drawn trendline or after closing the candle below/abov
FREE
トレンドキャッチャー: アラートインジケーター付きのトレンドキャッチャーストラテジーは、市場トレンドやポテンシャルなエントリーポイントやエグジットポイントを特定するのに役立つ多目的な技術分析ツールです。動的なトレンドキャッチャーストラテジーを備えており、市場状況に適応してトレンドの方向を明確に視覚化します。トレーダーは、自身の好みやリスク許容度に合わせてパラメーターをカスタマイズできます。このインジケーターはトレンドの識別を支援し、ポテンシャルなリバーサルをシグナルし、トレイリングストップのメカニズムとして機能し、市場への迅速な対応のためのリアルタイムアラートを提供します。 特徴: - トレンドの識別:上昇トレンドと下降トレンドをシグナルします。 - トレンドのリバーサル:ローソク足の色が上昇から下降に変わった場合やその逆の場合に、ポテンシャルなリバーサルを警告します。 - リアルタイムアラート:新しいトレンドの識別に対するアラートを生成します。 推奨事項: - 通貨ペア:EURUSD、AUDUSD、XAUUSDなど... - タイムフレーム:H1。 - アカウン
FREE
Vanexio
Sayan Vandenhout
VANEXIO USES THE TREND WAVE INDICATOR AND IT CAN IDENTIFY THE BEGINNING AND THE END OF A NEW WAVE TREND MOVEMENT. AS AN OSCILLATOR, THE INDICATOR IDENTIFIES THE OVERBOUGHT AND OVERSOLD ZONES. IT WORKS GREAT TO CATCH THE SHORT TERM PRICE REVERSALS AND USES A MARTINGALE STRATEGY TO CLOSE ALL TRADES IN PROFIT. USE DEFAULT SETTINGS ON H1 OR HIGHER TIME FRAME ON ANY PAIR FOR MORE ACCURATE TRADES WHY THIS EA : Smart entries calculated by 5 great strategies The EA can be run on even a $20000
FREE
Expert.   Automatic and manual trading. Ready-made trading system based on   Elliott waves   and Fibonacci retracement levels . It is simple and affordable. Display of the marking of Elliott waves (main or alternative option) on the chart. Construction of horizontal levels, support and resistance lines, a channel. Superposition of Fibonacci levels on waves 1, 3, 5, A Alert system (on-screen, E-Mail, Push notifications).    visual panel for opening orders in manual trading. visual panel for sett
Market Profile 3
Hussien Abdeltwab Hussien Ryad
4 (4)
Market Profile 3 MetaTrader 4 indicator  — is a classic Market Profile implementation that can show the price density over time, outlining the most important price levels, value area, and control value of a given trading session. This indicator can be attached to timeframes between M1 and D1 and will show the Market Profile for daily, weekly, monthly, or even intraday sessions. Lower timeframes offer higher precision. Higher timeframes are recommended for better visibility. It is also possible t
FREE
MASi Three Screens is based on the trading strategy by Dr. Alexander Elder. This indicator is a collection of algorithms. Algorithms are based on the analysis of charts of several timeframes. You can apply any of the provided algorithms. List of versions of algorithms:     ThreeScreens v1.0 - A simple implementation, with analysis of the MACD line;     ThreeScreens v1.1 - A simple implementation, with analysis of the MACD histogram;     ThreeScreens v1.2 - Combines the first two algorithms
FREE
This is an arrow indicator without a future function,developed based on the most advanced profit trading algorithms.It has the most innovative and advanced dual trend analysis module, as well as the latest and highly effective market trend prediction algorithm.Trends are your friends, and following larger trends can earn the maximum profit in foreign exchange. This indicator helps traders identify current trends and track them. Someone once made a profit of 10 times in a week by relying on it.No
Candle EA MT4
Mansour Babasafary
4.42 (48)
This expert is based on patterns The main patterns of this specialist are candlestick patterns Detects trends with candlestick patterns It has a profit limit and a loss limit, so it has a low risk The best time frame to use this expert is M30 time frame The best currency pairs to use with this expert is the EURUSD, GBPUSD, AUDUSD, USDCAD currency pairs Attributes: Can be used in the EURUSD, GBPUSD, AUDUSD, USDCAD  currency pairs Can be used in M30, H1, H4 time frames Has profit limit an
TrendPlus
Sivakumar Subbaiya
4.21 (14)
Trend Plus   Trendplus  Indicator   Time Frame: Suitable for any time frame.  Purpose: Trend Prediction. Blue and red candle indicate the buy and sell call respectively. Buy: When the blue candle is formed buy call is initiated. close the buy trades when the next red candle will formed.   Sell: When the Red candle is formed Sell call is initiated. close the Sell trades when the next blue candle will formed.   Happy trade!!
FREE
Introducing the "Magic Trades" for MetaTrader 4 – your ultimate tool for precision trading in dynamic markets. This innovative indicator revolutionizes the way you perceive market trends by harnessing the power of advanced analysis to detect subtle changes in character, paving the way for optimal trading opportunities. The Magic Trades Indicator is designed to empower traders with insightful entry points and well-defined risk management levels. Through its sophisticated algorithm, this indica
New version 8.00 is available. In this version, I tried to take into account the wishes of the user. Each of you can also take part in the improvement of this advisor. In the default settings, the adviser opens trades when the extremum point is broken       standard indicator       Zigzag. When the upper point of the zigzag extremum is broken, it opens a buy deal, and when the lower point of the zigzag extremum is broken, it opens a sell deal. In addition to the standard ZigZag indicator, whi
FREE
Discover the power of precision and efficiency in your trading with the " Super Auto Fibonacci " MT4 indicator. This cutting-edge tool is meticulously designed to enhance your technical analysis, providing you with invaluable insights to make informed trading decisions. Key Features: Automated Fibonacci Analysis: Say goodbye to the hassle of manual Fibonacci retracement and extension drawing. "Super Auto Fibonacci" instantly identifies and plots Fibonacci levels on your MT4 chart, saving you tim
FREE
Diamond PRO
Fanur Galamov
4.83 (18)
Diamond PRO is enhanced powerful version of Diamond for advanced traders. Pro version includes optimized cores, new impoved entry points filters, new multistage profit closure algorithm and сontains number of external control parameter that allows build and fine tune own tradind decisions and algorithms. The system provides more accurate market entries, analyzes and filters upcoming economic news, contains spread protection and an advanced position management algorithm. Main goal of Diamond PRO
Add indicator "Symbol Name Drawer " on chart. Indicator creates text object with name of current symbol. You can change symbols on chart and indicator automatically changes text. Free to use. Simple tool. If you have any suggestion you can write me about it in comments. I try to improve this tool in future versions. Thanks for using my indicator. If you want to order something special in mql4 or mql5 message.
FREE
GoldRushPro
Yuri Congia
4.5 (18)
GoldRushProEX: The Ultimate Trading Companion Welcome, Traders and Investors! Embark on an unparalleled trading journey with "GoldRushProEX" – your ultimate trading companion designed to navigate the complexities of the financial markets with precision and efficiency. In this comprehensive guide, we unveil the intricate workings of this cutting-edge trading tool, meticulously crafted to elevate your trading strategy to new heights. now on the market for FREE worldwide: Don't forget to visit m
FREE
Follow The Line
Oliver Gideon Amofa Appiah
4.07 (14)
FOLLOW THE LINE GET THE FULL VERSION HERE: https://www.mql5.com/en/market/product/36024 This indicator obeys the popular maxim that: "THE TREND IS YOUR FRIEND" It paints a GREEN line for BUY and also paints a RED line for SELL.  It gives alarms and alerts of all kinds. IT DOES NOT REPAINT and can be used for all currency pairs and timeframes. Yes, as easy and simple as that. Even a newbie can use it to make great and reliable trades. NB: For best results, get my other premium indicators for more
FREE
Introduction to Chart Pattern MT Chart Pattern MT is a chart pattern scanner to detect the triangle pattern, falling wedge pattern, rising wedge pattern, channel pattern and so on. Chart Pattern MT uses highly sophisticated chart pattern detection algorithm. However, we have designed it in the easy to use with intuitive user interface. Chart Pattern MT will show all the patterns in your chart in the most efficient format for your trading. You do not have to do tedious manual pattern detection an
The Arrow Scalper
Fawwaz Abdulmantaser Salim Albaker
1 (2)
Dear Friend..  I share with you this simple Expert Adviser .. it is full automatic  this Expert Adviser following the trend of the pair you install on or any stocks or indices , it is works like that: - when the trend on H4 chart show a start of up trend the expert will wait till the 15M & 1H charts show an up trend the EA will open a buy order directly , and do the same for down trend and open a sell order the buy or sell  order lot size and take profit and stop loss will measured manually  by
FREE
Trend PRO Expert Advisor  is developed base on the PipFinite Trend PRO Indicator, the best indicators on the market so far. PipFinite  Trend Pro's smart algorithm detects the trend, filters out market noise and gives entry signals with exit levels.  This EA open order when the indicator has buy/sell signals and set SL/TP follow the indicator rules. You can read more information about PipFinite Trend PRO indicator  here . Important Information   This EA will only work if you purchased  PipFin
価格波形パターン MT4へようこそ --(ABCD パターン)--     ABCD パターンは、テクニカル分析の世界で強力で広く使用されている取引パターンです。 これは、トレーダーが市場での潜在的な売買機会を特定するために使用する調和的な価格パターンです。 ABCD パターンを使用すると、トレーダーは潜在的な価格変動を予測し、いつ取引を開始および終了するかについて十分な情報に基づいた決定を下すことができます。 EA バージョン :   Price Wave EA MT4 MT5バージョン: Price Wave Pattern  MT5 特徴 :  ABCDパターンの自動検出。 強気パターンと弱気パターン。  任意のシンボルと任意の時間枠で機能します。 主要なレベルと価格目標。 カスタマイズ可能な設定と繊維レベルの調整。 アラートと通知。 今後さらに多くの機能が追加される予定です。 
FREE
Free automatic Fibonacci is an indicator that automatically plots a Fibonacci retracement based on the number of bars you select on the BarsToScan setting in the indicator. The Fibonacci is automatically updated in real time as new highest and lowest values appears amongst the selected bars. You can select which level values to be displayed in the indicator settings. You can also select the color of the levels thus enabling the trader to be able to attach the indicator several times with differe
FREE
The indicator shows the potential trend direction by cyclical-wave dependence. Thus, all the rays of the intersection will be optimal rays, in the direction of which the price is expected to move, taking into account the indicator period. Rays can be used as a direction for potential market movement. But we must not forget that the approach must be comprehensive, the indicator signals require additional information to enter the market.
Awesome Oscillator by Bill Williams with the ability to fine-tune and replace the averaging algorithms of the indicator, which significantly expands the possibilities of using this oscillator in algorithmic trading and brings it closer in its properties to such an indicator as the MACD. To reduce price noise, the final indicator is processed with an additional Smooth averaging. The indicator has the ability to give alerts, send mail messages and push signals when the direction of movement of th
This is a new strategy for SUPPLY DEMAND areas It is based on a calculation using the tick volume to detect the big price action in market for both bear /bull actions this smart volume action candles are used to determine the supply and demand areas prices in between main supply and demand lines indicate sideway market  up arrows will be shown when prices moves above the main supply and the secondary supply lines Down arrows will be shown when prices moves below the main demand and the secondary
これは、キャンドルの終値を予測する指標です。 このインジケータは、主にD1チャートでの使用を目的としていますが. この指標は、従来の外国為替取引とバイナリオプション取引の両方に適しています。 インジケーターは、スタンドアロンのトレーディングシステムとして使用することも、既存のトレーディングシステムへの追加として機能させることもできます。 このインジケーターは、現在のキャンドルを分析し、キャンドル自体の内部の特定の強度係数と、前のキャンドルのパラメーターを計算します。 したがって、この指標は、市場の動きのさらなる方向性と現在のキャンドルの終値を予測します。 この方法のおかげで、この指標は、短期の日中取引だけでなく、中期および長期の取引にも適しています。 インジケーターを使用すると、市場の状況の分析中にインジケーターが生成する潜在的な信号の数を設定できます。 インジケーターの設定には、このための特別なパラメーターがあります。 また、インジケーターは、チャート上のメッセージの形式で、電子メールで、およびPUSH通知の形式で、新しい信号について通知することができます。 購入後は必ず私に書いて
Free informative Indicator-helper. It'll be usefull for traders who trade many symbols or using grid systems (Averaging or Martingale). Indicator counts drawdown as percent and currency separate. It has a number of settings: Count deposite drawdown according equity value and send e-mail or notifications to user if DD more than set; Sending e-mail when max open orders reached; Shows price and remaining pips amount before MarginCall on current chart and Account generally; Display summary trade lot
FREE
This indicator has been developed to identify and display these trends quickly and easily, allowing you to see instantly, those currency pairs which are trending, and those which are not – and in all timeframes, with just one click. The 28 currency pairs are displayed as a fan as they sweep from strong to weak and back again, and this is why we call it the ‘currency array’. All 28 pairs are arrayed before you, giving an instant visual description of those pairs that are trending strongly, those
The indicator is designed for trading binary options on small timeframes up to 15 m Easy to use does not need additional settings and can be used without additional filters Recommendations for trading When a signal appears (blue arrows pointing up), you need to consider the buy direction When a signal appears (the red line indicates the bottom), you need to consider the direction to sell To conclude a deal is on the candle where the signal for one candle came, if the signal turned out to be unpr
SAAD TrendTracker is a fully automated EA. It is based on mathematical algorithms Trend Tracker indicator and SAADScalper. The EA scalps pips by its strong Entry strategy based on SAADScalper. Trades that are not successful to scalp are handled in a different way of uniquely designed algorithm based on Trend Tracker indicator. EA is designed for M1, M5, M15 and M30. It consults daily chart for successful trading accuracy. It consults H1 to handle unsuccessful trades using Trend Tracker Indicator
FREE
このプロダクトを購入した人は以下も購入しています
Gann Made Easy は、ミスター・ギャンの理論を使用した取引の最良の原則に基づいた、プロフェッショナルで使いやすい外国為替取引システムです。 W・D・ガン。このインジケーターは、ストップロスとテイクプロフィットレベルを含む正確な買いと売りのシグナルを提供します。 PUSH通知を利用して外出先でも取引可能です。 購入後はご連絡ください!私の取引のヒントと素晴らしいボーナスインジケーターを無料で共有します! おそらく、ギャンの取引手法についてはすでに何度も聞いたことがあるでしょう。通常、ギャンの理論は初心者のトレーダーだけでなく、すでにある程度の取引経験がある人にとっても非常に複雑なものです。なぜなら、ギャンの取引手法は理論的にはそれほど簡単に適用できるものではないからです。私はその知識を磨き、最良の原則を私の外国為替インジケーターに組み込むために数年を費やしました。 このインジケーターは非常に簡単に適用できます。必要なのは、それをチャートに添付し、簡単な取引推奨事項に従うだけです。このインジケーターは常に市場分析の仕事を行い、取引の機会を探します。適切なエントリーポイントを検出
Gold Stuff
Vasiliy Strukov
4.9 (269)
Gold Stuff は、金専用に設計されたトレンド指標であり、あらゆる金融商品にも使用できます。 インジケーターは再描画せず、遅れません。 推奨時間枠 H1. それインディケータでフルオートExpert Advisor EA Gold Stuffが動作します。 あなたは私のプロフィールでそれを見つけることができます. 設定と個人的なボーナスを得るために、購入後すぐに私に連絡してください! トレンド スキャナーの強力なサポートを利用して、無料のインジケーターを入手し、プライバシーを守ります。あーみー!   設定 矢印を描く - オンオフ。 チャートに矢印を描く。 アラート - 可聴アラートのオンオフ。 メール通知 - オンオフ。 電子メール通知。 プチ通知 - オンオフ。 プッシュ通知。 次に、色域を調整します。 Gold Stuff は、金専用に設計されたトレンド指標であり、あらゆる金融商品にも使用できます。 インジケーターは再描画せず、遅れません。 推奨時間枠 H1. それインディケータでフルオートExpert Advisor EA Gold Stuff
An exclusive indicator that utilizes an innovative algorithm to swiftly and accurately determine the market trend. The indicator automatically calculates opening, closing, and profit levels, providing detailed trading statistics. With these features, you can choose the most appropriate trading instrument for the current market conditions. Additionally, you can easily integrate your own arrow indicators into Scalper Inside Pro to quickly evaluate their statistics and profitability. Scalper Inside
Trend Punch
Mohamed Hassan
4.95 (21)
This indicator is unstoppable when combined with our other indicator called  Support & Resistance . After purchase, send us a message and you will get it   for  FREE as a BONUS! Introducing Trend Punch , the revolutionary forex trend indicator that will transform the way you trade! Trend Punch is uniquely designed to provide precise buy and sell arrows during strong market trends, making your trading decisions clearer and more confident. Whether you're trading major currency pairs or exotic sym
Please contact me after purchase to immediately get your PDF strategy + documentation for Trend Pulse !  Official release price of $99  ( 12 / 50 copies left). Next price is $199 . Introducing Trend Pulse , a unique and robust indicator capable of detecting bullish, bearish, and even ranging trends! Trend Pulse uses a special algorithm to filter out market noise with real precision. If the current symbol is moving sideways, Trend Pulse will send you a ranging signal, letting you know that
mql5と Telegramの モーニング・ブリーフィングで、詳細とスクリーンショットを含む毎日のマーケット・アップデートをご覧 ください! FX Power MT4 NGは 、長年の人気を誇る通貨強度計FX Powerの次世代モデルです。 この次世代ストレングスメーターは何を提供するのでしょうか?初代FXパワーの魅力すべて プラス GOLD/XAUの強さ分析 より正確な計算結果 個別に設定可能な分析期間 カスタマイズ可能な計算上限値により、さらに優れたパフォーマンスを実現 もっと見たい人のための特別なマルチインスタンス設定 すべてのチャートでお好みの色を無限に設定可能 数え切れないほどの通知オプションにより、重要なことを見逃すことはありません。 Windows 11とmacOSのスタイルで角を丸くした新しいデザイン 魔法のように動くインジケーターパネル FXパワーの主な機能 すべての主要通貨の強さの完全な履歴 すべての時間枠における通貨の強さの履歴 すべてのブローカーとチャートで同一の計算結果 100%信頼できるリアルタイム計算 -> リペイントなし ドロップダウン・リストから
通貨強さウィザードは、取引を成功させるためのオールインワン ソリューションを提供する非常に強力な指標です。このインジケーターは、複数の時間枠のすべての通貨のデータを使用して、このまたはその外国為替ペアのパワーを計算します。このデータは、使いやすい通貨インデックスと通貨パワーラインの形式で表され、特定の通貨のパワーを確認するために使用できます。 必要なのは、取引したいチャートにインジケーターを接続することだけです。インジケーターは、取引する通貨の実際の強さを示します。このインジケーターは、トレンドに合わせて取引するときに有利に利用できる売買高の圧力の極値も示します。このインジケーターには、フィボナッチに基づく可能なターゲットも表示されます。 このインジケーターは、PUSH 通知を含むあらゆるタイプのアラートを提供します。 購入後ご連絡下さい。私の取引のヒントをあなたと共有し、素晴らしいボーナスインジケーターを無料で提供します! 幸せで有益な取引をお祈りします。
製品を購入する前に、以下の情報をお読みください。 Apollo Pips PLUS SP はユニークな製品です。これは、私の新しい「アポロ ピップス」インジケーターと、私のすべての取引インジケーターにアクセスできる「スーパー パック」ボーナスを手に入れたい人のためのものです。 Apollo Pips PLUS SP 製品を購入すると、実際には私の Apollo Pips インジケーターのまったく新しいバージョンを購入することになります。このバージョンのインジケーターには改良されたアルゴリズムと使いやすいパラメーターがあり、あらゆる市場およびあらゆる取引スタイルでインジケーターを使用する機会が得られます。 この製品の購入者は、私のスーパーボーナスとして、他のすべてのインジケーターにも無料でアクセスできます!私のすべての取引ツールにアクセスしたい場合は、この製品が最適です!:) しかし、これがすべてではありません!:) この製品のすべての購入者は、私の新しいインジケーターを無料で入手する資格もあります!:)新しい取引インジケーターを利用できるようになりました。私の特権のある「スーパー パッ
まず第一に、この取引インジケーターは再描画されず、再描画されず、遅延しないことを強調する価値があります。これにより、手動取引とロボット取引の両方に理想的なものになります。 ユーザーマニュアル:設定、入力、戦略。 アトミックアナリストは、価格の強さとモメンタムを利用して市場でより良いエッジを見つけるためのPA価格アクションインジケーターです。ノイズや誤ったシグナルを除去し、取引ポテンシャルを高めるための高度なフィルターを備えています。複雑なインジケーターの複数のレイヤーを使用して、アトミックアナリストはチャートをスキャンし、複雑な数学的計算をシンプルなシグナルと色に変換します。これにより、どのような初心者トレーダーでも理解して使用し、一貫した取引の決定を行うことができます。 「アトミックアナリスト」は、新規および経験豊富なトレーダー向けにカスタマイズされた包括的な取引ソリューションです。プレミアムインジケーターとトップノッチの機能を1つの取引戦略に組み合わせ、すべてのタイプのトレーダーにとって汎用性のある選択肢にします。 デイリートレーディングとスキャルピング戦略:高
現在26%オフ 初心者やエキスパートトレーダーに最適なソリューション! このインジケーターは、独自の機能と新しい計算式を取り入れた、ユニークで高品質、かつ手頃な価格のトレーディングツールです。たった1枚のチャートで28の為替ペアの通貨強度を読み取ることができます。新しいトレンドやスキャルピングチャンスの引き金となるポイントを正確に特定することができるので、あなたのトレードがどのように改善されるか想像してみてください。 ユーザーマニュアルはこちら  https://www.mql5.com/en/blogs/post/697384 これが最初の1本、オリジナルだ! 価値のないクローンを買わないでください。 特別な サブウィンドウの矢印で強い通貨の勢いを表示 GAPがあなたのトレードを導く! 基準通貨や気配値が売られすぎ・買われすぎのゾーン(外相フィボナッチレベル)にあるとき、個別チャートのメインウィンドウに警告表示。 通貨がレンジの外側から反落した場合、プルバック/リバーサルのアラート。 クロスパターンの特別なアラート 複数の時間枠を選択可能で、トレンドを素早く
まず第一に、この取引ツールはノンリペイント、ノンリドロー、ノンラグの指標であり、プロの取引に理想的ですことを強調する価値があります。 オンラインコース、ユーザーマニュアル、デモ。 スマートプライスアクションコンセプトインジケーターは、新米から経験豊富なトレーダーまで、非常 に強力なツールです。Inner Circle Trader AnalysisやSmart Money Concepts Trading Strategiesなど、20以上の有用な指標を1つに組み合わせています。このインジケーターはスマートマネーコンセプトに焦点を当て、大手機関の取引方法を提供し、彼らの動きを予測するのに役立ちます。 特に、流動性分析に優れており、機関がどのように取引しているかを理解しやすくしています。市場のトレンドを予測し、価格の動きを慎重に分析するのに優れています。機関の戦略とトレードを合わせることで、市場の動向についてより正確な予測ができます。このインジケーターは多目的であり、市場構造を分析し、重要な注文ブロックを特定し、さまざまなパターンを認識するのに優れています。 このインジケー
M1 Arrow
Oleg Rodin
4.73 (15)
市場の2つの基本原則に基づく日中戦略。 このアルゴリズムは、追加のフィルターを使用したボリュームと価格の波の分析に基づいています。インディケータのインテリジェントアルゴリズムは、2つの市場要因が1つに結合した場合にのみシグナルを出します。インディケータは、より高い時間枠のデータを使用して、M1チャート上の特定の範囲の波を計算します。そして波を確認するために、インジケーターはボリュームによる分析を使用します。 このインディケータはレディトレーディングシステムです。トレーダーが必要とするのは、信号に従うことだけです。また、インジケーターはあなた自身の取引システムの基礎になることができます。取引はミニッツチャートでのみ行われます。 インジケーターがMTFの原則を使用しているという事実にもかかわらず、インジケーターのアルゴリズムは可能な限り安定しています。 購入後、必ず私に書いてください!私の取引設定と推奨事項をあなたと共有します!
ご紹介   クォンタム トレンド スナイパー インジケーターは 、トレンド反転を特定して取引する方法を変革する画期的な MQL5 インジケーターです。 13年以上の取引経験を持つ経験豊富なトレーダーのチームによって開発されました。     クォンタムトレンドスナイパーインジケーター   は、非常に高い精度でトレンドの反転を識別する革新的な方法で、あなたのトレーディングの旅を新たな高みに押し上げるように設計されています。 ***Quantum Trend Sniper Indicatorを購入すると、Quantum Breakout Indicatorを無料で入手できます!*** クォンタム ブレイクアウト インジケーターは、トレンドの反転を特定するとアラートを発し、矢印を示し、3 つのテイクプロフィットレベルを提案します。 初心者トレーダーにもプロのトレーダーにも適しています。 量子EAチャネル:       ここをクリック MT5のバージョン:       ここをクリック 推奨事項: 期間: すべての時間枠。最良の結果を得るには、
- Real price is 80$ - 50% Discount ( It is 39$ now ) Contact me for instruction, any questions! Introduction The breakout and retest strategy is traded support and resistance levels. it involves price breaking through a previous level.  The break and retest strategy is designed to help traders do two main things, the first is to avoid false breakouts. Many false breakouts start with a candlestick that breaks out of a level but ends with an immediate candlestick that brings the price back into t
今、147ドル(いくつかの更新後に499ドルに増加します) - 無制限のアカウント(PCSまたはMac) RelicusRoad ユーザー マニュアル + トレーニング ビデオ + プライベート Discord グループへのアクセス + VIP ステータス 市場の新しい見方 RelicusRoad は、外国為替、先物、暗号通貨、株式、および指数の世界で最も強力な取引インジケーターであり、トレーダーに収益を維持するために必要なすべての情報とツールを提供します。初心者から上級者まで、すべてのトレーダーが成功するためのテクニカル分析と取引計画を提供します。これは、将来の市場を予測するのに十分な情報を提供する重要な取引指標です。意味をなさないチャート上のいくつかの異なる指標ではなく、完全な解決策を信じています.これは、信号、矢印 + 価格アクション情報を表示するオールインワンのインジケーターで、他に類を見ない非常に正確です。 強力な AI に基づいて、RelicusRoad は不足している情報とツールを提供して、あなたを教育し、トレーディングのプロ、成功したトレーダーにします。
Reversal First Impulse levels (RFI)    INSTRUCTIONS        RUS       -       ENG              R ecommended to use with an indicator   -   TPSpro  TREND PRO -  Version MT5 A key element in trading is zones or levels from which decisions to buy or sell a trading instrument are made. Despite attempts by major players to conceal their presence in the market, they inevitably leave traces. Our task was to learn how to identify these traces and interpret them correctly. Main functions: Displaying activ
TPSpro TRENDPRO  - is a trend indicator that automatically analyzes the market and provides information about the trend and each of its changes, as well as giving signals for entering trades without redrawing! The indicator uses each candle, analyzing them separately. referring to different impulses - up or down impulse. Exact entry points into transactions for currencies, crypto, metals, stocks, indices!  Version MT5             DETAILED DESCRIPTION              R ecommended to use with an indi
Trend Screener
STE S.S.COMPANY
4.82 (92)
トレンドインジケーター、1つのツールに組み込まれたすべての重要なトレンド機能を備えたトレンドトレーディングとフィルタリングのための画期的なユニークなソリューション! これは、すべてのシンボル/商品(外国為替、商品、暗号通貨、インデックス、株式)で使用できる100%再描画されていないマルチタイムフレームおよびマルチ通貨インジケーターです。 トレンドスクリーナーは、チャート内のドットで矢印トレンドシグナルを提供するインジケーターに続く効率的なインジケーターです。 トレンド分析インジケーターで使用できる機能: 1.トレンドスキャナー。 2.最大利益分析を備えたトレンドライン。 3.トレンド通貨強度メーター。 4.アラート付きのトレンド反転ドット。 5.アラート付きの強いトレンドドット。 6.トレンド矢印 毎日の分析例、毎日のシグナルパフォーマンス...など、トレンドスクリーナーインジケーターを使用して、ここで見つけることができます: ここをクリックしてください 期間限定オファー:トレンドスクリーナーインジケーターは、50ドルと生涯でのみご利用いただけます。 (元の価格125 $) MQ
This Indicator only places quality trades when the market is really in your favor with a clear break and retest. Patience is key with this price action strategy! If you want more alert signals per day, you increase the number next to the parameter called: Support & Resistance Sensitivity.  After many months of hard work and dedication, we are extremely proud to present you our  Break and Retest price action indicator created from scratch. One of the most complex indicators that we made with ove
TakePropips Donchian Trend Pro
Eric John Pajarillaga Aldana
4.61 (18)
TakePropips Donchian Trend Pro   (MT4) は、ドンチャン チャネルを使用してトレンドの方向を自動的に検出し、エントリーとエグジットの取引シグナルを提供する強力で効果的なツールです! この多機能インジケーターには、トレンド スキャナー、取引シグナル、統計パネル、スクリーナー、取引セッション、およびアラート履歴ダッシュボードが含まれます。取引シグナルを提供し、チャートを分析する時間を節約するように設計されています! ユーザー マニュアルとインストール ガイドは、ブログ投稿 (   https://www.mql5.com/en/blogs/post/751368   ) からダウンロードできます。 今日は 50% オフ! 98ドルから49ドルに値下げ! このインジケーターは、ストラテジー テスターでテストできます (ビジュアル モードを有効にします)。 詳細については、説明の下にあるビデオ チュートリアルも利用できます。 ご不明な点やサポートが必要な場合は、私に連絡してください。 TakePropips Donchian Trend Pro イン
Ultimate Sniper Dashboard
Hispraise Chinedum Abraham
4.85 (27)
299ドルで割引中! 今後値上げの可能性あり! 下の説明を読んでください! 究極のスナイパーダッシュボードのための最高のエントリーシステム。究極のダイナミックレベル。(私の製品をチェックしてください) 究極のスナイパーダッシュボードはMT4多通貨テスト制限のため、ライブマーケットでのみ作動します。 究極のスナイパーダッシュボードをご紹介します。HA-Sniper、MA-Sniper、その他多くの特別なモードが含まれる最高の製品です。究極のスナイパーダッシュボードは絶対的な獣です! 初心者やエキスパートトレーダーにとって最高のソリューションです。もう二度と動きを見逃さない! シンプルさとピップを愛するトレーダーのために、特別な製品をご用意しました。シンプルでありながら、ダッシュボードは複数のカスタムアルゴリズムに基づき28の通貨ペアを監視し、すべての作業を行います。たった一つのチャートで、プロのように市場を読み解くことができます。もし、為替ペアが動き出したときに、その方向性を正確に特定することができれば、あなたの取引はどれほど改善されることでしょう。   当社のシ
The AT Forex Indicator MT4 is a sophisticated trading tool designed to provide traders with a comprehensive analysis of multiple currency pairs. This   powerful indicator   simplifies the complex nature of the forex market, making it accessible for both novice and experienced traders. AT Forex Indicator uses   advanced algorithms   to detect trends, patterns and is an essential tool for traders aiming to enhance their forex trading performance. With its robust features, ease of use, and reliabl
Step into the realm of Forex trading with confidence and precision using XQ, a cutting-edge Forex indicator designed to elevate your trading game to unprecedented heights. Whether you're a seasoned trader or just stepping into the world of currency exchange,   XQ Forex Indicator   empowers you with the insights and signals needed to make informed trading decisions. The signal conditions are a combination of three indicators, and XQ Forex Indicator only display  medium and long-term trends . The
Advanced Supply Demand
Bernhard Schweigert
4.9 (314)
現在33%オフ 初心者にもエキスパートトレーダーにも最適なソリューション このインジケーターは独自の機能と新しい公式を多数内蔵しており、ユニークで高品質かつ手頃な取引ツールです。このアップデートでは、2つの時間枠ゾーンを表示できるようになります。より長いTFだけでなく、チャートTFとより長いTF(ネストゾーンを表示)の両方を表示できます。すべてのSupply Demandトレーダーの皆さんのお気に召すはずです。:) 重要情報の公開 Advanced Supply Demandの可能性を最大化するには、 https://www.mql5.com/ja/blogs/post/720245 にアクセスしてください。   エントリーまたはターゲットの正確なトリガーポイントを正確に特定できれば取引がどのように改善されるか想像してみてください。新しい基盤となるアルゴリズムに基づいて構築されているため、買い手と売り手の間の潜在的な不均衡をさらに簡単に特定できます。これは、最も強い需要と供給のゾーンと、過去のパフォーマンス(古いゾーンを表示)がグラフィカルに表現されるためです。これらの機能は、最適
How to use Pair Trading Station Pair Trading Station is recommended for H1 time frame and you can use it for any currency pairs. To generate buy and sell signal, follow few steps below to apply Pair Trading Station to your MetaTrader terminal. When you load Pair Trading Station on your chart, Pair Trading station will assess available historical data in your MetaTrader platforms for each currency pair. On your chart, the amount of historical data available will be displayed for each currency pai
現在31%オフ! 初心者やエキスパートトレーダーに最適なソリューション! このインジケータは、独自の機能と秘密の数式を組み込んだ、ユニークで高品質かつ手頃な価格のトレーディングツールです。たった1枚のチャートで28の通貨ペアのアラートを表示します。新しいトレンドやスキャルピングチャンスの引き金となるポイントを正確に把握することができるので、あなたのトレードがどのように改善されるか想像してみてください! 新しい基本的なアルゴリズムに基づいて構築されているため、潜在的な取引の特定と確認がより簡単になります。これは、通貨の強さや弱さが加速しているかどうかをグラフィカルに表示し、その加速のスピードを測定するためです。加速すると物事は明らかに速く進みますが、これはFX市場でも同じです。つまり、反対方向に加速している通貨をペアにすれば、利益を生む可能性のある取引を特定することができるのです。 通貨の勢いを示す縦の線と矢印は、あなたの取引の指針となるでしょう。 ダイナミックマーケットフィボナッチ23レベルはアラートトリガーとして使用され、市場の動きに適応します。もしインパルスが黄色
Introduction to X3 Chart Pattern Scanner X3 Cherart Pattern Scanner is the non-repainting and non-lagging indicator detecting X3 chart patterns including Harmonic pattern, Elliott Wave pattern, X3 patterns, and Japanese Candlestick patterns. Historical patterns match with signal patterns. Hence, you can readily develop the solid trading strategy in your chart. More importantly, this superb pattern scanner can detect the optimal pattern of its kind. In addition, you can switch on and off individu
`All in One Chart Patterns` チャートパターンはトレーダーの間で議論の的となっています。信頼できるシグナルだと考える人もいれば、そうでないと考える人もいます。当社の「Chart Patterns All-in-One」インジケーターは、これらのパターンを表示し、自分自身で理論を検証できるようにします。これらのパターンの収益性は、インジケーターの有効性を反映するものではなく、むしろパターン自体の評価です。「Chart Patterns All-in-One」インジケーターは、これらのパターンを視覚化するための優れたツールであり、取引戦略における有効性について自分自身で結論を下すことができます。 このインジケーターは、複数のチャートパターンを1つの統合ツールに組み合わせて、MetaTrader 4 (MT4) で使用します。チャートから直接各パターンをオンまたはオフに切り替える機能を提供し、カスタマイズ可能で効率的な分析を可能にします。以下は、インジケーターとその中に含まれるパターンの詳細な説明です。 #### 含まれるパターン: 1. **パターン
ブレーカートレーダーになり、価格が反転すると市場構造からの利益が変化します。 注文ブロックブレーカーインジケーターは、トレンドまたは価格の動きが枯渇に近づいており、逆転の準備ができていることを識別します。通常、反転または大規模なプルバックが発生しようとしているときに発生する市場構造の変化について警告します。 この指標は、ブレイクアウトと価格の勢いを識別する独自の計算を使用します。使い果たされる可能性のあるポイントの近くで新しい高値が形成されるたびに、インディケーターはその高値の作成を担当する最後の注文ブロックを描きます。次に、移動する価格とともに注文ブロックを追跡します。その後、価格が反対方向にシフトし、その注文ブロックを突破すると、新しい市場構造を作成し、トレンドまたは大きな後退の可能性のある反転の開始を警告します。 注文ブロックは、高値/安値が作成される前の最後の反対色のろうそくであり、価格がこれらの重要な領域を下抜けすると、トレンドの短期的ま​​たは長期的な反転の兆候です。 特徴 重要な枯渇点での市場構造の変化を警告します 価格が使い果たされるレベルに近づくと、
IX Powerは 、FX Powerの無敵の精度をついにFX以外のシンボルにも提供します。 お気に入りの指数、株式、コモディティ、ETF、さらには暗号通貨の短期、中期、長期のトレンドの強さを正確に判断します。 お使いの端末が提供する すべてを分析する ことができます。ぜひお試しいただき、取引 タイミングが大幅に改善 されることをご体験ください。 IXパワーの主な特徴 100%正確で再描画されない計算結果 - ターミナルで利用可能なすべての取引シンボルに対して 予め設定され、さらに個別に設定可能な強度分析期間のドロップダウン選択 Eメール、メッセージ、モバイル通知による無数の通知オプション EAリクエストのためのアクセス可能なバッファ カスタマイズ可能な計算制限により、さらに優れたパフォーマンスを実現 もっと見たい人のための特別なマルチインスタンス設定 すべてのチャートでお好みの色を無限に設定可能 Windows 11とmacOSのスタイルで角を丸くした新しいパネルデザイン サブ・ウィンドウとメイン・チャートの間をシームレスに移動する、魔法のように動く
作者のその他のプロダクト
This is a reduced version, demo if you like, of the published Elliott Wave Tool 7Pasos . The limitations for this tool vs Elliott Wave Tool 7pasos are the following: Only one account possible, the original tool has 1 principal and 4 alternative accounts. Only one degree (Primary) is available, in the original tool 12 different degrees (6 in micro) are at your disposition. As only one degree is available, the functions to upgrade and downgrade the degree of the selected wave are disabled. Fixed c
FREE
Dollar Index
Sergio D. Rocha
4.2 (5)
This indicator calculates directly the value of the dollar index by using the ICE formula to plot the chart, this can help you as reference. You do not need your broker to provide the ICE DX to use this indicator, is a way to have it calculated. Little discrepancies could be found in the exact value of the candles or time due closing time of the trading floor and the use of decimals, but generally will give you good reference.  You need your broker offers the feed for the following pairs in orde
FREE
LevelsGrid
Sergio D. Rocha
5 (1)
This is a simple script that places a defined number of lines above and below a given price.  The script lets you set the number of lines, the separation in pips and the color.   Instructions: Drop the script on a chart to draw the level lines  If the last parameter is set to false, the script will delete the lines previously placed by it.  Parameters:  English? Turn it yes to use English language, false will turn language to Spanish  Separation Set the pips distance among lines  From Price
FREE
This is a very simple indicator that mixes the Sunday session with the Monday one. This is useful because the Sunday session is a partial session mostly with only Australian and Asian sessions included, so the analysis of the Monday's daily session if mixed with Sunday tends to be more comprehensive. This indicator plots a candle with the following values: Open - the Friday's Close or Sunday's Open (depending on your choice). High - the highest High of Sunday and Monday. Low - the lowest Low of
FREE
Trailing Even is a free complement for the Control adora Expert Adviser. It adds a trailing stop function and changes the exit level that works as stop loss if some price is reached, let's review how to make it work: First of all make sure you have the same language selected both in the Control adora Expert and in this indicator.  Change of the exit level that works as stop loss with "BES" and "BEO": This function needs 2 arrows to work: 1 named BES (stands for Break Even Start) place it at the
FREE
Delete All
Sergio D. Rocha
4 (1)
This is a very silly script but perhaps you find it useful. It deletes all objects from the chart. I recommend setting a hot key to call it just by pressing a couple of keys on your keyboard.  To avoid accidental deletion of object, the script will ask you to confirm the action as you won't be available to restore them with "undo" (Ctrl+Z).
FREE
"TradeALot" is a plug-in for the Expert Advisor Control-adora . It allow you to place programmed orders without the need to write the name of the order in the Arrow (like bs, ss, bl, sl, sl1, sl2, etc). Just drag and drop the button for "Programmed Buys" or "Programmed Sells" over the candles-zone at the place where you want to program the order and TradeALot will compare the bid price with the position where you dropped the button and will decide if the order need to be "Stop" or "Limit". With
FREE
This is a technical indicator that works as a plug-in for "Control adora" - the Expert Advisor that helps you to calculate, place and control positions on the chart. When run on a chart with Control adora EA, this plug-in allows setting entry levels that send orders at contact, while you have StopCloseOnly (OCO in Comments) = 1 settled in Control adora (meaning that without this, the indicator will send the order only when the price Close crosses the arrow level). This indicator only works if yo
FREE
This is a system consistent of 2 components: RepliTrades Source: It sends the trades to one or more terminals into the same Computer RepliTrades Trader: It trades the orders sent by RepliTrades Source  Please watch the video to learn how it works and use it. Features: Manage up to 300 trades at same time in each terminal Work with any broker, no matter if uses suffix or prefix in symbols names Replicate pending orders (limits or stops orders) or direct trades (market orders, etc) and its modif
FREE
ManualBackTest
Sergio D. Rocha
3.5 (2)
This is a technical indicator that put on strategy tester the buttons of the expert adviser "Control adora". Usually when applied the controladora to the strategy tester, the buttons do not appear and therefore its functions (like directly buy, sell, close orders or place stop loss indicator) can't be used. But now you can if have the Manual Backtest indicator. If you don't have Control adora, you can get it from here . This indicator get on the chart the buttons that can be of use in strategy t
FREE
AllHere is a plug-in for Control-adora that works as information panel. Its main function is to show you all the Control-adora elements placed in the chart, like the Control-adora's orders or the exit lines. On the lower left corner, AllHere shows a collection of buttons classified by color (you can set them in the indicator's properties) for several elements used in Control-adora system: Stop loss indications (stop loss Arrows) Exit lines Above (Above trend lines) Exit lines Below (Below trend
FREE
CorExTi is a tool that will save you literally hours in your daily routine to draw lines and other graphic elements in your charts.   With a temporary panel discreetly displayed on your screen at the touch of a graphic element as trendline:  Changes the object between 4 favorite line styles (with color, line thickness and style)  Cuts trendlines, when are extended, just at the point where you touch them Extends trendlines (active property of Ray) which are not extended  Or deactivates visualizat
The best way to monitor multiple pairs within little workspace. RotaGrafico sequentially displays up to 6 different pairs. It has buttons to set a pair more time for observation. Normal exposure time adjustable. Broad exposure time adjustable. Combine in a profile, Rotagrafico and use the rest of your workspace to the pair that you want to analyze in detail.
Did you have to start again the very same analysis because the original one, from where you want to modify, just have so much information that no longer fits? Have you ever wanted to change some in one of your charts and make this new line, Fibo or channel automatically appear in some or the rest of your set of charts? Object Copier is the solution to replicate any object into one or several charts at your desire. No matter if you changed an object, or made it from the scratch. With Object Copie
Control adora
Sergio D. Rocha
4.33 (6)
Controladora means in Spanish controller, this is a simple yet powerful Expert Advisor that allows you to control your trading easily and precisely. Do you want to stop your trade when the price cross a trend line? Don't worry, Controladora can do it. Do you want to take profit when the price reaches the top of a channel? Controladora can do it as well. Calculating the exact proportion of your account by opening a trade, which size represents in case of loss a percentage of your balance, is time
Fibo Pro
Sergio D. Rocha
4.5 (4)
When you combine short term fibos with the long term, your chart get missed up with a lot of lines that hardly make sense at first view. The best way to improve the clearness and there for the easiness to read your chart is by deleting the fibo levels that you no longer need, for example those levels that the price proved didn’t work as support or resistance. With Fibo Pro, you can activate or deactivate from a set of fibo levels pre-settled by you, without miss with the default fibo configurati
FHDrawer
Sergio D. Rocha
2.5 (2)
Free Hand Drawer is a small app that runs as technical indicator and the only thing that does is that it draws continuous line. To activate it, after adding the indicator to the chart just press the D on your keyboard and click where you want to start drawing. Then every click you make on your chart will be the next nod in your drawing. Use it to draft Elliott waves, or to illustrate ideas on your chart. If you like to draw manually your Gann line you’ll find it handy as well. Each time you want
BreakEven shows the location of the average price level of the orders in the symbol, to which the indicator is attached. This information allows you to find the break-even. The indicator is helpful if you manage several positions, since it allows you to evaluate the performance of your open trades in a glance. If you trade a single order, it allows you to evaluate the effect of your stop loss and the profit or loss during the time your trade is open. Apart from drawing a break-even level line (w
Gann Line indicator is usually used in combination with other Gann’s techniques, some say this is a key point in its success. The Gann line is interpreted as trend indicator, a series of higher highs and higher lows in it's trend are considered bullish, and a series of lower lows and lower highs are bearish. As with other technical indicators, for better results Gann Line should be used in combination with other technical concepts as Gann Fan, fibo, swings, supports and resistance, etc. When rev
This is a system consistent of 2 components: RepliTrades Source: It sends the trades to one or more terminals into the same Computer RepliTrades Trader: It trades the orders sent by RepliTrades Source   Please watch the video to learn how it works and use it. Features: Manage up to 300 trades at same time in each terminal. Work with any broker, no matter if uses suffix or prefix in symbols names. Replicate pending orders (limits or stops orders) or direct trades (market orders, etc) and its mo
The indicator that helps you by plotting a reference to easily determine if a scalping trade (or intraday trade) has chances to work out in your favor. One of the most common issues intraday traders have is the lost of reference to know if a movement is big or small due to the scaling of the chart. With this indicator, you have 3 visual aids on your chart that will help you: "Screener" : Please set the normal stop loss size that you usually apply in your strategy. This will plot a rectangle afte
Moon Phase
Sergio D. Rocha
5 (1)
Gann and other analyst had found a curious correlations between moon phases and change in trends, this is an excellent indicator to test those relation and use what you find useful. It's very simplistic, can calculate the moon phases using the average moon cycle duration of 29 days 12 hours 44 minutes since the 1970 first full moon registered at January 22nd. You can also place a known full moon's date, to start the count since the daily opening of that date. In its window will plot a vertical l
Pointer Sync
Sergio D. Rocha
4.29 (7)
This indicator plots a crosshair pointer in all charts of the terminal in the position relative to the active chart. To activate the Pointer Sync, just press the "+" button that will appear in one of the 4 corners of the chart where the indicator is added. To deactivate the Pointer Sync, just press the "+" button again. Once Pointer Sync is deactivated, the cross lines will disappear in all charts as well. You can adjust the color of the pointers and the button, the corner where the button appea
This indicator plots a line that shows the high and low of a higher time frame than the one where you have actually in your chart. For example if you want to see the high and low of the day while you are in 1hour chart, set Boundaries to Daily. Boundaries have predefined Monthly, Weekly, Daily and Hourly time frames, but if you want to use a different timeframe, just choose the option Other_TF and write on the next field the minutes for your desired timeframe. As MT4 only works beyond M1 with 5,
This indicator works exactly the same as the Boundaries indicator, but here as a free demo that only shows the high and low of the week. As the Boundaries indicator does, this indicator can work with any symbol. In the Colors tab you can set the color for the Upper and Lower boundaries. Please review the pics or watch the Boundaries indicator video to better understand how it works.
Having a trade about to reach its take profit and suddenly see that it turns around to go strait ahead to your Stop Loss is one of the few things that makes me curse (a lot). This is why I created AntiCurse. Just add this Expert Advisor to an empty chart, set a "Trigger" and "Lock" in its properties and you'll have one less reason to curse! AntiCursing Settings: "Trigger" is set in percentage terms, it is the distance between the entry price and the Take Profit that needs to be covered in orde
PerfectLine
Sergio D. Rocha
5 (3)
When drawing a trend line or other objects, there is a natural deviation when you place the object from a higher time frame, and then go to watch it in a lower time frame. PerfectLine is a technical indicator that solves this problem. Once you touch a line after drawing it, Perfect Line will find the exact spot in the lower time frame available for it's position and then rectifies where it should be. Perfect Line uses a five pixels pre-established tolerance, if a difference between the line's no
The Polarized Fractal Efficiency (PFE) was introduced by Hans Hannula in 1994. The indicator was intended to quantify the efficiency of price movement and  how trendy or choppy  the recent past price action has been. This is calculated by contrasting the price traveled in the window of study  against the total accumulation of movements during the same period of time. For example: If in 10 days, an active raised from 50 to 100, by increasing it's value 5 points or dollars each session, the effici
Cross Alert is an all-in-one solution for oscillators' cross over and under. Cross Alert manages the levels for the cross under and cross over separately. Thanks to this you can use it to signal zero cross over (by fixing both levels, above to below, and below to above as zero) or over-bought and over-sold levels (like 70 and 30) as well.  With CrossAlert you can also avoid alerts from one kind of crosses (overs or unders), for example if you are in an uptrend perhaps you do not want to have ale
AdvancedTradeLog is a system that allows you to keep visual register of what you had in your chart when you take a trade decision. Basically it takes screenshots of your chart each time you open, modify or close a trade. But not just that, AdvancedTradeLog gives you the ability to record the reasons of why you take those decisions. All who had been trading some time knows that keep a track-record of what you decide and why on the market, is a powerful tool to improve your performance. AdvancedTr
フィルタ:
Valentin Butorin
4123
Valentin Butorin 2020.10.18 12:37 
 

Thanks for sharing.

Alberto Oliver
134
Alberto Oliver 2018.10.19 23:31 
 

Excelent indicator, generates a very precise EURX chart, congrats paisano.

amfels07
493
amfels07 2017.06.05 06:10 
 

Great work Sergio.......... appreciate your efforts on this good indicator sir.......Best of luck!

Maksym Mudrakov
29461
Maksym Mudrakov 2016.08.31 13:43 
 

ユーザーは評価に対して何もコメントを残しませんでした

Jean-Sebastien Laurent
4390
Jean-Sebastien Laurent 2014.08.16 12:23 
 

ユーザーは評価に対して何もコメントを残しませんでした

hernantrader
14
hernantrader 2014.06.06 13:11 
 

Very useful application, a must-have for traders.

レビューに返信
バージョン 1.1 2021.11.22
Recompiled with latest MT4 build, requested by mql5.com