Divergence Dash
- インディケータ
- Paul Geirnaerdt
- バージョン: 1.3
- アップデート済み: 22 4月 2020
- アクティベーション: 10
Diverence Dash is a MACD, RSI, OBV, Momentum, Stochastic or Standard Deviaviation Divergence Dashboard. It will scan all symbols and timeframes you want. Also, Divergence Dash can open charts with the divergence found using the template of your choice.
What can Divergence Dash for you:
- Find MACD, RSI, OBV, Momentum, Stochastic or Standard Deviaviation Divergences for all symbols and timeframes
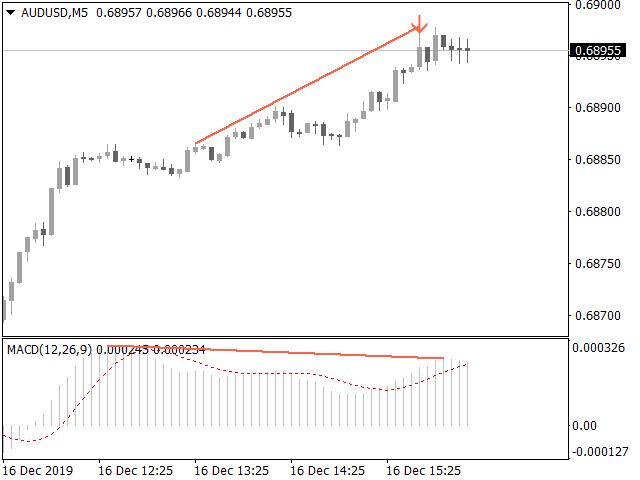
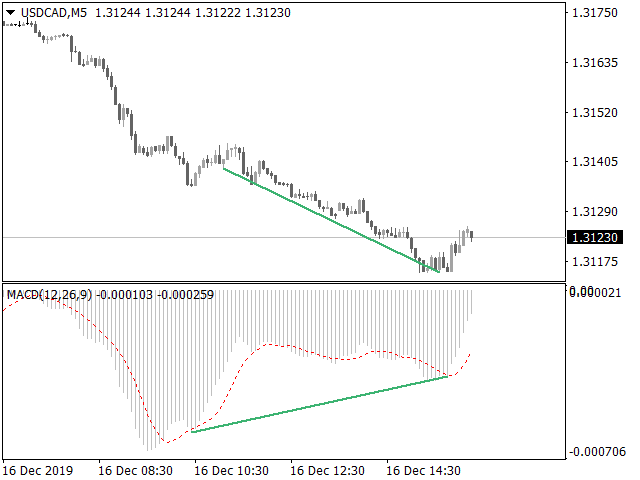
- Open charts with the divergence
- Use any template for the charts to open
- Use any indicator on the chart to open and show the divergence
Settings
The settings of TMA Currency Meter can be intimidating. Keep experimenting, there is nothing to break.
- Use symbols from Market Watch window (Autosymbols)? - set to true to use all the symbols in your Market Watch window.
- Symbols to use when Autosymbols is set to false (comma delimited) - comma delimited list of symbols if Autosymbols is false.
- Timeframes to scan, comma delimited - comma delimited list of timeframes.
- Number of times a cross of price or MACD is allowed - number of times a Divergence line can be crossed by price or MACD.
- Oscillator to check for divergence? = set to the oscillator (MACD, RSI, OBV, Momentum, Stochastic or Standard Deviaviation) you want to find divercenges for.
- Template to apply to charts opened? - name of template (exclude .tpl) to be applied to charts to open.
- (Part of) indicator name on template - set to the short name or part thereof of the indicator on which to show divergence. The short name of the indicator is shown in the top left corner of the subwindow.
- MACD inputs - you know what to do, or leave at default.
- RSI inputs - you know what to do, or leave at default.
- Momentum inputs - you know what to do, or leave at default.
- Stochastic inputs - you know what to do, or leave at default.
- Standard Deviation inputs - you know what to do, or leave at default.
Table
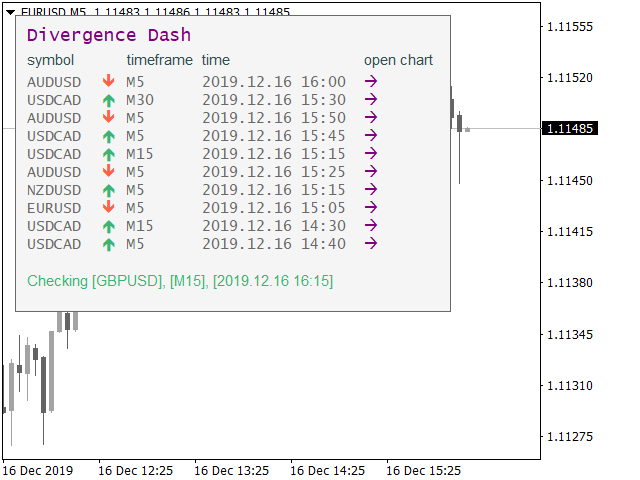
The information table on the left hand side shows the following information:
- Symbol
- Direction, a bullish or bearish arrow
- Timeframe
- Time, the time at which the divergence was detected
- Open chart, an arrow on which you can click to open a chart
Loose Ends
If you run in any problems, try to load some history for all your symbols before dropping Divergence Dash on your chart.












Excellent, it complies with simplicity and effectiveness