• 概要
  • レビュー
  • コメント (27)
  • 最新情報

Cross Trend Line to Trade

このアドバイザーは次の機能を提供します。

  • ポジションをオープンする: 価格がトレンドラインを超えたら、ロング注文またはショートオーダーをオープンします。
  • クローズ: 価格がトレンドラインを超えたら、ロングポジションまたはショートポジションをクローズします。
  • トレーリングストップロス – EA はトレンドラインに沿って、ロング注文のストップロスを増加させたり、ショート注文のストップロスを減少させ続けます。
  • ラインはトレンドラインでも水平線でも構いません。  傾向線は半径または線分にすることができます。線分には、その線が存在する期間のみ取引するという特別な機能があります。
  • ポジションをオープンおよびクローズできるこれらのラインには、特定の名前が付いています。 EA では、手動で線を描画する代わりに、線描画パネルを提供します。
  • すべてのオープンポジションとクローズポジションのスクリーンショットは、MQL4/Files/Cross Trend Line to Trade フォルダーに保存されます。
  • EAは以下で使用できます 戦略 試着室。支払う前にストラテジーテスターで試してみてください。

線画パネル:

  • 緑色の「+」ボタンをクリックすると、6 つのグループのパネルが次々に生成されます。各パネル グループは、対応するボタンをクリックしてトレンド ラインまたは水平線を描画できます。
  • 紫色のボタンをクリックして、傾向線または水平線の線の種類を選択します。
  • Del を押すと、描画された線がすべて削除されます。
  • Xを押すとパネルが閉じて元の状態に戻ります。
  • B1、B2、B3、B4、B5 ボタンを押すと 5 本の線が描画されます。価格がこれら 5 つのラインのいずれかを超えると、ロング注文がオープンされます。
  • S1、S2、S3、S4、S5 ボタンを押すと 5 本の線が描画されます。価格がこれら 5 つのラインのいずれかに達すると、空注文がオープンされます。
  • すべてのトレンド ラインの名前と機能の詳細な説明については、以下をお読みください。


トレンドラインの名前と機能:

  1. オープンロングポジション: B1、B2、B3、B4、B5 -  価格がこれら 5 つのラインのいずれかを超えると、ロング注文がオープンされます。各明細で一度にオープンできる注文は 1 つだけです。注文には、同じラインでポジションが繰り返しオープンされることを避けるために、ライン名を含む特別なコメントが含まれます。
  2. ショートポジションをオープンする: S1、S2、S3、S4、S5 – これら 5 つの名前はショートオーダーをオープンするために使用されます。上記のロングポジションをオープンする場合と同様、各ラインでオープンできる注文は 1 つだけです。
  3. すべてのロング注文をクローズします: Cls-Buy-All-1、Cls-Buy-All-2、Cls-Buy-All-3。価格がこれら 3 つのラインのいずれかを超えると、すべてのロング注文がクローズされます。
  4. すべてのロング注文とショート注文をクローズします: Cls-All-1、Cls-All-2、Cls-All-3。価格がこれら 3 つのラインのいずれかを超えると、すべてのロング注文とショート注文がクローズされます。
  5. すべてのショートオーダーをクローズします:   Cls-Sell-All-1、   Cls-Sell-All-2    Cls-Sell-All-3、価格がこれら 3 つのラインのいずれかを超えると、すべてのショート ポジションがクローズされます。
  6. 利益の出るロング注文はクローズされています: Cls-Buy-Win-1、Cls-Buy-Win-2、Cls-Buy-Win-3。価格がこれら 3 つのラインのいずれかを超えると、収益性の高いロング注文はすべてクローズされます。ストック。
  7. 損失が出た状態でロング注文をクローズするには:   Cls-購入損失-1      Cls-購入-損失-2    Cls-Buy-Loss-3、価格がこれら 3 つのラインのいずれかを超えると、利益のないロング注文はすべてクローズされます。
  8. 短期的な利益でも:   Cls-Sell-Win-1、   Cls-Sell-Win-2    Cls-Sell-Win-3、価格がこれら 3 つのラインのいずれかを超えると、収益性の高いショート ポジションはすべてクローズされます。
  9. 負けた空売り注文を閉じるには:   Cls-売却-損失-1      Cls-販売-損失-2      Cls-Sell-Loss-3 、価格がこれら 3 つのラインのいずれかを横切る場合、すべてのショート ポジションは損失でクローズされます。
  10. 最も収益性の高いロング注文: Cls-Buy-WinMax-1、   Cls-購入-WinMax-2    Cls-Buy-WinMax-3、価格がこれら 3 つのラインのいずれかを超えると、最も利益の高いロング注文がクローズされ、このラインは繰り返しクローズされることを避けるために直ちに削除されます。
  11. 最大の損失を伴うロング注文:   Cls-購入損失Max-1、   Cls-Buy-LossMax-2      Cls-Buy-LossMax-3、  価格がこれら 3 つのラインのいずれかを超えると、ロングポジションはより大きな損失を伴ってクローズされます。   、この行は再び閉じられないようにすぐに削除されます。
  12. 最も収益性の高いショートオーダー:   Cls-Sell-WinMax-1、   Cls-Sell-WinMax-2      Cls-Sell-WinMax-3、価格がこれら 3 つのラインのいずれかを超えると、ショートポジションはより大きな利益でクローズされます。   、この行は再び閉じられないようにすぐに削除されます。
  13. 最大の損失を伴うショートポジション:   Cls-Sale-LossMax-1、   Cls-Sale-LossMax-2      Cls-Sale-LossMax-3、  価格がこれら 3 つのラインのいずれかを超えると、ショートポジションはより大きな損失を伴ってクローズされます。     、この行は再び閉じられないようにすぐに削除されます。
  14. ポジションを決済するための最初の購入注文: Cls-Buy-First-1、Cls-Buy-First-2、   Cls-Buy-First-3、価格がこれら 3 つのラインのいずれかを超えると、最初の開始時間を持つロング注文がクローズされます。   、この行は再び閉じられないようにすぐに削除されます。
  15. ポジションを決済するための最後のロング注文:   Cls-購入-最後-1、Cls-購入-  最後  -二、   Cls-  最後  -最初-3価格がこれら 3 つのラインのいずれかを横切ると、ロング注文は最後の開始時間でクローズされます。
  16. ポジションを決済するための最初のショートオーダー:   Cls-Sell-First-1、Cls-Sell-First-2、   Cls-Sell-First-3、価格がこれら 3 つのラインのいずれかを超えると、ショート ポジションは最初の開始時間にクローズされます。   、この行は再び閉じられないようにすぐに削除されます。
  17. ポジションを決済するための最後のロング注文:   Cls-セール-ラスト-1、Cls-セール-  最後  -二、   Cls - 販売- 最初 - 3   - 価格がこれら 3 つのラインのいずれかを横切ると、ショート ポジションは最後の開始時間でクローズされます。     、この行は再び閉じられないようにすぐに削除されます。
  18. ロング注文のストップロスの移動: TSB1、TSB2、TSB3: ロング注文のストップロスライン。これらの 3 つのラインは、ロング注文のストップロスを移動するために使用されます。市場価格がラインを上回っている場合、ロング注文のストップロスはラインに向かって移動します。
  19. 短期注文のストップロスの移動: TSS1、TSS2、TSS3 は短期注文のストップロス追跡ラインであり、これら 3 つのラインは短期ストップロス注文の移動に使用されます。市場価格がラインを下回っている場合、ショートストップはラインに向かって移動します。
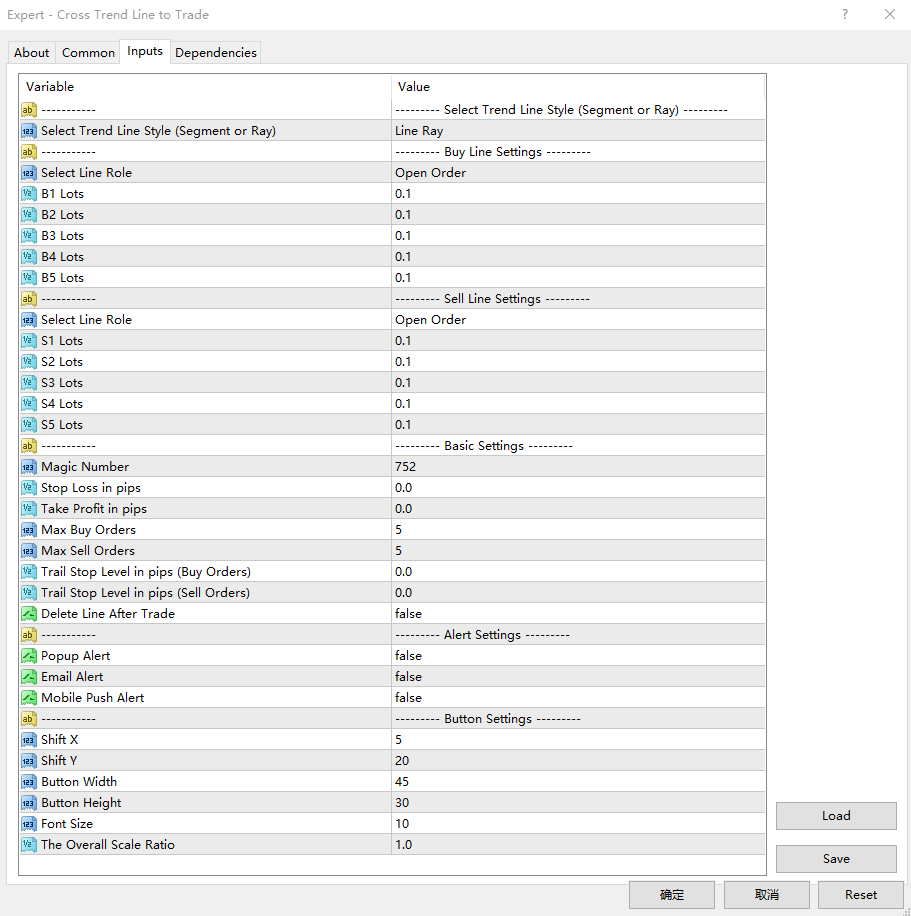

入力パラメータの説明:

1.回線関連の設定
  • Trend Line Style: 描画する線のタイプを選択します: 線分、線の半径。
  • Select Line Role: ライン B1、B2、B3、B4、B5 で実行される機能を選択します: オープンポジションまたはアラートのみ。
  • B1 Lots: ライン「B1」に対応する初期ロット番号。
  • B2 Lots: ライン「B2」に対応する初期ロット番号。
  • B3 Lots: 行「B3」に対応する初期ロット番号。
  • B4 Lots: 行「B4」に対応する初期ロット番号。
  • B5 Lots: 行「B5」に対応する初期ロット番号。
  • ライン機能の選択: ライン S1、S2、S3、S4、S5: オープンポジションまたはアラートのみで実行される機能を選択します。
  • S1 Lots: ライン「S1」に対応する初期ロット番号。
  • S2 Lots: ライン「S2」に対応する初期ロット番号。
  • S3 Lots: ライン「S3」に対応する初期ロット番号。
  • S4 Lots: ライン「S4」に対応する初期ロット番号。
  • S5 Lots: ライン「S5」に対応する初期ロット番号。
2. 利益とストップロスのポイント、注文番号の管理、ポップアップ、電子メール、携帯電話からのプッシュ通知、その他の設定を取得します。
  • Magic Number: これは EA のマジック ナンバーであり、EA のコード名です。
  • Stop Loss In pips: ポイント単位のストップロス。 EA がポジションをオープンすると、この項目パラメータに従って注文のストップロス価格を設定します。
  • Take Profit In pips: pips で利益を得る。 EA がポジションをオープンすると、この pip パラメーターに基づいて注文の利益価格を設定します。
  • Max Buy Orders: ロング注文の最大数。実際、トレンドラインは B1、B2、B3、B4、B5 の 5 本しかないため、最大 5 つのロング注文を開くことができます。このパラメーターが 2 に設定されていると仮定すると、価格がいずれかの 2 つのラインを横切ると、2 つの注文がオープンされ、他のラインを横切った場合でもポジションはオープンされません。
  • Max Sell Orders: 空売り注文の最大数。実際、トレンドラインは B1、B2、B3、B4、B5 の 5 本しかないため、最大 5 つの空注文を開くことができます。このパラメーターが 2 に設定されていると仮定すると、価格がいずれかの 2 つのラインを横切ると、2 つの注文がオープンされ、他のラインを横切った場合でもポジションはオープンされません。
  • トランザクション後にラインを削除 – true に設定すると、アドバイザはトランザクション (ポジションのオープンまたはクローズ) の完了後にラインを削除します。
  • Trail Stop Level in pips (Buy Orders): ロング注文は、ストップロスを追跡する前に、このピップから利益を得る必要があります。このパラメータが 0 の場合、ストップロスに従う前にピップ利益レベルに到達する必要はありません。
  • Trail Stop Level in pips (Sell Orders):ショート注文は、トレーリング ストップに従う前に、このピップから利益を得る必要があります。このパラメータが 0 の場合、ストップに従う前に利益点に到達する必要はありません。
  • Popup Alert: ポジションをオープンまたはクローズすると、ポップアップ ウィンドウが表示されます。
  • Email Alert: ポジションをオープンまたはクローズすると、電子メールリマインダーが送信されます。
  • Mobile Push Alert:  ポジションがオープンまたはクローズされると、リマインダーを含むプッシュメッセージが携帯電話に送信されます。

3. パネルの位置とボタンのサイズの設定。

  • Shift X: グラフの右上隅の水平方向の変位。
  • Shift Y: グラフの右上隅に対する垂直方向の変位
  • Button Width: ボタンの幅
  • Button Height: ボタンの高さ。
  • Font Size: ボタンのフォント サイズ。
  • The Overall Scale Ratio: パネルがズームインまたはズームアウトされる回数。


その他の注意事項:

  1. MT4 を起動するか、EA をチャートにロードするたびに、MT4 の起動時にチャートが更新される間、EA は 3 秒間一時停止します。そのため、この期間中の取引は避けてください。
  2. トレーリングストップロスパラメータが0の場合、ストップロスはトレンドラインに従います。
  3. トレーリングストップロスパラメータが0より大きい場合、プロフィットポイントがパラメータ値より大きい注文のみがトレンドラインに沿ってストップロスを移動します。
  4. ロング注文のストップロス価格は決して下がりません。
  5. 空売り注文のストップロス価格が上昇することはありません。
  6. 月曜日のギャップ中に価格がトレンドラインを横切ることによって引き起こされる予期せぬ取引を避けるために、金曜日にトレンドラインを削除するか、トレンドラインをチャートの左側に移動することをお勧めします。

//---


おすすめのプロダクト
Инструмент для торговли скальпингом с использованием профиля рынка. Позволяет торговать по рынку, а так же оттачивать навыки торговли в тестере стратегий. При минимальном интерфейсе имеет высокую функциональность и пользу для торговли от уровня Point Of Control (POC). Как торговать с помощью советника - утилиты Market profile scalper, смотрите видео. Настройки - - - - - - Market profile - - - - - - Color rectangle range 1 - цвет прямоугольника 1 диапазона свечей Color rectangle range 2 - цвет пр
VR Cub
Vladimir Pastushak
VR Cub は、質の高いエントリーポイントを獲得するためのインジケーターです。このインジケーターは、数学的計算を容易にし、ポジションへのエントリーポイントの検索を簡素化するために開発されました。このインジケーターが作成されたトレーディング戦略は、長年にわたってその有効性が証明されてきました。取引戦略のシンプルさはその大きな利点であり、初心者のトレーダーでもうまく取引することができます。 VR Cub はポジション開始ポイントとテイクプロフィットとストップロスのターゲットレベルを計算し、効率と使いやすさを大幅に向上させます。取引の簡単なルールを理解するには、以下の戦略を使用した取引のスクリーンショットを見てください。 設定、設定ファイル、デモ版、説明書、問題解決方法は、以下から入手できます。 [ブログ] レビューを読んだり書いたりすることができます。 [リンク] のバージョン [MetaTrader 5] エントリーポイントの計算ルール ポジションをオープンする エントリーポイントを計算するには、VR Cub ツールを最後の高値から最後の安値までストレッチする必要があります。
"The trend is your friend" is one of the best known sayings in investing, because capturing large trendy price movements can be extremely profitable. However, trading with the trend is often easier said than done, because many indicators are based on price reversals not trends. These aren't very effective at identifying trendy periods, or predicting whether trends will continue. We developed the Trendiness Index to help address this problem by indicating the strength and direction of price trend
The system applies Fibo levels. Apart from basic Fibo levels (23.6; 38.2; 50.0; 61.8; 100.0;), the EA features custom levels (34.0; 36.0; 64.0; 66.0;). You can decide the levels trading is to be performed from. Sample trade: when the market is bullish and the price rolls back to the levels (as we remember, we select the levels on our own), the EA opens buy orders. The opposite is true for sell orders. The EA can work in three modes. Each of the modes is a separate Fibo levels construction method
The Point61 indicator is the result of many years of monitoring of price behavior of currency pairs and metals. It is not a secret, that in times of uncertainty, traders are looking for possible levels of support and resistance - the point, where price should stop its movement. There are 2 possible scenarios at these points: 1. Reverse (correction) to the opposite direction; 2. Breakthrough to continue movement. Very often these points are used to set stop orders - TakeProfit or
hello friends bollinger Bands signal traders. I am happy to announce that I have completed the robot that follows the market according to the signal that the closing candle is above the upper Bollinger Bands and the closing candle is below the lower Bollinger Bands, the robot will send the image to Telegram then you will check see if it is a signal that matches your order opening rules. because I find the signal system really useful for traders, so I am trying to complete many products to serv
Trade with Gann on your side!! MASTER CIRCLE 360 CIRCLE CHART, originally created by Gann admitted that this is “The Mother of all charts”. It is one of the last studies that this great trader left for us. The numeric tab le is apparently quite simple like all the tables and is based on square numbers, the SQUARE OF 12 and is by evolution, one of the most important square numbers. Here we can find CYCLE, PRICE AND TIME thanks to angles and grades, to show past and future support and resistance.
Vizzion is a fully automated scalping Expert Advisor that can be run successfully using GBPJPY currency pair at H1 timeframe. Very Important This Expert Advisor can not run with any EAs in the same account. As part of the money management plan, it calculates and monitors the Margin Level % and assumes that all open trades are created by it. If you want an Expert Advisor that trades in a daily basis, this EA is not for you because using this requires a patience to wait for a few days or weeks o
For sure, this indicator has become very popular amongst traders. Through coding this indicator will give you the most accurate levels possible for your trading analysis. We have also added in the ability for you to receive alerts when the price breaks above or below a Support or Resistance lines! HOW TO USE The red rectangles represent your resistance/supply zone. The green rectangles represent your support/demand zone.  BONUS FEATURES We coded this indicator with the ability to switch between
This utility is designed to help you with your Manual Trading. It allows different ways of closing trades. It can display total number of BUY and SELL orders individually and also their individual profits. It can enter trades without stopl loss and take profits. However upon selecting UseStopLossTakeProfit from the settings it can use best possible stop loss and take profits based on the market conditions. Upon selecting the CloseOppositeTrades  from the settings it can close opposite trades. Fo
The Gann Box (or Gann Square) is a market analysis method based on the "Mathematical formula for market predictions" article by W.D. Gann. This indicator can plot three models of Squares: 90, 52(104), 144. There are six variants of grids and two variants of arcs. You can plot multiple squares on one chart simultaneously. Parameters Square — selection of a square model: 90 — square of 90 (or square of nine); 52 (104) — square of 52 (or 104); 144 — universal square of 144; 144 (full) — "full"
This is a trend indicator without redrawing Developed instead of the binary options strategy (by the color of the Martingale candlestick) Also works well in forex trading When to open trades (binary options) A signal will appear in the place with a candle signaling the current candle It is recommended to open a deal for one candle of the current timeframe M1 and M5 When a blue dot appears, open a deal up When a red dot appears, open a trade down. How to open trades on Forex. When a signal is rec
1. TrendLine Monitoring : The EA can detect immediate breaks above or below any specified trend line drawn on the chart. It can monitor up to 25 trend lines simultaneously. 2. Automatic Take Profit and Stop Loss : The EA includes functionality for setting predetermined levels of take profit and stop loss. This feature helps to establish and maintain favorable risk-to-reward ratios. 3. Trailing Stop : A trailing stop mechanism is implemented, allowing you to secure profits by automatically a
Auto SLTP Maker MT4  is an assistant for all those who forget to set StopLoss and/or TakeProfit in deal parameters, or trade on a very fast market and fail to place them in time. This tool automatically tracks trades without StopLoss and/or TakeProfit and checks what level should be set in accordance with the settings. The tool works both with market and pending orders. The type of orders to work with can be set in the parameters. It can track either trades for the instrument it runs on, or all
Simple panel of trade on your chart with OneClick VZ . This trade panel will make it easier for you. Equipped with several functions that make it very easy for you. You can try Trial Version OneClick V1 in here . This version includes: Open Order Buy Open Order Sell Open Pending Order [Buy Limit - Buy Stop - Sell Limit-Sell Stop] Close ALL orders Close Order Buy Close Order Sell Delete Pending Order [Buy Limit - Buy Stop - Sell Limit-Sell Stop] Order Management: Stop Loss Take Profit Trailin
The main idea of this indicator is rates analysis and prediction by Fourier transform. The indicator decomposes exchange rates into main harmonics and calculates their product in future. The indicator shows 2 price marks in history, depicting price range in the past, and 2 price marks in future with price movement forecast. Buy or sell decision and take profit size are displayed in a text label in the indicator window. The indicator uses another indicator as an engine for calculations - FreqoMet
ICT Kill zone and Macros Indicator mark and display the following zone times on the chart: Kill zones   Kill zone Forex Asian London Open New York Open London Close Central Bank Dealing range Kill zone Indices Asian London Open New York AM New York Lunch New York PM Power Hour Macros London 1 London 2 New York Am 1 New York AM 2 New York Lunch New York PM 1 New York PM 2 Silver bullet London Open New York AM New York PM Sessions Asian London New York Chart The display of  Kill zone ,
H4 GBPUSD Trend Scalper is a trend signal scalper The EA trades according to the trend strategy using original built-in indicator for opening and closing orders. The external inputs for limiting trading on Fridays and Mondays are available. The purpose of the strategy is to use the current trend with the most benefit. According to the results of testing and working on demo and real accounts, the best results achieved by using the Н4 timeframe on the GBP/USD pair Works on MetaTrader 4 Build 971+
The Stepping Trend Indicator     The Steppi ng Trend indicator uses the  average true range  (ATR indicator) in its calculation. This gives you control to set your own average true range period, I set the Default as 10.   Indicator Details. Green Arrow Up: This means you are at the starting point of a new bullish trend, it’s time to buy.   Red  Arrow  Down : This means you are at the starting point of a new  bearish  trend, it’ s time to sell .   What if you miss the Arrow Signal?   No
VN Trade Panel II
Vyacheslav Nekipelov
4 (1)
The new version of the trading panel, which now has the ability to separately close Buy and Sell orders, display targets for all orders on the chart, as well as the ability to use the panel to trade with brokers working on the FIFO rule. Also, the new version adds option buttons for separate management of open orders. It has a convenient visualized interface and intuitive control without a lot of additional tabs to which traders have to be distracted and switch their attention. Thanks to this
これは、キャンドルの終値を予測する指標です。 このインジケータは、主にD1チャートでの使用を目的としていますが. この指標は、従来の外国為替取引とバイナリオプション取引の両方に適しています。 インジケーターは、スタンドアロンのトレーディングシステムとして使用することも、既存のトレーディングシステムへの追加として機能させることもできます。 このインジケーターは、現在のキャンドルを分析し、キャンドル自体の内部の特定の強度係数と、前のキャンドルのパラメーターを計算します。 したがって、この指標は、市場の動きのさらなる方向性と現在のキャンドルの終値を予測します。 この方法のおかげで、この指標は、短期の日中取引だけでなく、中期および長期の取引にも適しています。 インジケーターを使用すると、市場の状況の分析中にインジケーターが生成する潜在的な信号の数を設定できます。 インジケーターの設定には、このための特別なパラメーターがあります。 また、インジケーターは、チャート上のメッセージの形式で、電子メールで、およびPUSH通知の形式で、新しい信号について通知することができます。 購入後は必ず私に書いて
Matrix is a Forex arrow indicator. Displays signals simply and clearly! The arrows show the direction of the transaction, and are colored accordingly, which can be seen in the screenshots. As you can see, trading with such an indicator is easy. I waited for an arrow to appear in the desired direction - I opened a deal. An arrow formed in the opposite direction - closed the deal. The indicator also displays the lines with the help of which the arrow signals are formed, taking into account the int
С этим драйвером вы можете превратить трендовую линию в линию Ганна, поместив значение угла в виде NxM в ее описании, например 4x1, где N - это количество поинтов, а M - количество таймфреймов на текущем графике. Драйвер автоматически отображает значение угла в виде метки у правого конца линии. По умолчанию, размер поинта равен размеру пипса, но в настройках вы можете сами указать подходящий вам размер поинта. Вы можете комбинировать этот индикатор с индикатором  Colored Channels , разделяя проб
As it is known, one of the winning parameters in Forex market is Money Management, which is more crucial than a good strategy. So it is good to know that there is a hidden fact in the market, so called pip's value. Most traders pay no attention to this fact. Here comes an example to brighten up. If you have an EUR account, pip's value for each 0.1 lots on EURGBP is around 1.10380 (it depends on the current rate) and on EURUSD is around 0.85050, it means if you take a trade on each of these curre
私たちの多くは、VPSを使用して24時間365日取引EAを実行していますが、これらの端末が稼働しているかどうかを監視するにはどうしたらよいでしょうか。 もし、クラッシュしたり、アップデートのためにシャットダウンしたらどうする?そのような場合、どのように通知されるのでしょうか? そこで、ハートビート・モニタリングの出番です。 24時間365日、すべての端末とVPSを監視することができるのです。 では、そのために必要なものは何でしょうか? 1.プロフェッショナルな監視サービスである Cronitorの 無料ユーザー アカウント 。 2.VPS上のチャート上で動作する本ツール。 MT5や接続の問題が発生した場合、メールにて通知されます(より多くの通知方法があります)。 私たちはこの技術的ソリューションを、重要なバックエンドインフラの監視に使用しているので、信頼性と有用性は実証済みです。 私のパートナーのブログ:Daniel Steinで 完全なチュートリアルをお読み ください。 もしご希望であれば、 Nodepingサービス (有料)をご利用ください。
ntroducing the "RoyalPrince Universal Indicator" - Your Gateway to Automated Forex Excellence! Unlock the full potential of your trading indicators with our revolutionary Expert Advisor. With Indicator Setup that lets you seamlessly transition your indicators into powerful automated strategies, you're in control like never before. Tailor your trades with precision using trade settings that allow you to set max trades, trade reversals, and define magic numbers for your strategy. Choose between
The indicator provides a superior alternative to price action analysis. It enables the identification of normalized patterns, which are then transformed into a graphical representation to forecast future steps within a time series. In the top-left corner, you'll find information regarding the expected prediction accuracy, determined through a complex MSQE calculation. You have the flexibility to adjust the time window, making it easy to validate the indicator's performance. Additionally, you can
インジケーターは、可能な限り最小のラグで 再描画せず にチャートに高調波パターンを表示します。インディケータトップの検索は、価格分析の波動原理に基づいています。 詳細設定では、取引スタイルのパラメータを選択できます。ろうそく(バー)のオープニングで、新しいパターンが形成されると、価格変動の可能性のある方向の矢印が固定され、変更されません。 インジケーターは、次のパターンとその種類を認識します:ABCD、Gartley(Butterfly、Crab、Bat)、3Drives、5-0、Batman、SHS、One2One、Camel、Triangles、WXY、Fibo、Vibrations。デフォルトでは、ABCDとGartleyの数字のみが設定に表示されます。多くの追加の構成可能なパラメーター。 主なパラメータ: ShowUpDnArrows-予想される方向矢印を表示/非表示 ArrowUpCode-上矢印コード ArrowDnCode-下矢印コード Show old history patterns-古いパターンの表示を有効/無効にします Enable alert messages,
MT4 バージョン: https://www.mql5.com/en/market/product/102622 MT5 バージョン: https://www.mql5.com/en/market/product/102624 ライブシグナル: https://www.mql5.com/en/signals/2208634 「Gold Buster」EA のご紹介: 次世代の動的サポート/レジスタンスおよびリスク管理システム 「Gold Buster」EA は、オープン ポジション管理とリスク分析テクノロジーの最新の進歩を活用して、金融市場でサポートとレジスタンス レベルを識別および使用する方法を再定義する、最先端の自動取引システムです。この革新的なエキスパート アドバイザー (EA) は、さまざまな取引プラットフォームや商品でシームレスに動作するように設計されており、安定した利益とリスク軽減を求める初心者と経験豊富なトレーダーの両方のニーズに対応します。 主な機能: 動的なサポートとレジスタンスの識別: 「Gold Buster」EA の核心は、動的なサポートと
このプロダクトを購入した人は以下も購入しています
Trade Assistant MT4
Evgeniy Kravchenko
4.43 (180)
取引 ごとのリスクの 計算、新規注文 の 簡単 な 設置、部分的 な 決済機能 を 持 つ 注文管理、 7 種類 のトレーリングストップなど 、便利 な 機能 を 備 えています 。 注意、アプリケーションはストラテジーテスターでは機能しません。 Manual, Description, Download demo ライン機能 チャート上にオープニングライン、ストップロス、テイクプロフィットを表示します。この機能により、新規注文を簡単に設定することができ、注文を出す前にその特徴を確認することができます。   リスク計算 リスク計算機能は、設定されたリスクとストップロス注文のサイズを考慮して、新規注文のボリュームを計算します。ストップロスの大きさを自由に設定できると同時に、設定したリスクを守ることができます。 Lot calc ボタン - リスク 計算 を 有効 / 無効 にします 。 Risk フィールドでは 、必要 なリスクの 値 を 0 から 100 までのパーセンテージまたは 預金通貨 で 設定 します 。 設定」 タブで 、 リスク 計算 の 種類 を 選択 します :
価格が一瞬で変わる可能性のある市場では、注文はできるだけ簡単にすべきだと思いますか? Metatraderでは、注文を開くたびに、開始価格を入力し、損失を止めて利益を得るウィンドウと、取引サイズを開く必要があります。金融市場の取引では、初期預金を維持し、それを増やすために資本管理が不可欠です。それで、あなたが注文をしたいとき、あなたはおそらくあなたがどれくらいの大きさの取引を開くべきか疑問に思いますか?この単一の取引であなたの預金の何パーセントを危険にさらすべきですか?この取引からどれだけの利益を得ることができますか?また、リスクに対する利益の比率はどのくらいですか?トレードサイズを設定する前に、トレードサイズがどうあるべきかという質問に対する答えを得るために必要な計算を行います。 これらすべてを自動的に行うツールがあると想像してみてください。チャートを開き、市場分析を行い、エントリーポイント、ディフェンスポイント(ストップロス)、ターゲット(テイクプロフィット)を水平線でマークし、最後にリスクのレベルを定義します。利用可能な資本の%として、このトランザクションで負担することができ、こ
The product will copy all telegram signal to MT4   ( which you are member  ) , also it can work as remote copier.  Easy to set up, copy order instant, can work with almost signal formats, image signal, s upport to translate other language to English Work with all type of channel or group, even channel have "Restrict Saving Content", work with  multi channel, multi MT5 Work as remote copier: with signal have ticket number, it will copy exactly via ticket number. Support to backtest signal. How to
MT4 to Telegram Signal Provider は使いやすく、完全にカスタマイズ可能なツールで、Telegramに信号を送信し、あなたのアカウントを信号提供者に変えることができます。 メッセージのフォーマットは 完全にカスタマイズ可能です! しかし、簡単な使用のために、あらかじめ定義されたテンプレートを選択し、メッセージの特定の部分を有効または無効にすることもできます。 [ デモ ]   [ マニュアル ] [ MT5バージョン ] [ Discordバージョン ] [ Telegramチャンネル ] セットアップ ステップバイステップの ユーザーガイド が利用可能です。 Telegram APIの知識は必要ありません。開発者が必要なものをすべて提供します。 主要機能 購読者に送信される注文の詳細をカスタマイズする機能 例えばブロンズ、シルバー、ゴールドなど、階層型のサブスクリプションモデルを作成できます。ゴールドサブスクリプションでは、すべての信号が得られますなど。 ID、シンボル、またはコメントによる注文のフィルタリング 注文が実行されたチャート
Tired of complex order placement and manual calculations? Trade Dashboard is your solution. With its user-friendly interface, placing orders becomes effortless, by a single click, you can open trades, set stop loss and take profit levels, manage trade lot size, and calculate risk to reward ratios, allowing you to only focus on your strategy. Say goodbye to manual calculations and streamline your trading experience with Trade Dashboard. Download  Demo Version  right now. You can find  Details
多機能ツール 搭載機能: ロット計算機、プライスアクション、リスク/リワードレシオ、トレードマネージャー、需要供給ゾーンなどをはじめ65以上の機能。 バージョ:デモ版   |   ユーザーマニュアル   |    MT5版 このユーティリティはストラテジー テスターでは機能しません。 ここからデモ バージョンをダウンロードして製品をテストできます。 ご不明な点や改善提案、バグの発見などございましたら、 連絡してください 。 取引プロセスを簡素化、高速化、自動化します。このダッシュボードで標準端末機能を拡張します 1. 新しい取引を開始します : ロット / リスク / RR の計算 1. Lot計算機(リスクサイズに基づく取引量計算 2. リスク計算機(ロットサイズに基づくリスク量) 3. リスク/リワードレシオ (R/R) 4. 注文のアクティベーション トリガー + Buy StopLimit / Sell StopLimit: MT4でも可  5. 仮想 SL / TP レベル (隠しSL、TP: ブローカーには見えない) 6.  Smart SL / エントリー レ
Forex Market View Dashboard and CSM
Opengates Success International
5 (1)
FFXMV Dashboard + CSM is a custom indicator combined with Currency Strength Meter . It is created to give the Traders a full view of what is going on in the market. It uses a real time data to access the market and display every bit of information needed to make a successful trading. Before attaching this Indicator to your window chart, go to your MT4's Market Watch panel and HIDE all the Currency pairs you don't need or trade and leave the rest there. The reason is that FFMV Dashboard will DISP
Exp COPYLOT CLIENT for MT4
Vladislav Andruschenko
4.7 (61)
MetaTrader4のコピー機を取引します。     それは任意の口座からの外国為替取引、ポジション、注文をコピーします。 それは最高の貿易コピー機の1つです     MT4 - MT4、MT5 - MT4     のために     COPYLOT MT4     バージョン(または     MT4 - MT5  MT5 - MT5     のために     COPYLOT MT5     バージョン)。 MT5のバージョン 完全な説明   +DEMO +PDF 購入する方法 インストールする方法     ログファイルの取得方法     テストと最適化の方法     Expforex のすべての製品 のコピー機 バージョン       MetaTrader 5 ターミナル(   МТ5 - МТ5、МТ4 - МТ5   )-   コピーロットクライアントMT5 独自のコピーアルゴリズムにより、すべての取引がマスターアカウントからクライアントアカウントに正確にコピーされます。 また、動作速度が速いことでも知られています。タフなエラー処理。 強力な機能セット。 プログ
あなたがメンバーである任意のチャンネル(プライベートおよび制限されたチャンネルを含む)からのシグナルを、直接あなたのMT4にコピーします。 このツールは、ユーザーを念頭に置いて設計されており、取引を管理および監視するために必要な多くの機能を提供しています。 この製品は、使いやすく視覚的に魅力的なグラフィカルインターフェースで提供されています。設定をカスタマイズして、数分で製品を使用開始できます! ユーザーガイド + デモ  | MT5版 | Discord版 デモを試したい場合は、ユーザーガイドを参照してください。 Telegram To MT5レシーバーは、ストラテジーテスターでは機能しません! Telegram To MT4の特長 一度に複数のチャンネルからシグナルをコピー プライベートおよび制限されたチャンネルからシグナルをコピー BotトークンやチャットIDは不要です(必要な場合は引き続き使用できます) リスク%または固定ロットを使用して取引 特定のシンボルを除外 すべてのシグナルをコピーするか、コピーするシグナルをカスタマイズするかを選択 すべてのシグナルを認識する
TradePanel MT4
Alfiya Fazylova
4.91 (85)
Trade Panel は、多機能の取引アシスタントです。 このアプリケーションには手動取引用の 50 以上の機能が含まれており、ほとんどの取引アクションを自動化できます。 購入する前に、デモ アカウントでデモ バージョンをテストできます。 デモは こちら から。 詳しい手順は こちら をご覧ください。 取引。 ワンクリックで基本的な取引操作を実行できます。 未決の注文とポジションをオープンする 注文のグリッドを開く 未決の注文とポジションを決済する ポジションの反転(買いを閉じて売りをオープンする、または売りを閉じて買いをオープンする) ポジションをロックする(反対のポジションをオープンすることで、売りポジションと買いポジションの量を等しくします) すべてのポジションを部分的に決済します。 すべてのポジションのテイクプロフィットやストップロスを共通のレベルに設定します。 すべてのポジションのストップロスを損益分岐点レベルに設定します。 注文とポジションをオープンする際に、次のことが可能になります。 確立されたリスクに応じて取引量の自動計算を使用します。 ワンクリックで複数の注文を開き
The product will copy all  Discord  signal   to MT4   ( which you are member  ) , also it can work as remote copier.  Easy to set up. Work with almost signal formats, support to translate other language to English Work with multi channel, multi MT4. Work with Image signal. Copy order instant, auto detect symbol. Work as remote copier: with signal have ticket number, it will copy exactly via ticket number. How to setup and guide: Let read all details about setup and download Discord To MetaTrade
Grid Manual MT4
Alfiya Fazylova
4.72 (18)
「Grid Manual」は、注文のグリッドを操作するための取引パネルです。 ユーティリティはユニバーサルで、柔軟な設定と直感的なインターフェイスを備えています。 それは、損失を平均化する方向だけでなく、利益を増やす方向でも注文のグリッドで機能します。 トレーダーは注文のグリッドを作成して維持する必要はありません。 すべてが「Grid Manual」によって行われます。 注文を開くだけで十分であり、「Grid Manual」は注文のグリッドを自動的に作成し、非常に閉じるまでそれに付随します。 完全な説明とデモバージョン ここ。 ユーティリティの主な機能と機能 ユーティリティは、モバイル端末から開かれた注文を含め、あらゆる方法で開かれた注文を処理します。 「制限」と「停止」の2種類のグリッドで機能します。 グリッド間隔の計算には、固定と動的(ATRインジケーターに基づく)の2つの方法で機能します。 オープンオーダーグリッドの設定を変更できます。 チャート上の各注文グリッドの損益分岐点を表示します。 各注文グリッドの利益率を表示します。 ワンクリックでグリッドから収益性の高い注文を閉じるこ
Summer 40% discount ($149 -> $88) Everything for chart Technical Analysis indicator mt4 in one tool Draw your supply demand zone with rectangle and support resistance with trendline and get alerts to mobile phone or email alert -  Risk reward indicator Video tutorials, manuals, DEMO download   here .  Find contacts on my   profile . 1.   Extended rectangles and trendlines Object will be extended to the right edge of the chart when price will draw new candles on chart. This is rectangle extend
Trade Manager は、リスクを自動的に計算しながら、取引を迅速に開始および終了するのに役立ちます。 過剰取引、復讐取引、感情的な取引を防止する機能が含まれています。 取引は自動的に管理され、アカウントのパフォーマンス指標はグラフで視覚化できます。 これらの機能により、このパネルはすべてのマニュアル トレーダーにとって理想的なものとなり、MetaTrader 4 プラットフォームの強化に役立ちます。多言語サポート。 MT5バージョン  |  ユーザーガイド + デモ Trade Manager はストラテジー テスターでは機能しません。 デモについてはユーザーガイドをご覧ください。 危機管理 % または $ に基づくリスクの自動調整 固定ロットサイズを使用するか、ボリュームとピップに基づいた自動ロットサイズ計算を使用するオプション RR、Pips、または価格を使用した損益分岐点ストップロス設定 トレーリングストップロス設定 目標に達したときにすべての取引を自動的に終了するための 1 日あたりの最大損失 (%)。 過度のドローダウンからアカウントを保護し、オーバートレードを防ぎま
VirtualTradePad mt4 Extra
Vladislav Andruschenko
4.88 (56)
ワンクリックで取引できるトレーディングパネル。ポジションと注文の操作!チャートまたはキーボードから取引。 手動取引用の取引パネル。チャート(チャートウィンドウ)またはキーボードから取引できます。開閉、リバース、ロックポジションと注文を処理する МetaТrader4のメインオーダーのトレーディングコントロールパネル:売買、売却、売却、売却、売却、閉じる、削除、修正、トレーリングストップ、ストップロス、takeproft MT5のバージョン 完全な説明   +DEMO +PDF 購入する方法 インストールする方法     ログファイルの取得方法     テストと最適化の方法     Expforex のすべての製品 シンボルウィンドウからの取引とキーボードからの取引! あなたはMetaTrader 4ターミナル - バーチャルコントロールパネルVirtualTradePadのためのユニークなプラグインを持っています。 Description on English 注意!  ストラテジーテスターの 取引方法を学びたい場合は、無料の TesterPad ユーティリティをチェック
Summer 50% discount ($199 -> $99) Advanced trading tool: One click smart orders that execute under your conditions Developed by trader for trading community:  position size calculator (lot size), open position after price action, strategy builder, set and forget trading, mobile notifications... Risk Management -  Risk percentage position size calculator, gain percentage, target risk reward ratio, spread and commissions are included in calculations 7 Advanced order types   - Set and forget tra
The Expert Advisor will help you forward all pop-up alert with screenshot from  MetaTrader 4 to Telegram channel/ group, also forward all notifications to Telegram. Parameters  -  Telegram Bot Token - create bot on Telegram and get token.  -  Telegram Chat ID  - input your Telegram user ID,  group / channel ID  -  Forward Alert - default true, to forward alert.  -  Send message as caption of Screenshot - default false, set true to send message below Screenshot  How to setup and guide  - Telegram
DrawDown Limiter MT4
Haidar, Lionel Haj Ali
5 (8)
Drawdown Limiter EA You are in the right place if you were searching for Drawdown control, Drawdown limiter, Balance protection, Equity Protection or Daily Drawdown Limit related to Prop Firm, FTMO, or Funded account trading, or if you want to protect your trading account. Have you suffered from controlling your drawdown when trading funded accounts? This EA is meant for you. Prop firms usually set a rule called “Trader Daily Drawdown”, and if it is not respected, you are disqualified.  I am an
このエキスパートアドバイザーは、コストのかかるドローダウンを防止したり、取引ルールを遵守したりするために、取引口座のエクイティを常に監視しています。特定のルールセットに違反すると、EAは警告を発し、すべての取引を終了し、場合によっては、保留中のすべての注文を削除します。オプションで、すべてのチャートを閉じて、アカウントで動作しているすべてのEAを削除することもできます。このEAは、FTMOチャレンジやPZチャレンジなどの自己勘定取引チャレンジに特に役立ちます。 [ インストールガイド | アップデートガイド | トラブルシューティング | FAQ | すべての製品 ] 次の機能が実装されており、自由に有効または無効にできます。 エクイティ最大損失、別名トレーリングエクイティドローダウン 毎日のエクイティ最大損失 エクイティ利益目標 エクイティトレーリングストップ その他の利点は次のとおりです。 使いやすいデッド 自己勘定取引会社やトレーダーに便利 あらゆる種類のアラートを実装します ターミナルに報告する 技術的な案内: それはそれ自身で最大エクイティとデイリーエクイ
このプログラムでは、非常に使いやすいユーザーインターフェースを使用して、MetaTraderアカウントからすべての取引を直接Notionにエクスポートできます。  MT5 バージョン  |  ユーザーガイド + デモ 始めるには、ユーザーガイドをご利用いただき、Notionのテンプレートをダウンロードしてください。 デモが必要な場合は、ユーザーガイドをご覧ください。ストラテジーテスターでは機能しません! 主な特長 取引口座からすべての取引をNotionにエクスポート 最終日からの取引をエクスポートする 最終週からの取引をエクスポートする 最終月からの取引をエクスポートする カスタム時間範囲からの取引をエクスポートする すべての新しい閉じられた取引を自動的にNotionに送信する 注文タイプ、ボリューム、オープン時間、クローズ時間などのエクスポートに含めるフィールドを選択する 始め方 上記のユーザーガイドに移動するか、EAを起動して「接続ヘルプを取得」をクリックしてください。 接続したら、「開始:すべてをエクスポート」をクリックして、履歴からすべての現在の取引をNotionに送信
Mentfx Mmanage
Anton Jere Calmes
5 (15)
The added video will show you the full functionality, effectiveness, and simplicity of this trade manager. Drag and Drop Trade Manager. Draw your entry and have the tool calculate the rest. Advanced targeting and close portions of a trade directly available in tool (manage trades while you sleep). Market order or limit order on either side with factored spread. Just draw the entry, the tool does the rest. Hotkey setup to make it simple. Draw where you want to enter, and the stop loss, the tool c
DFGX Dashboard
Tsvetan Tsvetanov
5 (2)
Take your trading to the next level with DFGX - our second generation Dynamic Fibonacci Grid. This new, powerful and easy to use application is specially designed and optimized for contrarian intraday trading, scalping and news trading on the Forex market. This system is the ideal solution for active professional traders and scalpers who are looking for innovative ways to optimize their strategy. The system also provides excellent opportunity for new traders who want to learn to trade in a syste
Trade Copier Global: The name speaks for itself. This copier allows you to copy orders between MT4 terminals even if they are not installed on the same computer. Features Copying trades between MT4 terminals around the world with a short delay. Automatically recognizes symbol prefixes. Can connect many Slaves to the same Master. Supports pending and market orders. Supports partial order close (with limitations, see below) Can send messages and notifications to the Slaves from the Master Severa
This EA Utility allows you to manage (with advanced filtering) unlimited open orders (manual or EA) with 16 trailing stop methods: fixed, percent, ATR Exit, Chandelier Exit, Moving Average, Candle High Low Exit, Bollinger Bands, Parabolic, Envelope, Fractal, Ichimoku Kijun-Sen, Alligator, Exit After X Minutes or Bars, RSI and Stochastic. The trailing stop can be either real or virtual, and you can exit fully or with a partial close percent on touch or bar close.  Moreover, you can add (overr
[跟单系统] T he most friendly Copier interactive interface, the most abundant easy-to-use functions, and the best Copy solution.    EASY   : Easy to use, load and select the Master or SLAVE to use easily  FAST:   Quickly copy orders, algorithmic optimal follow-up mechanism, priority calculation of new signals, priority queue processing received special signals Multiple:   1. Support multiple signals to be sent at the same time, multiple accounts can select multiple accounts to copy at the same time
News Trader Pro is a unique robot that allows you to trade the news by your predefined strategy. It loads every piece of news from several popular Forex websites. You can choose any news and preset the strategy to trade it, and then News Trader Pro will trade that news by selected strategy automatically when the news comes. News release gives opportunity to have pips since the price usually has big move at that time. Now, with this tool, trading news becomes easier, more flexible and more exciti
この製品は、ニュースタイム中にすべてのエキスパートアドバイザーと手動チャートをフィルタリングするため、急激な価格変動によるマニュアルトレードのセットアップの破壊や他のエキスパートアドバイザーによって入力された取引について心配する必要はありません。この製品には、ニュースのリリース前にオープンポジションとペンディングオーダーを処理できる完全な注文管理システムも付属しています。 The News Filter  を購入すると、将来のエキスパートアドバイザーのためにビルトインのニュースフィルターに頼る必要はなく、今後はすべてのエキスパートアドバイザーをここからフィルタリングできます。 ニュース選択 ニュースソースは、Forex Factoryの経済カレンダーから取得されます。 USD、EUR、GBP、JPY、AUD、CAD、CHF、NZD、CNYなど、任意の通貨数に基づいて選択できます。 Non-Farm(NFP)、FOMC、CPIなどのキーワード識別に基づいて選択することもできます。 影響レベルによってフィルタリングするニュースを選択することができ、低、中、高の影響範囲から選択できます
I present to your attention a powerful utility for predicting the future movement of an asset based on W.D. Ganna’s law of vibration. This utility analyzes the selected market model and provides codes for future possible market movement patterns. If you enter the selected code into the appropriate box, you will receive a forecast of the potential market movement. The utility has the ability to display several potential forecast models. The forecast is not yet tied to time and price and gives th
Let Your Ideas Earn For You. Convert your Ideas and Strategies in to automated trading bots directly on MT4. Visual Strategy Builder with Instant Results on the chart. This One of a kind strategy builder, allows you to specify rules and visually see the signals based on those rule as you create them. Visit the link for Group, User Manual, Video Examples Why Use LBM LBM is an essential tool for traders of all levels. It allows traders to create strategies quickly and easily, and to test th
The most advanced news filter and drawdown limiter on MQL market NEW: Take a Break can be backtested against your account history! Check the " What's new " tab for details. Take a Break has evolved from a once simple news filter to a full-fledged account protection tool. It pauses any other EA during potentially unfavorable market conditions and will continue trading when the noise is over. Typical use cases: Stop trading during news/high volatility (+ close my trades before). Stop trading when
作者のその他のプロダクト
This indcator shows the trend with the color histogram. It is simple and easy to use. Usage: If the histogram changes from the aqua to the fuchsia, which means the trend is up. If the histogram changes from the fuchsia to the aqua,which means the trend is down. Inputs: MaPeriods: the periods of moving average. f1: the multiplier of inner bands f2: the multiplier of outer bands Popup Window Alert Email Alert Mobile Push Alert Alerts When the trend changes from the long trend to the short trend or
この指標は、8 つの主要通貨 (USD、EUR、GBP、AUD、NZD、CAD、CHF、JPY) の相対的な強さを示します。 力の値は 0 ~ 100 の範囲で正規化されます。 60 を超える値は強いことを意味します。 40未満の測定値は衰弱を示します。 チケット Only Show Current Pair   -       true の場合、現在のチャート ペアのみが表示されます。それ以外の場合は、8 つの曲線すべてが表示されます。 Bars To Show         - フォース カーブを表示するバーの数。 Ma Periods To Smooth Curves     : 強度曲線を平滑化するための移動平均期間 Suffix       - 文字の接尾辞。今すぐインストールする必要はありません。 Font Size       - 画像のフォント サイズ、デフォルトは 13 Row Space       - 描画線間の間隔、デフォルトは 17 2 つの曲線が交差したときに警告を発するために、次の 3 つの入力が提供されます。 Select Cross at w
この指標は、8 つの主要通貨 (USD、EUR、GBP、AUD、NZD、CAD、CHF、JPY) の相対的な強さを示します。 力の値は 0 ~ 100 の範囲で正規化されます。 60 を超える値は強いことを意味します。 40未満の測定値は衰弱を示します。 基本原則 USD、EUR、GBP、AUD、NZD、CAD、CHF、JPYの8つの通貨ペアがあり、それぞれ2つのペアを組み合わせると合計28のペアになります。逆アルゴリズムを使用して、8つの通貨の強さを抽出します。これらの28のペアのうち EURUSD,GBPUSD,AUDUSD,NZDUSD, USDCAD,USDCHF,USDJPY,EURGBP, EURAUD,EURNZD,EURCAD,EURCHF, EURJPY,GBPAUD,GBPNZD,GBPCAD, GBPCHF,GBPJPY,AUDNZD,AUDCAD, AUDCHF,AUDJPY,NZDCAD,NZDCHF, NZDJPY,CADCHF,CADJPY,CHFJPY 主な用途 強度値が 60 を超えると強いことを意味し、40 未満は弱いことを意味します。 最も強い通貨
This Expert Advisor is designed to manage orders. It offers the following functions: Set a stop loss for an order having none. Set a take profit for an order having none. Close the last order if the total orders of a symbol are over the setting. Close the order if its lots are over the setting. Close the order if its profit in pips is over the setting. Close the order if its loss in pips is over the setting. Close the order if its profit in amount is over the setting. Close the order if its loss
FREE
このEAには次のような特徴があります。 これは、ソートされたペアのパワーを提供します。       主要な28ペア 、         取引で強いペアまたは弱いペアを簡単に選択できるようになります。 ペアパワーはインジケーターを使用して計算されます。       EAに組み込まれている 通貨相対強度 。デフォルトの入力はD1,90,0です。 主要な28の外国為替ペアに限定されず、あらゆるシンボルまたはペアを取引できます。 6 つのタグが含まれています:       PPI、マニュアルトレード、グリッド売り、グリッド買い、自動クローズ、損益分岐点。 PPI     主要な28の外国為替ペアのソートされたペアパワーです。       「   PPI   」 という用語は 「 ペアパワーインデックス 」 の略です 。     ペアをクリックすると、チャートのシンボルがすぐに変更されます。 マニュアルトレード     -- ボタンをクリックして取引、オープン売り、SL/TP でオープン買い、ロット グリッドセル     -- 売り注文のグリッドスペースを設定して自動的に取引します グリッド購入
FREE
インジケーターには 2 つの部分が含まれています。 パート I: カラーキャンドルが主要なトレンドを示す カラーローソク足とは、ローソク足の色で相場の状態を識別することです。 スクリーンショットに示されているように、色がアクアの場合、市場はロング注文を発注するか、ショート注文を終了する必要がある状態です。色がトマトの場合は、ショート注文を行うか、ロング注文を終了する時期です。 色が変化している場合は、その完了を (現在のバーが閉じるまで) 待つことをお勧めします。 パート II: バンドを描く 内側のバンドは安全領域として定義され、外側のバンドはクローズオーダー用です。 以下のような取引戦略: 色がアクアで、価格が内側のバンド内にある場合は、ロング注文を出します。価格が外側のバンドを超えたら、注文を閉じる時期です。 色がトマトで、価格が内側のバンドにある場合は、ショート注文を出します。価格が外側のバンドを越えたら、注文を閉じる時期です。 注:価格が内側のバンドの場合のみエントリーマーケットです。これは非常に重要です。 入力パラメータ ShowC
観察。このコンサルタントはヘッジ口座のみを対象としています。メタトレーダー4のバージョン     Quick Panel Pro 特徴 バッチの計算はすばやく簡単です。停止線を移動すると、計算はすぐに行われます。 ほとんどの業務操作は、これらのパネルのボタンをクリックするだけですぐに完了できます。 緑色のボタンをクリックするだけで、パネルをすばやく切り替えることができます。 マウスをクリックしてストップロスとテイクプロフィットを素早く変更します(バックテストには使用できません) 黄色の背景のパネルに平均価格を表示し、平均価格の線を描きます。       ここをクリック コントロールパネル ダッシュボードは 2 つの列で構成されます。左の列は売りに関するもの、右の列は買いに関するものです。 売り: 売り注文をオープンします。 最初: 最初の売り注文を閉じます。 1つ目は営業時間についてです。 最後に: 最後の売り注文を閉じます。最後のは営業時間についてです。 all+: 利益を伴ってポジションを閉じるための売り注文。 all-: 損失で売り注文をクローズします。 max+: 最大の
This EA is designed to monitor the slippage of opening and closing orders, and save the records in files. It is useful to record the slippage and evaluate brokers. The record files are saved in the folder  MT4_Data_Folder\MQL4\Files.  Go to "File " --> "Open Data Folder" . Warning : Do NOT open the files directly, otherwise it will affect the exectution of EA, just copy them to another folder and open them. Usage: Open a chart and load the EA on it, just need only one EA to run, it monitors a
FREE
This EA is designed to monitor the slippage of opening and closing orders, and save the records in csv file. It is useful to record the slippage and evaluate brokers. The record files are saved in the folder  MT5_Data_Folder\MQL5\Files.  Go to   "File " --> "Open Data Folder"   . Warning :   Do NOT open the files directly, otherwise it will affect the exectution of EA, just copy them to another folder and open them. Usage: Open a chart and load the EA on it, just need only one EA to run, it m
FREE
This is a MetaTrader 5 script. It helps to summarize all trades into every symbol. Input Select Period: This is 7-option input. It includes Last Month, This Month, Last Week, This Week, Today, All History, and Date Specified. Specify Starting Date: Enter a date if you selected Date Specified in "Select Period" input. Specify Ending Date: Enter a date if you selected Date Specified in "Select Period" input. The summary is saved into a file in MQL5\Files folder. MT4 Version:   https://www.mql5.c
FREE
This is a MetaTrader 4 script. It helps to export all trades into a CSV file as per Symbol and selected periods. Input Select Symbol: This is 2-option input. Select current symbol or all symbols to export its orders. Select Period: This is 7-option input. It includes Last Month, This Month, Last Week, This Week, Today, All History, and Date Specified. Specify Starting Date: Enter a date if you selected Date Specified in "Select Period" input. Specify Ending Date: Enter a date if you selected D
FREE
This is a MetaTrader 4 script. It helps to summarize all trades into every symbol. Input Select Period: This is 7-option input. It includes Last Month, This Month, Last Week, This Week, Today, All History, and Date Specified. Specify Starting Date: Enter a date if you selected Date Specified in "Select Period" input. Specify Ending Date: Enter a date if you selected Date Specified in "Select Period" input. The summary is saved into a file in MQL4\Files folder. Also, there is pop-up window for
FREE
インジケーターには 2 つの部分が含まれています。 パート I: カラーキャンドルが主要なトレンドを示す カラーローソク足とは、ローソク足の色で相場の状態を識別することです。 スクリーンショットに示されているように、色がアクアの場合、市場はロング注文を発注するか、ショート注文を終了する必要がある状態です。色がトマトの場合は、ショート注文を行うか、ロング注文を終了する時期です。 色が変化している場合は、その完了を (現在のバーが閉じるまで) 待つことをお勧めします。 パート II: バンドを描く 内側のバンドは安全領域として定義され、外側のバンドはクローズオーダー用です。 以下のような取引戦略: 色がアクアで、価格が内側のバンド内にある場合は、ロング注文を出します。価格が外側のバンドを超えたら、注文を閉じる時期です。 色がトマトで、価格が内側のバンドにある場合は、ショート注文を出します。価格が外側のバンドを越えたら、注文を閉じる時期です。 注:価格が内側のバンドの場合のみエントリーマーケットです。これは非常に重要です。 入力パラメータ ShowC
このパネルはエキスパートアドバイザーであり、6 つのグループの取引パネルを提供します。 MT5 バージョン:   クイックパネルカバレッジ 特徴 ほとんどの取引操作は、これらのパネルのボタンをクリックすることで迅速に実行できます。 パネルの変更は緑色のボタンをクリックするだけで簡単に行えます。 EA はストラテジー テスターの視覚的なチャート上で実行でき、履歴データに基づいて取引を練習する簡単な方法を提供します。 マウスをクリックしてストップロスとテイクプロフィットを素早く変更します(バックテストには使用できません) 背景が黄色のパネルに平均価格を表示し、平均価格の線を描きます。       ここをクリック パネル ダッシュボードには 2 つの列が含まれています。左の列は売りに関するもので、右の列は買いに関するものです。 売る:     売り注文をオープンします。 初め:     最初の売り注文をクローズします。 1 つ目はオープンタイムを指します。 最後:     最後の売り注文をクローズします。最後のはオープンタイムを指します。 すべて+:     売り注文を利益を上げてク
このEAは、柔軟なリスク管理と6セットの取引パネルを統合したプロフェッショナルな取引ツールです。 MT5 バージョン:  Quick Panel Pro Hedging 特徴 バッチの計算はすばやく簡単です。停止線を移動すると、計算はすぐに行われます。 ほとんどの業務操作は、これらのパネルのボタンをクリックするだけですぐに完了できます。 緑色のボタンをクリックするだけで、パネルをすばやく切り替えることができます。 EA はストラテジー テスターで実行できます。この機能を使用して、戦略をトレーニングしたり確認したりできます。 (無料ですので、お試しください)。 マウスをクリックしてストップロスとテイクプロフィットを素早く変更します(バックテストには使用できません) 黄色の背景のパネルに平均価格を表示し、平均価格の線を描きます。       ここをクリック コントロールパネル ダッシュボードは 2 つの列で構成されます。左の列は売りに関するもの、右の列は買いに関するものです。 売り: 売り注文をオープンします。 最初: 最初の売り注文を閉じます。 1つ目は営業時間についてです。 最後に:
This indicator shows the main trend on the current chart. Features This indicator includes two bands, one is the inner white bands, another is the outer blue bands. If the white dotted line crosses down the white solid line, this means that the trend has changed to be bearish. If the white dotted line crosses up the white solid line, this means that the trend has changed to be bullish. Once the crossing happened, it will not repaint. Settings ShowColorCandle: if 'true', it will show the colo
This indicator shows main trend, entry zone and exit zone. This is a muti-timeframe indicator, so it is always repainting in the current period of the higher timeframe. Features Colorful Histogram: it indicates the main trend, the tomato means the market is bearish,and the sky blue means the market is bullish. Inner Blue Bands: it is entry zone for entry market, the market is relatively safe for entry. Outer Yellow Bands: it is exit zone for exit market, the market is oversold or overbought.
このアドバイザーは、複数のペアをワンクリックで取引できるダッシュボードです。 クリック   開ける   選択したペアの注文を開くボタン。 クリック   近い   選択したペアの注文を閉じるボタン。 注文ロットはユーザーが入力した番号です。正の数は買い注文に対応し、負の数は売り注文に対応します。 部分的に閉じるのではなく、注文全体を閉じるには、   「CLOSE」 ボタンをクリックします。クロージングアクションはロット数とは関係ありません。 マジックインプットを 0 に設定すると、アドバイザーが同時に手動注文を閉じるのを手伝ってくれます。 エントリーマジックを別のアドバイザーのマジックで構成すると、アドバイザーは、別のアドバイザーがオープンした注文を同時にクローズするのに役立ちます。 三角生垣   ワンクリックで。 取引シンボルはカスタマイズ可能です。市場観察からインポートするか、ユーザーが入力します。 禁止: Magic - アドバイザーのマジックナンバー。 MaxLots: 最大ロット。ロット数がこのMaxLotsを超える場合、注文ロットはMaxLotsとなります。 StopL
This indicator is designed to show the pair power of the major 28 paris with RSI,Stochostic,and CCI. The power value is sorted from the weak to the strong. The weaker pairs: the pairs occurs at least 2 times in the top 3 rows The stronger pairs:   the pairs occurs at least 2 times in the bottom 3 rows Users can add another symbol, so it can calculate 28+1 symbols. My advice: https://www.mql5.com/en/blogs/post/729880 A free EA with Pair Power Matrix  ---  https://www.mql5.com/en/blogs/post/732
The purpose of the inidcator is to identify the reversal point. The blue arrow is buy signal and the yellow star is its stop loss. The red arrow is sell signal and the yellow star is its stop loss. Alert feature: if there is a signal, the indicator will send alerts of  popup window,email or mobile push. Inputs: Popup Window Alert: it is false in default Email Alert : it is false in default Mobile Push Alert: it is false in default. MetaTrader 5 Version: Reversal Point Please note that the singa
注: この EA はヘッジ口座でのみ機能します。メタトレーダー4のバージョン     クイックパネル このパネルは、6 つのグループの取引パネルを提供するエキスパートアドバイザーです。 特徴 ほとんどの取引操作は、これらのパネルのボタンをクリックすることで迅速に実行できます。 パネル間の切り替えは緑色のボタンをクリックするだけで簡単に行えます。 EA はストラテジー テスターの視覚的なチャート上で実行でき、履歴データを使用して取引を練習する簡単な方法を提供します。 マウスをクリックしてストップロスとテイクプロフィットを素早く変更します(バックテストには使用できません) 背景が黄色のパネルに平均価格を表示し、平均価格の線を描きます。       ここをクリック パネル ダッシュボードには 2 つの列が含まれています。左の列は売りに関するもので、右の列は買いに関するものです。 sell:     販売注文を開きます。 first:     最初の販売注文をクローズします。 1つ目は営業時間についてです。 last:     最後の販売注文を閉じます。最後のは営業時間についてです。
Gamma Bands   This indcator shows the trend with the color histogram. It is simple and easy to use. Usage: If the histogram changes from the aqua to the fuchsia, which means the trend is up. If the histogram changes from the fuchsia to the aqua,which means the trend is down. Inputs: MaPeriods: the periods of moving average. f1: the multiplier of inner bands f2: the multiplier of outer bands   Popup Window Alert Email Alert Mobile Push Alert Alerts When the trend changes for the long trend to the
The purpose of the inidcator is to identify the reversal point. The blue arrow is buy signal and the yellow star is its stop loss. The red arrow is sell signal and the yellow star is its stop loss. Please note that the singal is against trend,it could be continual fail. Alert feature: if there is a signal, the indicator will send alerts of  popup window,email or mobile push. Inputs: Popup Window Alert: it is false in default Email Alert : it is false in default Mobile Push Alert: it is false in
このアドバイザーは次の機能を提供します。 ポジションをオープンする: 価格がトレンドラインを超えたら、ロング注文またはショートオーダーをオープンします。 クローズ: 価格がトレンドラインを超えたら、ロングポジションまたはショートポジションをクローズします。 トレーリングストップロス – EA はトレンドラインに沿って、ロング注文のストップロスを増加させたり、ショート注文のストップロスを減少させ続けます。 ラインはトレンドラインでも水平線でも構いません。     傾向線は半径または線分にすることができます。線分には、その線が存在する期間のみ取引するという特別な機能があります。 ポジションをオープンおよびクローズできるこれらのラインには、特定の名前が付いています。 EA では、手動で線を描画する代わりに、線描画パネルを提供します。 すべてのオープンポジションとクローズポジションのスクリーンショットは、MQL4/Files/Cross Trend Line to Trade フォルダーに保存されます。 EA はヘッジ口座でのみ機能します バージョンMT4 :   https://www.
このアドバイザーは、複数のペアをワンクリックで取引できるダッシュボードです。 クリック   開ける   選択したペアの注文を開くボタン。 クリック   近い   選択したペアの注文を閉じるボタン。 注文ロットはユーザーが入力した番号です。正の数は買い注文に対応し、負の数は売り注文に対応します。 部分的に閉じるのではなく、注文全体を閉じるには、   「CLOSE」 ボタンをクリックします。クロージングアクションはロット数とは関係ありません。 マジックインプットを 0 に設定すると、アドバイザーが同時に手動注文を閉じるのを手伝ってくれます。 エントリーマジックを別のアドバイザーのマジックで構成すると、アドバイザーは、別のアドバイザーがオープンした注文を同時にクローズするのに役立ちます。 三角生垣   ワンクリックで。 取引シンボルはカスタマイズ可能です。市場観察からインポートするか、ユーザーが入力します。 禁止: Magic - アドバイザーのマジックナンバー。 MaxLots: 最大ロット。ロット数がこのMaxLotsを超える場合、注文ロットはMaxLotsとなります。 StopL
フィルタ:
レビューなし
レビューに返信
バージョン 10.2 2023.10.30
Code Optimization
バージョン 10.1 2023.10.27
Fixed a minor bug.
バージョン 10.0 2023.10.27
Code Optimization
バージョン 9.9 2023.10.24
Code Optimization
バージョン 9.8 2023.10.24
Fixed a bug accidentally introduced during the last upgrade
バージョン 9.7 2023.10.24
Enhance the expert log, now it is more detailed and complete.
バージョン 9.6 2023.10.24
1. Code Optimization
2. Detect if the MT4 terminal is disconnected from the broker's server and record the logging information in the expert tab.
バージョン 9.5 2023.10.23
Changed line's role "Open Position" to "Open Order", it would be more accurate.
バージョン 9.4 2023.10.23
Fixed a bug about "Cls-Buy-First-1", it occasionally occured to close two orders before it was deleted. Now this bug was fixed.
バージョン 9.3 2023.10.23
Code Optimization.
バージョン 9.2 2023.10.23
Code Optimization.
バージョン 9.1 2023.10.22
これはメジャー アップデートであり、次の点を含む大幅な改善が加えられています。

1. ボタンパネルのデザインが一新され、以前よりも美しく、より便利になりました。

2. トレンドラインの名前が再設計され、覚えやすくなりました。たとえば、ロング注文用の前のライン CBALL1 は、理解しやすい Cls-Buy-All-1 という名前に変更されました。

2. 早期警告機能の内容が再設計され、より具体的かつ完全な情報が提供されるようになりました。
バージョン 7.1 2023.10.13
Automatically adapt to HD monitors
バージョン 7.0 2017.07.24
Now new version 7.0 updated as below:

1. Add inputs TrailStopLevelPipsBuy and TrailStopLevelPipsSell as threshold to activate trailing stop.
2. Cancel input FullInstruction file, it is not necessary.
3. Cancel input ShowLineDescription, it is not necessary.
4. Add buttons to help to draw lines (trend or horizontal), which makes EA more easy to use:
4.1 Click the green button to change the panel.
4.2 Click the violet button to select line type (trend line or horizontal line).
4.3 Click the button Del to delete lines.
4.4 Click the button X to close the panel.
バージョン 6.5 2017.03.30
Updated to the new terminal build.