Variable Moving Average VMA MT5
- インディケータ
- Chidera Anakpe
- バージョン: 1.0
- アクティベーション: 5
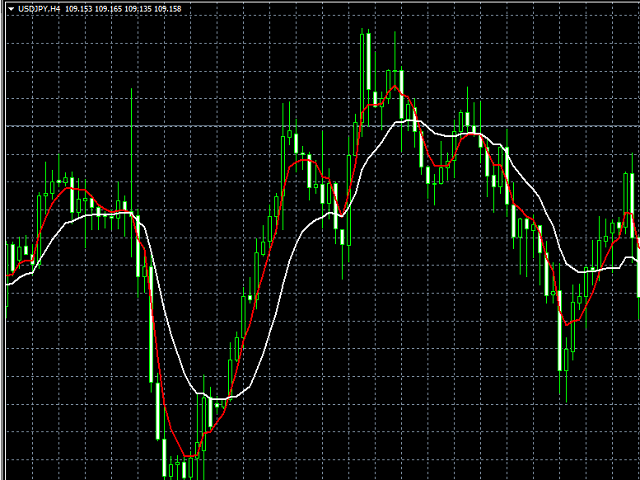
The VMA is an exponential moving average that adjusts its smoothing constant on the basis of market volatility. Its sensitivity grows as long as
the volatility of the data increases. Based on the Chande's Momentum Oscillator, the VMA can automatically adjust its smoothing period as
market conditions change, helping you to detect trend reversals and retracements much quicker and more reliable when compared to
traditional moving averages.