Dunnigan Indicator
- インディケータ
- Leonardo Sposina
- バージョン: 1.4
- アップデート済み: 11 11月 2020
- アクティベーション: 5
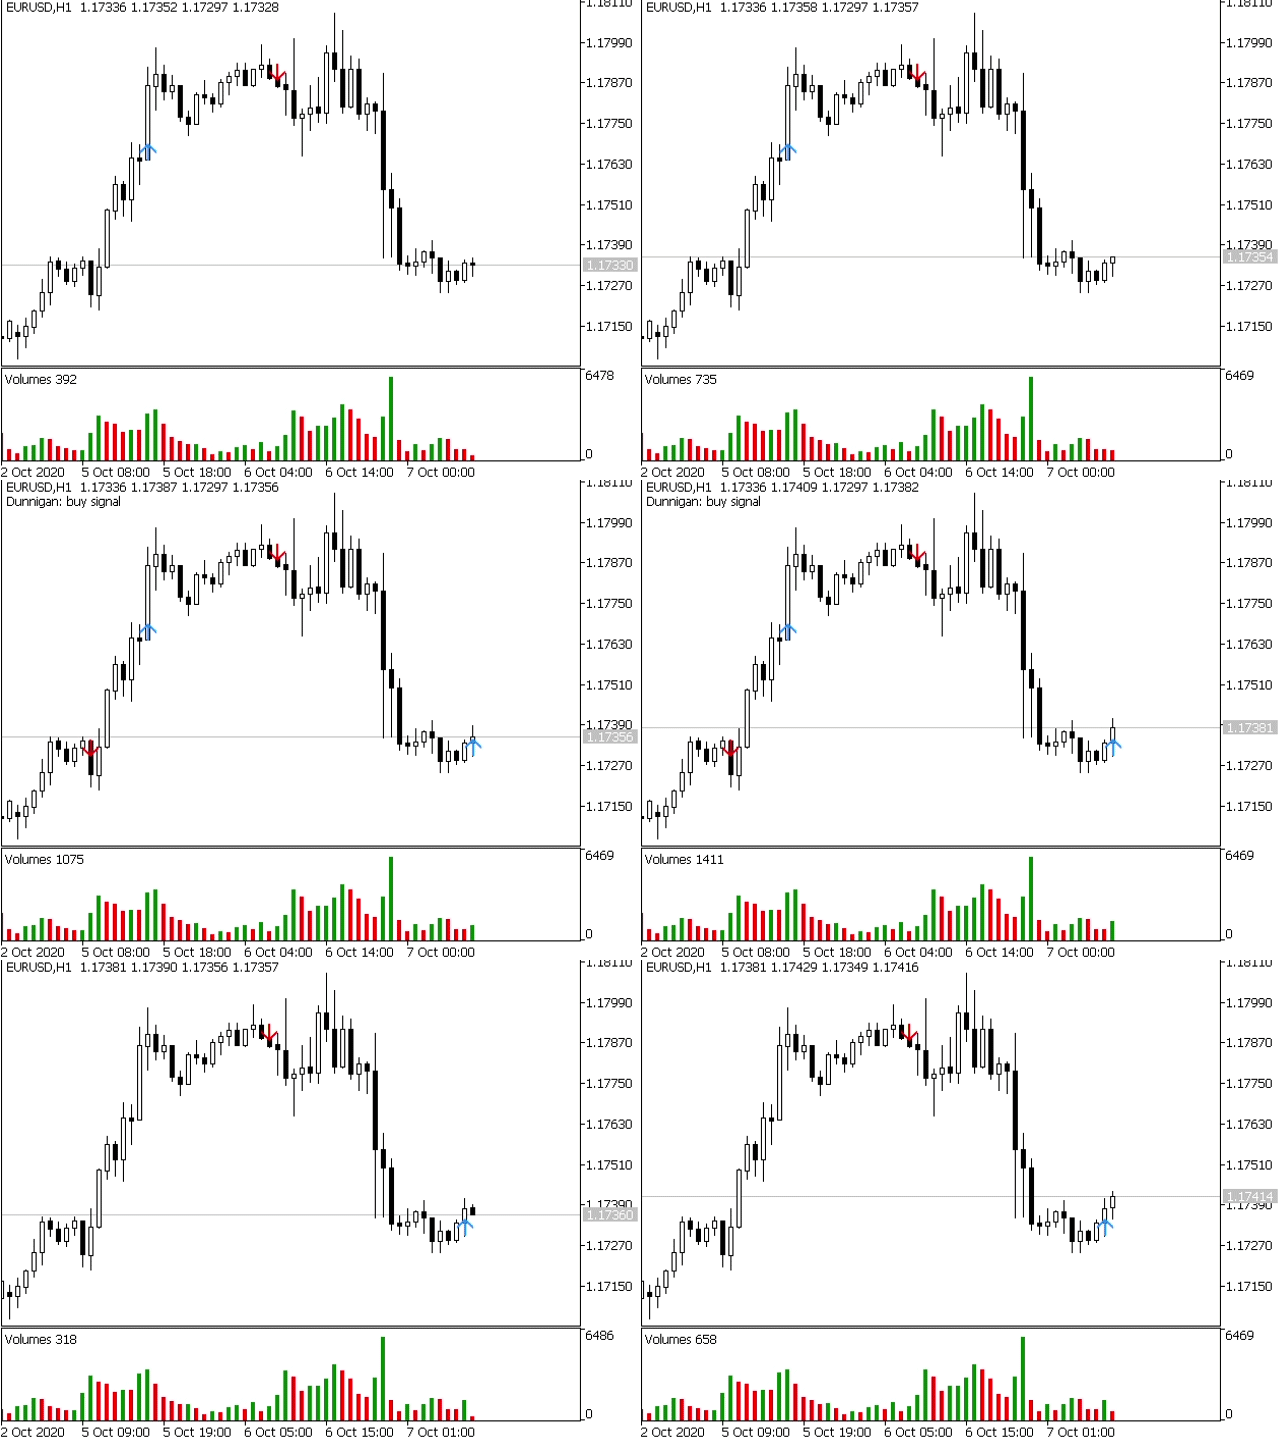
This is a trend indicator based on a strategy created by William Dunnigan that emit signals to buy or sell on any timeframe and can assist in decision making for trading on stock market or Forex.
The signals are fired according to the following rules:
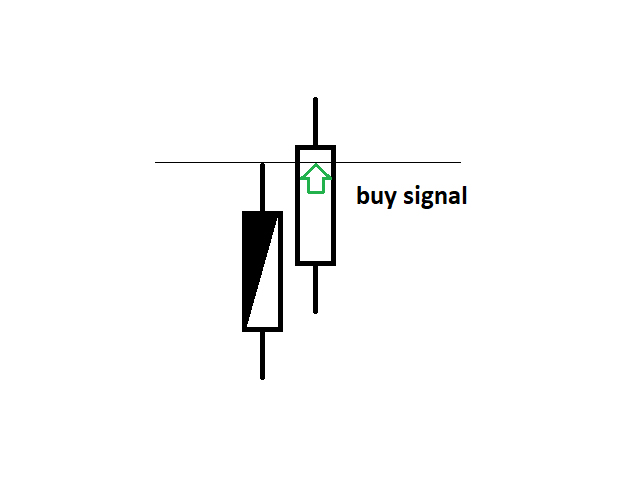
- Buy Signal = Fired at the first candlestick in which close price is higher than the higher price of the last candlestick. The higher and lower prices of the current candlestick must be higher than the corresponding ones of the last candlestick as well.
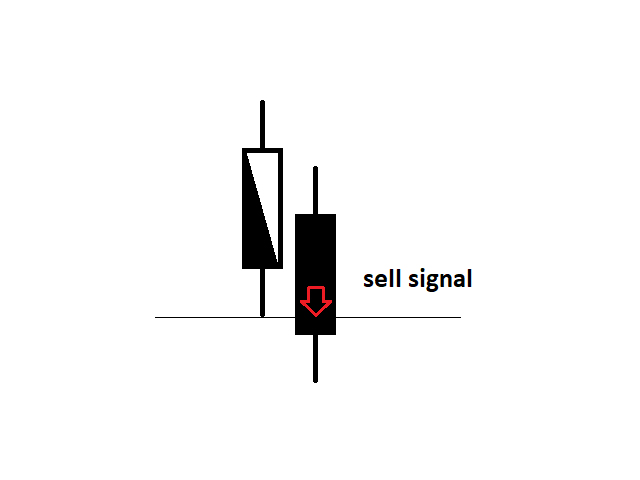
- Sell Signal = Fired at the first candestick in which close price is lower than the lower price of the last candlestick. The higher and lower prices of the current candlestick must be lower than the corresponding ones of the last candlestick as well.
Obs: Both signals are confirmed by the increase in the tick volume before firing.
Inputs:
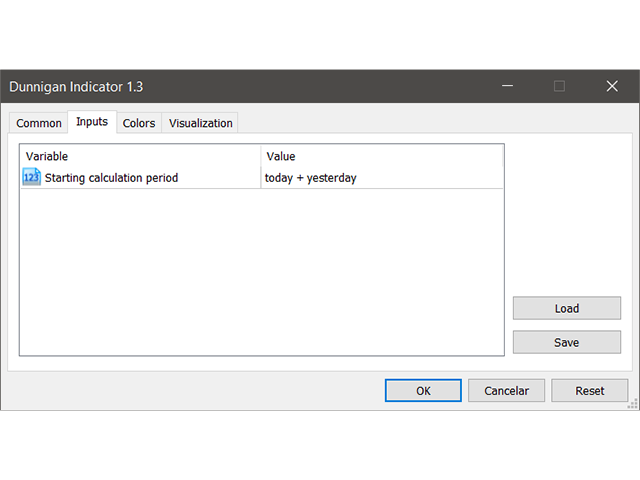
- Starting calculation period: This is the starting calculation period for the Dunnigan signals. Options are "today", "today + yesterday", "today + past 2 days", "today + past 3 days", "today + past 4 days", "today + past 5 days" and "today + past 6 days".
Colors:
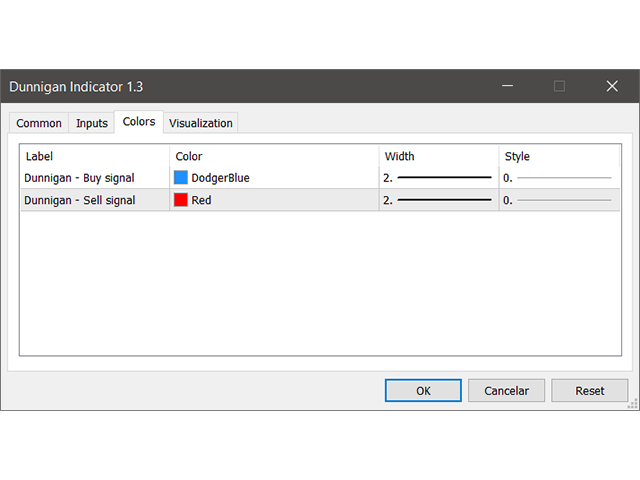
- Dunnigan signal arrows color and width.
