Market View Indicator
- インディケータ
- Roy Meshulam
- バージョン: 1.1
- アップデート済み: 29 11月 2019
- アクティベーション: 5
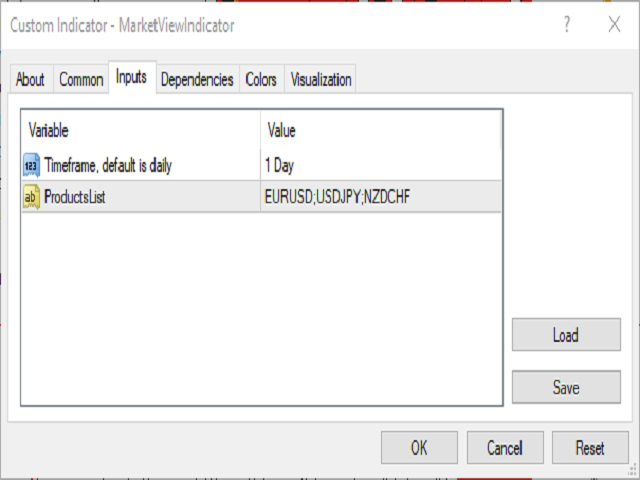
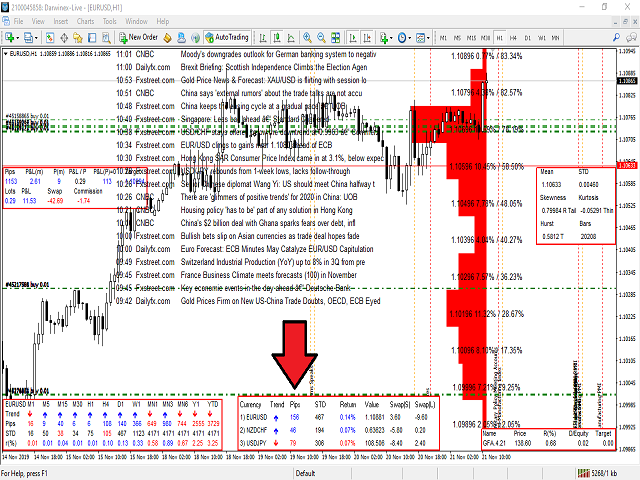
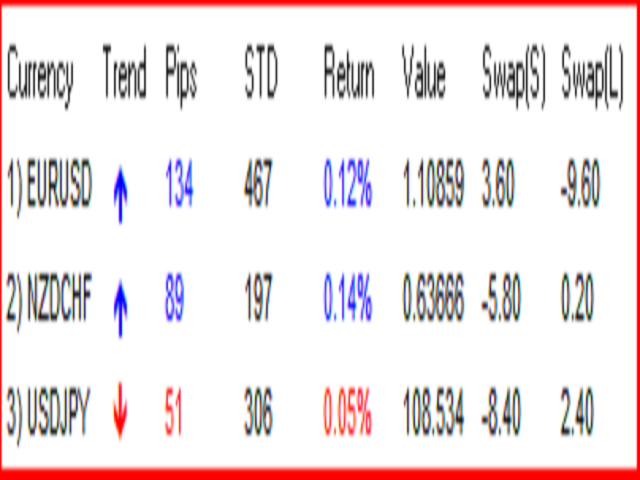
With the Market View Indicator, you may monitor in a dedicated panel as many as products as you wish. Just add the indicator to the chart, enter the prodcuts you want to view and the change period to track and that's it. A panel will open up at the bottom of the chart which will show you per product the change in pips, the standard deviation, the return etc.
Personally, I use it to track multiple products I have positions with without having multiple charts opened up, it save me bandwith and time to jump between screen. In the example, I have positions in EURUSD, USDJPY and NZDCHF, so, I just had to open the indicator once, add these currencies with the daily change as monitoring and that's it.
© 2019 Roy Meshulam

