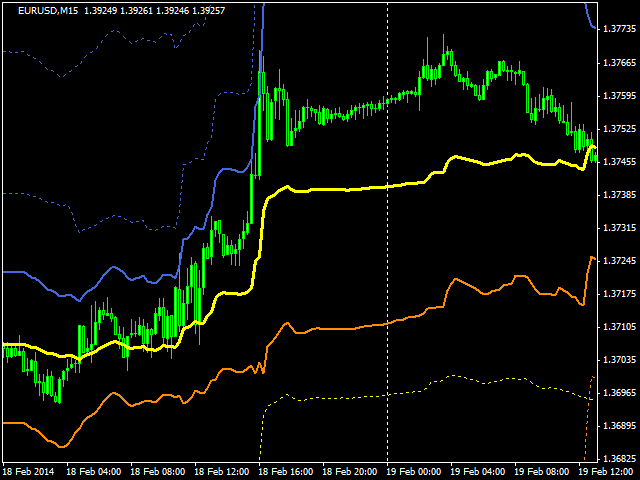
ExtraMovingPivots
- インディケータ
- Stanislav Korotky
- バージョン: 1.1
- アップデート済み: 24 11月 2021
- アクティベーション: 5
This is an intraday indicator that uses conventional formulae for daily and weekly levels of pivot, resistance and support, but updates them dynamically bar by bar. It answers the question how pivot levels would behave if every bar were considered as the last bar of a day.
At every point in time, it takes N latest bars into consideration, where N is either the number of bars in a day (round the clock, i.e. in 24h) or the number of bars in a week - for daily and weekly levels correspondingly. So, the "daily" and "weekly" calculations use sliding window of the appropriate number of bars, and levels are adjusted on every bar. 8 lines are shown on the chart: daily pivot, daily support 1 and 2, daily resistance 1 and 2, weekly pivot, weekly support 1 and weekly resistance 1.
The parameters:
- PD - number of bars to use for daily levels; by default - 0, meaning automatic detection using current timeframe, for example, 96 for M15 or 24 for H1; this allows for working with "virtual days" of special duration;
- PW - number of bars to use for weekly levels; by default - 0, meaning automatic detection using current timeframe;
- MA - period of moving average smoothing; by default - 0: no smoothing;
- Method - method of moving average smoothing; EMA - by default;
- Price - applied price for smoothing; typical price - by default;
When MA is 0, the indicator uses close prices of finished bars. When MA is non-zero, the corresponding value of moving average is used instead of the close price.
This indicator can be used for detection of intraday changes of pivot levels and visualization of additional bounds for price, which signal oversold and overbought states.


