• 概要
  • レビュー
  • コメント

Iroquois

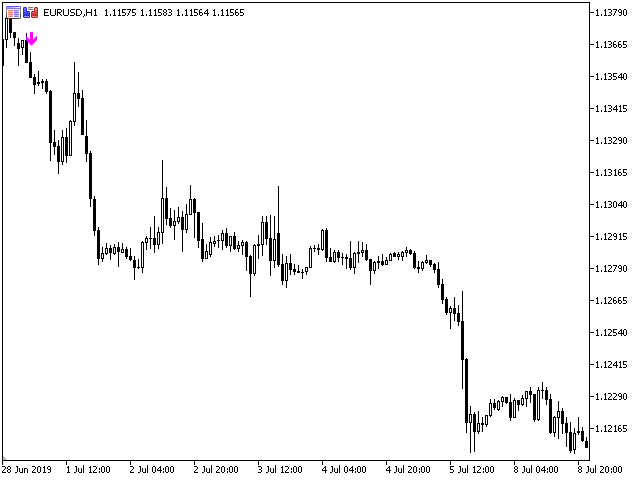
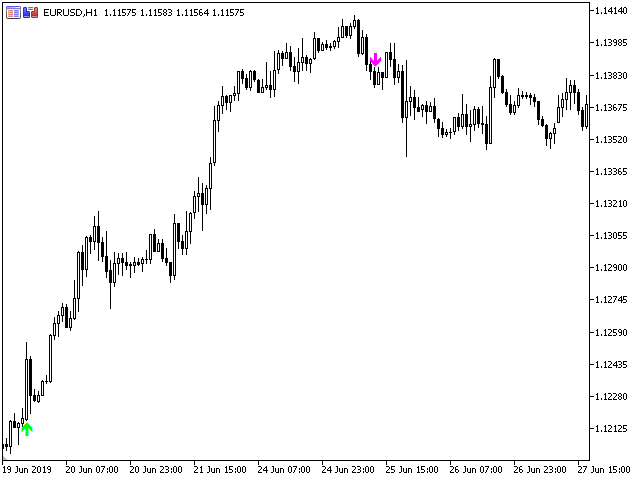
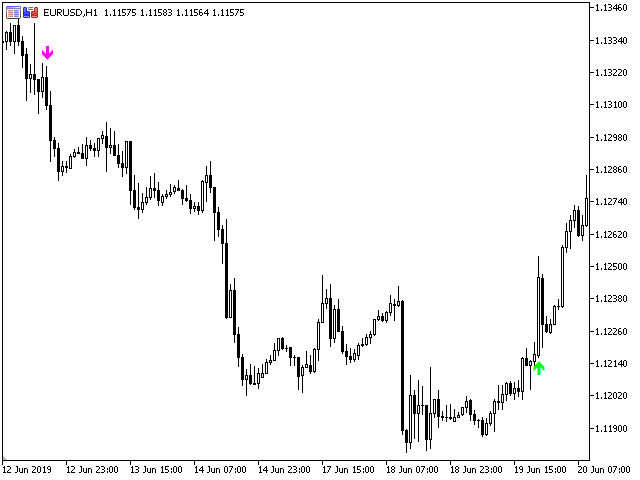
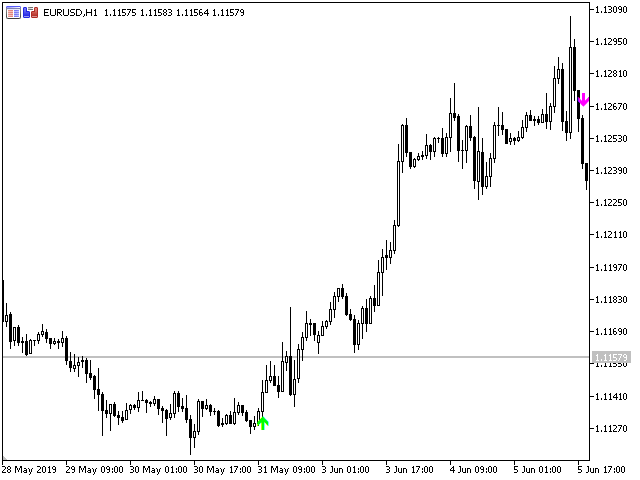
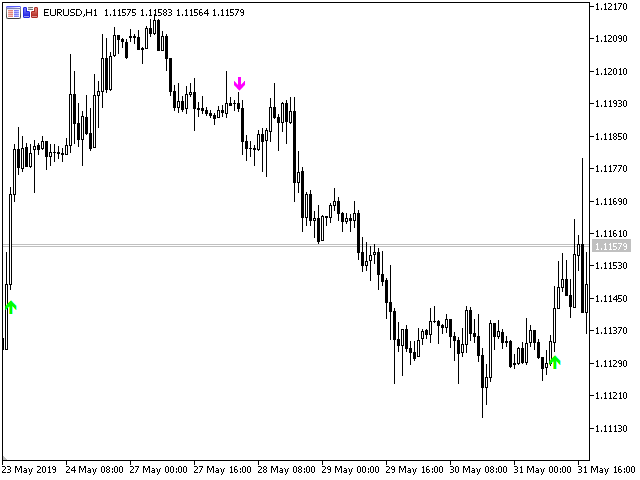
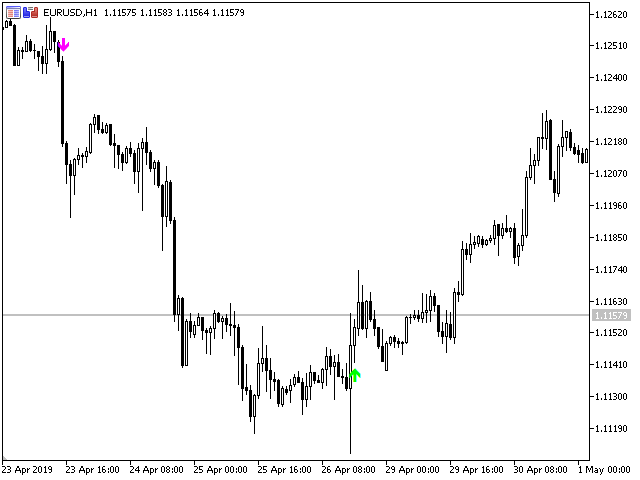
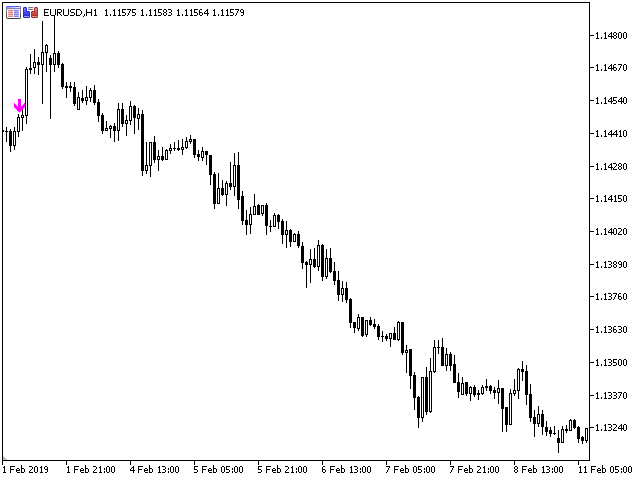
Using this indicator is very simple, since the simplest is to look at the chart and act according to the color arrows.

When calculating this indicator, the logarithmic gains are first calculated at the closing price, which allows you to filter out the trend, seasonality and other inclusions that spoil the volatility picture, then the standard square deviation is constructed from the data obtained.

Such a calculation option takes into account intraday price fluctuations and focuses on measuring the "candlestick" share in the trend.

The algorithm takes into account the measurement of prices, this method also emphasizes the measurement of each of the price differences (H / C, H / O, LC, LO) - which gives more detailed information but also more averaged.
おすすめのプロダクト
ベータ指数、またはベータインジケーターは、ヘッジ機関の参考指標の一つです。 これは、通貨や商品などの個別資産の相対的なリスクを市場ポートフォリオ、通貨クロス、米ドル指数、株価指数と比較して測定するのに役立ちます。資産が市場基準と比較してどのように動くかを理解することで、投資リスクについてより明確な理解を得ることができます。 主な特徴: 正確なリスク評価:ベータ指数は、資産のリスクを市場全体と比較して正確に評価し、情報を元に投資判断を行うのに役立ちます。 分散戦略:この指数を活用して、さまざまな資産カテゴリーを横断して投資ポートフォリオを最適化し、分散戦略の機会を探ることができます。 マルチ通貨ヘッジに適しています:マルチ通貨ヘッジに参加する投資家は、この指数を重要な参考指標として考慮できます。 リアルタイムの洞察:タイムリーな意思決定のためにリアルタイムのデータ分析を利用できます。 ベータ指数を取引ツールに組み込むことで、データとリスク分析の力を活用できます。より賢明な選択をして、ポートフォリオの無駄なリスクを軽減しましょう。 β = 1:βが1と等しい場合、資産の価格変動は市場全体と
RSIScalperProをご紹介します - MetaTrader 5用のRSIベースの画期的なインジケーターで、1分足チャートでのスキャルピングに最適です!RSIScalperProを使うことで、正確なエントリーとエグジットのシグナルを得られる強力なツールを手に入れることができます。 RSIScalperProは、オーバーボートとオーバーソールドのレベルに対する明確なシグナルを提供する2つの異なるRSI指標を使用しています。好みに合わせて2つのRSIの時間枠や制限値を調整することができ、トレーディング戦略に最適な結果を得ることができます。チャート上の個々の矢印は、トレードのエントリーとエグジットのタイミングを簡単に特定するのに役立ちます。 また、RSIScalperProの特徴の1つは、カスタマイズ可能な3つの移動平均線です。これにより、トレンドの方向を判断し、強力なトレードシグナルを確認するのに役立ちます。これにより、早い段階でトレンドを検出し、収益性の高い取引に参加することができます。 さらに、RSIScalperProを新しい取引シグナルが出た際に音で知らせるように設定するこ
Révolutionnez votre trading avec PowerPro Volatility : une précision automatisée à votre service Êtes-vous prêt à transformer votre approche du trading d’indices synthétiques ? Présentation de PowerPro Volatility, la solution ultime pour ceux qui cherchent à maximiser leurs gains tout en minimisant les efforts. Grâce à   Automatisation avancée et technologie de pointe, ce robot de trading est conçu pour offrir des performances exceptionnelles sans aucune intervention humaine. Découvrez les avan
Gold PL MTF - this is a fine stock technical indicator. The indicator algorithm analyzes the movement of the asset price and automatically reflects the important Pivot Levels of the specified timeframe (TF) using the Fibonacci method (golden section). The indicator perfectly describes the price trajectory of the selected timeframe (day, week, month, year), determines the beginning of a trend and the beginning of a correction, which may develop into an opposite trend. The indicator also shows t
The PriceActionOracle indicator greatly simplifies your trading decision-making process by providing accurate signals about market reversals. It is based on a built-in algorithm that not only recognizes possible reversals, but also confirms them at support and resistance levels. This indicator embodies the concept of market cyclicality in a form of technical analysis. PriceActionOracle tracks the market trend with a high degree of reliability, ignoring short-term fluctuations and noise around
This Indicator adding power to traditional zigzag indicator. With High-Low numbers in vision it will be easier to estimate change of trend by knowing the depth of each wave. Information including points, pips, percentage%, and #bars can be displayed based on configuration. All information is real-time update. This indicator is especially useful in sideway market to buy low sell high.
DYNAMIC SR TREND CHANNEL Dynamic SR Trend Channel is a simple indicator for trend detection as well as resistance/support levels on the current timeframe. It shows you areas where to expect possible change in trend direction and trend continuation. It works with any trading system (both price action and other trading system that use indicators) and is also very good for renko charting system as well. In an uptrend, the red line (main line) serves as the support and the blue line serves as the
ROC acceleration-deceleration is the manual system for medium-term scalping. Indicator based on custom ROC system which defines bullish/bearish market and especially  acceleration-deceleration of tendention in the market's main direction. Buy arrow is plotted during bearish market when current trend decelerates and sell  arrow is plotted during bullish market when current trend decelerates. Main Indicator's Features Signals are not repaint,non-late or disappear(exept cases when system recalculat
Best swing
Winsou Cedric Anicet Kpanou
-- BEST SWING  -- L'indicateur BEST SWING est un indicateur technique personnalisé, un excellent outil pour négocier les cassures en fonction des niveaux de support et de résistance horizontaux. L'indicateur BEST SWING utilise une formule complexe en analysant des données de prix autrement incongrues sur les cours de clôture de chaque période, ainsi que les hauts et les bas du prix, afin de donner un aperçu de la force ou de la faiblesse de la tendance du marché et de sa probabilité
FusionAlert StochRSI Master is an indicator available for MT4/MT5 platforms, it is a combination of RSI & Stochastic indicator which provide "alerts" when the market is inside "overbought and oversold" regions combined for both indicators, results in more precise and accurate signals to be used as a wonderful tool, in the form of "buy or sell" signals. This indicator comes with many customization options mentioned in the parameter section below, user can customise these parameters as needful. Jo
FREE
Didi Index
Flavio Javier Jarabeck
4.79 (24)
The famous brazilian trader and analyst Didi Aguiar created years ago a study with the crossing of 3 Simple Moving Averages called "Agulhada do Didi", then later was also named Didi Index, as a separate indicator. The period of those SMAs are 3, 8 and 20. As simple as that, this approach and vision bring an easy analysis of market momentum and trend reversal to those traders looking for objective (and visual) information on their charts. Of course, as always, no indicator alone could be used wit
FREE
Volume and RSI-based sniper entry signals for Boom and Crash synthetics feature robust entry alert systems. For more advanced filter signals, consider the Harmonic Hybrid Pro. When trading spikes, three orders are strategically placed to manage risk, with the third order positioned close to the highest probability of a spike. Signals are no longer valid fifteen minutes after the final order, and any losses should be closed promptly. For take profit (Tp), it is advisable to exit shortly after a s
FREE
トレンドに乗りましょう。はい、買いでも売りでも、15分枠でエントリーシグナルを待ち、30分枠でシグナルが現れたらシグナルを確認します(シグナルが現れるまでに1時間以上かかる場合もあります。戻ることができます) 15分足に戻り、30分足に戻り、メインシグナルが現れるまでこれを繰り返し、30分足にシグナルが出たら価格でエントリーし、描画ラインが変化した時点で利益確定となります。 、利益が確定したとき、または反対のシグナルが現れたとき これは非常にシンプルで、すべての主要通貨で機能します。  メタル、インジケーター、すべてのフレームですが、最も良い結果は 30 分フレームです。 ストップロスは常にローソク足の底値よりも下に設定し、資本管理を超えてはなりません 資本金の10%
Volume Trade Levels
Mahmoud Sabry Mohamed Youssef
The idea behind this indicator is very simple , First it contains 2 mechanisms to place your trades: 1- Enter the Pips you want to duplicate to price levels. 2- Automatically let the indicator specify the largest Buy / Sell Volume Candle and place duplicated levels based on the candle itself. How it works: 1- Enter the Pips you want to duplicate to price levels:    1- once the indicator is loaded you will need first to Specify the number of pips in the indicator Configuration window ,you can
XFlow shows an expanding price channel that helps determine the trend and the moments of its reversal. It is also used when accompanying transactions to set take profit/stop loss and averages. It has practically no parameters and is very easy to use - just specify an important moment in the history for you and the indicator will calculate the price channel. DISPLAYED LINES ROTATE - a thick solid line. The center of the general price rotation. The price makes wide cyclical movements around the
As   well   as   SuperTrend, SuperTrend Alerts offers alerts . You   can   also   get   alerts   with   SuperTrend   Alerts . Besides   SuperTrend, SuperTrend Alerts   also   offers alerts . SuperTrend   Alerts offers alerts   along   with SuperTrend . In addition to SuperTrend, SuperTrend Alerts   has   alerts . Also , SuperTrend Alerts offers alerts . The   SuperTrend   Alerts   add-on   works   with   SuperTrend   as well. As   well   as   SuperTrend, SuperTrend Alerts   has   alerts   too .
ShortBS是一个很好的短线交易指示器,能很好与 BestPointOfInitiation ( https://www.mql5.com/zh/market/product/96671 )配合,能让你找到最合适的buy和sell位置,指标不含有未来函数,不会重新绘制。是一个针对(如果你感觉到这个指标能够帮助你进行更准确的交易,请帮忙给个好评,希望我的作品能够帮助更多有需要的人) ===================参数列表===================== maPeriod: 25 slowPeriod:20 fastPeriod:10 stepPeriod:5 =================参考使用方法=================== 此指标可以适用于任何交易品种,能够用在任何周期。
Hello, dear MQL community, Let me share my Forex philosophy and introduce you to the Einstein Expert Advisor*. This advisor is crafted for those seeking consistent income in the Forex market while minimizing the constant fear of capital loss. In Forex, just like in life, philosophy plays a pivotal role. If the constant uncertainty and fear of loss trouble you, this philosophy can provide a fresh perspective on your trading approach. The Einstein Expert Advisor presents a unique method to help y
Boom and Crash Pro Indicator The Savia Forex Solutions Boom and Crash Pro Indicator gives you highly accurate entries on all Boom and Crash Indices. The Boom and Crash Pro Indicator is dynamic and powerful and is optimized for all timeframes. Trade with improved confidence and maximize your success rate. Benefits Dynamic and Powerful. Boom and Crash Pro Indicator is fully optimized for all chart timeframes. Whether price action is an uptrend, downtrend or trading sideways, Boom and Crash Pro Ind
--- StudentK CCI --- 1. Advanced strategy based on CCI 2. EA adapted (especially for StudentK's EA) --- Context --- StudentK is not indicated as a master or K Sir for knowledgeable person who claims for winning all the time. (But lots of traders should know the fact that it is rarely truth, especially in fluctuated period of time) StudentK is a group of years-experienced traders who want to share amazing tools in Free and Paid versions. Aiming helping people getting out of "The Rat Race" by
This indicator obeys the popular maxim that: "THE TREND IS YOUR FRIEND" Channel indicators incorporate volatility to capture price action. The Bollinger Bands is widely used, however, there are other options to capture swing action opportunities. Each study you will find here is unique, and reveals different types of price action. https://www.mql5.com/en/market/product/116256 https://www.mql5.com/en/market/product/115553
SUPERTREND; It is a trend following indicator based on the SuperTrend ATR created by Olivier Seban. It can be used to detect changes in trend direction and locate stops. When the price falls below the indicator curve, it turns red and indicates a downtrend. Conversely, when the price moves above the curve, the indicator turns green, indicating an uptrend. Like other indicators, it works well on SuperTrend when used in conjunction with other indicators such as MACD, parabolik SAR, Bollinger Band
FREE
The GGP Chandelier Exit Alert MT5 Indicator is a volatility-based indicator that identifies stop loss exit points for long and short trading positions. Chandelier Exit is based on the Average True Range (ATR) indicator. It is designed to keep traders in the trend until a defined trend reversal happens. Traders use CE to maximize their returns in a trade and make stop loss exit decisions. It is based on the principle that a trend reversal is highly probable when the price of an asset moves agains
Trend change detector is an indicator for Metatrader 5.It can help you determine the change in a local trend to open a correct position. It has 2 parameters. Period and mistake offset percent. You can change the period parameter to capture little changes in trend.  There are two lines: the red one and the green one. You can use them as a local support and resistance level. Arrows show the change in a trend. Up arrow the price will go down and Down arrow the price will go up. Also, by changing m
The indicator helps to enter a trade following the trend, at the same time, after some correction. It finds strong trending movements of a currency pair on a given number of bars, and also finds correction levels to this trend. If the trend is strong enough, and the correction becomes equal to the one specified in the parameters, then the indicator signals this. You can set different correction values, 38, 50 and 62 (Fibonacci levels) are better. In addition, you can set the minimum trend lengt
ToolBox 360 is the swiss knife of all indicators. It is full packed with useful tools to help you with your trading. It can be used to find best entry and exit points and help you to decide if you should open a trade or not. It shows market trends, candlestick formations outside / inside bars and you can sett time based allerts. Main features: Time based Fibonacci lines Choose a start and end time and the indicator shows you Fibonacci lines within the selected time range including range high
PROMOTIONAL PERIOD - ONLY 2 COPIES LEFT OF FIRST 10 BUYERS AT PRICE 300,00$!!! CHECK SCREENSHOTS AND COMMENTS FOR OUR STRATEGY RULES AND LIVE TRADES SIGNALS PULL IT BACK  is a revolutionary trading system and a complete strategy with advanced algorithm developed to detect the trend direction after a  PULLBACK , a  RETREACEMENT  or a  KEY LEVEL BOUNCE . The goal of this indicator is to get as many pips as possible from market trend. Following strictly the rules of the strategy, you can become a
Novato
Juan Manuel Rojas Perez
5 (1)
Descubre el poderoso aliado que te guiará en el laberinto de los mercados financieros. Este indicador revolucionario te llevará de la incertidumbre a la claridad, permitiéndote identificar con precisión los puntos de inflexión del mercado. Mejora tus decisiones de entrada y salida, optimiza tus operaciones y ¡multiplica tus ganancias con confianza. ¡Para más información, te invitamos a unirte a nuestro canal de Telegram en https://t.me/Profit_Evolution  ¡Allí encontrarás contenido exclusivo, a
FREE
Novato alertas
Juan Manuel Rojas Perez
5 (3)
Descubre el poderoso aliado que te guiará en el laberinto de los mercados financieros. Este indicador revolucionario te llevará de la incertidumbre a la claridad, permitiéndote identificar con precisión los puntos de inflexión del mercado. Mejora tus decisiones de entrada y salida, optimiza tus operaciones y ¡multiplica tus ganancias con confianza. Ahora con alertas en tu pc o móvil ¡Para más información, te invitamos a unirte a nuestro canal de Telegram en   https://t.me/Profit_Evolution  ¡
FREE
The Returns Momentum Oscillator (RMO) shows the difference of exponentially weighted volatility. It is used to find market tops and bottoms. Volatility comes in waves, and as the Returns often front run price action it gives directional prediction of market movement.   The Oscillator signal is RMSed (root mean squared) to make the distribution closer to Gaussian distribution. While the traditional RSI indicators are often stuck in overbought or oversold areas for a long time, RMSing of the sign
このプロダクトを購入した人は以下も購入しています
まず第一に、この取引インジケーターは再描画されず、再描画されず、遅延しないことを強調する価値があります。これにより、手動取引とロボット取引の両方に理想的なものになります。 ユーザーマニュアル:設定、入力、戦略。 アトミックアナリストは、価格の強さとモメンタムを利用して市場でより良いエッジを見つけるためのPA価格アクションインジケーターです。ノイズや誤ったシグナルを除去し、取引ポテンシャルを高めるための高度なフィルターを備えています。複雑なインジケーターの複数のレイヤーを使用して、アトミックアナリストはチャートをスキャンし、複雑な数学的計算をシンプルなシグナルと色に変換します。これにより、どのような初心者トレーダーでも理解して使用し、一貫した取引の決定を行うことができます。 「アトミックアナリスト」は、新規および経験豊富なトレーダー向けにカスタマイズされた包括的な取引ソリューションです。プレミアムインジケーターとトップノッチの機能を1つの取引戦略に組み合わせ、すべてのタイプのトレーダーにとって汎用性のある選択肢にします。 デイリートレーディングとスキャルピング戦略:高速で正確な
まず第一に、このトレーディングシステムがノンリペイント、ノンリドロー、ノンラグのインジケーターであることを強調する価値がある。これにより、手動取引とロボット取引の両方に理想的なものになっています。 オンラインコース、マニュアル、プリセットのダウンロード。 「スマートトレンドトレーディングシステム MT5」は、新規および経験豊富なトレーダー向けにカスタマイズされた包括的なトレーディングソリューションです。10以上のプレミアムインジケーターを組み合わせ、7つ以上の堅実なトレーディング戦略を備えており、多様な市場状況に対応する多目的な選択肢となっています。 トレンドフォロー戦略:トレンドを効果的に乗り越えるための正確なエントリーとストップロス管理を提供します。 リバーサル戦略:潜在的なトレンドの反転を特定し、トレーダーがレンジ相場を活用できるようにします。 スキャルピング戦略:高速で正確なデイトレードおよび短期取引のために設計されています。 安定性:すべてのインジケーターはノンリペイント、ノンリドロー、ノンラグであり、信頼性の高いシグナルを保証します。 カスタマイズ:個々の取引の嗜好に合わせ
Gold Stuff mt5
Vasiliy Strukov
4.9 (183)
Gold Stuff mt5 は、金専用に設計されたトレンド指標であり、あらゆる金融商品にも使用できます。 インジケーターは再描画せず、遅れません。 推奨時間枠 H1. 設定と個人的なボーナスを得るために、購入後すぐに私に連絡してください!  トレンド スキャナーの強力なサポートを利用して、無料のインジケーターを入手し、プライバシーを守ります。あーみー!   設定 矢印を描く - オンオフ。 チャートに矢印を描く。 アラート - 可聴アラートのオンオフ。 メール通知 - オンオフ。 電子メール通知。 プチ通知 - オンオフ。 プッシュ通知。 次に、色域を調整します。 Gold Stuff mt5 は、金専用に設計されたトレンド指標であり、あらゆる金融商品にも使用できます。 インジケーターは再描画せず、遅れません。 推奨時間枠 H1. 設定と個人的なボーナスを得るために、購入後すぐに私に連絡してください!   設定 矢印を描く - オンオフ。 チャートに矢印を描く。 アラート - 可聴アラートのオンオフ。 メール通知 - オンオフ。 電子メール通知。 プチ通
Reversal First Impulse levels (RFI)      INSTRUCTIONS        RUS       -       ENG              R ecommended to use with an indicator   -   TPSpro  TREND PRO -  Version MT4                 A key element in trading is zones or levels from which decisions to buy or sell a trading instrument are made. Despite attempts by major players to conceal their presence in the market, they inevitably leave traces. Our task was to learn how to identify these traces and interpret them correctly. Main functi
TPSpro TREND PRO  - is a trend indicator that automatically analyzes the market and provides information about the trend and each of its changes, as well as giving signals for entering trades without redrawing! The indicator uses each candle, analyzing them separately. referring to different impulses - up or down impulse. Exact entry points into transactions for currencies, crypto, metals, stocks, indices!  Version MT4               DETAILED DESCRIPTION               R ecommended to use with an
Quantum Trend Sniper
Bogdan Ion Puscasu
4.92 (48)
ご紹介   クォンタム トレンド スナイパー インジケーターは 、トレンド反転を特定して取引する方法を変革する画期的な MQL5 インジケーターです。 13年以上の取引経験を持つ経験豊富なトレーダーのチームによって開発されました。     クォンタムトレンドスナイパーインジケーター   は、非常に高い精度でトレンドの反転を識別する革新的な方法で、あなたのトレーディングの旅を新たな高みに押し上げるように設計されています。 ***Quantum Trend Sniper Indicatorを購入すると、Quantum Breakout Indicatorを無料で入手できます!*** クォンタム ブレイクアウト インジケーターは、トレンドの反転を特定するとアラートを発し、矢印を示し、3 つのテイクプロフィットレベルを提案します。 初心者トレーダーにもプロのトレーダーにも適しています。 量子EAチャネル:       ここをクリック MT4のバージョン:       ここをクリック 推奨事項: 期間:すべての時間枠。最良の結果を得るには、M
mql5と Telegramの モーニング・ブリーフィングで、詳細とスクリーンショットを含む毎日のマーケット・アップデートをご覧 ください! FX Power MT5 NGは 、長年の人気を誇る通貨強度計FX Powerの次世代モデルです。 この次世代ストレングスメーターは何を提供するのでしょうか?初代FXパワーの魅力すべて プラス GOLD/XAUの強さ分析 より正確な計算結果 個別に設定可能な分析期間 カスタマイズ可能な計算上限値により、さらに優れたパフォーマンスを実現 もっと見たい人のための特別なマルチインスタンス設定 すべてのチャートでお好みの色を無限に設定可能 数え切れないほどの通知オプションにより、重要なことを見逃すことはありません。 Windows 11とmacOSのスタイルで角を丸くした新しいデザイン 魔法のように動くインジケーターパネル FXパワーの主な機能 すべての主要通貨の強さの完全な履歴 すべての時間枠における通貨の強さの履歴 すべてのブローカーとチャートで同一の計算結果 100%信頼できるリアルタイム計算 -> リペイントなし ドロップダウン・リストから
このダッシュボードは、選択されたシンボルの最新の利用可能なハーモニックパターンを表示するので、時間を節約し、より効率的に /   MT4バージョン 。 無料インジケーター:   Basic Harmonic Pattern インジケーター列 Symbol : 選択したシンボルが表示されます。 Trend :   強気または弱気 Pattern : パターンの種類(ガートレー、バタフライ、バット、カニ、サメ、サイファー、ABCD) Entry : エントリー価格 SL: ストップロス価格 TP1: 1回目の利食い価格 TP2: 2回目の利食い価格 TP3:   3回目の利食い価格 Current price :   現在値 Age (in bars):    最後に描画されたパターンの年齢 主な入力項目 Symbols:   "28 Major Currency Pairs "または "Selected Symbols "から選択。 Selected Symbols:   カンマで区切られた監視したいシンボル("EURUSD,GBPUSD,XAUUSD")。ブローカーが
これはMT5のインジケーターで、再描画なしで取引に参入するための正確なシグナルを提供します。 外国為替、暗号通貨、金属、株式、インデックスなど、あらゆる金融資産に適用できます。かなり正確な見積もりを提供し、取引を開始して終了するのに最適な時期を教えてくれます。1つのシグナルを処理しただけでインジケーターの元が取れた例の 動画 (6:22)をご覧ください。Entry PointsPro インジケーターの助けを借りたほとんどのトレーダーの最初の1週間の結果が改善しています。 Telegramグループ に登録してください。Entry Points Proインジケーターのメリットは次の通りです。 再描画のないエントリーシグナル 再描画されるインジケーターでは一度表示されたシグナルが削除されて大きな金銭的損失につながることがありますが、これと異なり、表示されて確認されたシグナルは消えることがありません。 エラーなしの取引開始 インジケーターアルゴリズムによって取引を開始する(資産を売買する)理想的な瞬間を見つけることができます。それを使用するすべてのトレーダーの成功率が向上します。
今、147ドル(いくつかの更新後に499ドルに増加します) - 無制限のアカウント(PCSまたはMac) RelicusRoad ユーザー マニュアル + トレーニング ビデオ + プライベート Discord グループへのアクセス + VIP ステータス 市場の新しい見方 RelicusRoad は、外国為替、先物、暗号通貨、株式、および指数の世界で最も強力な取引インジケーターであり、トレーダーに収益を維持するために必要なすべての情報とツールを提供します。初心者から上級者まで、すべてのトレーダーが成功するためのテクニカル分析と取引計画を提供します。これは、将来の市場を予測するのに十分な情報を提供する重要な取引指標です。意味をなさないチャート上のいくつかの異なる指標ではなく、完全な解決策を信じています.これは、信号、矢印 + 価格アクション情報を表示するオールインワンのインジケーターで、他に類を見ない非常に正確です。 強力な AI に基づいて、RelicusRoad は不足している情報とツールを提供して、あなたを教育し、トレーディングのプロ、成功したトレーダーにします。
ICT, SMC, SMART MONEY CONCEPTS, SMART MONEY, Smart Money Concept, Support and Resistance, Trend Analysis, Price Action, Market Structure, Order Blocks, BOS/CHoCH,   Breaker Blocks ,  Momentum Shift,   Supply&Demand Zone/Order Blocks , Strong Imbalance,   HH/LL/HL/LH,    Fair Value Gap, FVG,  Premium  &   Discount   Zones, Fibonacci Retracement, OTE, Buy Side Liquidity, Sell Side Liquidity, BSL/SSL Taken, Equal Highs & Lows, MTF Dashboard, Multiple Time Frame, BigBar, HTF OB, HTF Market Structure
Was: $299  Now: $99   Supply Demand uses previous price action to identify potential imbalances between buyers and sellers. The key is to identify the better odds zones, not just the untouched ones. Blahtech Supply Demand indicator delivers functionality previously unavailable on any trading platform. This 4-in-1 indicator not only highlights the higher probability zones using a multi-criteria strength engine, but also combines it with multi-timeframe trend analysis, previously confirmed swings
現在33%オフ 初心者にもエキスパートトレーダーにも最適なソリューション このインジケーターは独自の機能と新しい公式を多数内蔵しており、ユニークで高品質かつ手頃な取引ツールです。このアップデートでは、2つの時間枠ゾーンを表示できるようになります。より長いTFだけでなく、チャートTFとより長いTF(ネストゾーンを表示)の両方を表示できます。すべてのSupply Demandトレーダーの皆さんのお気に召すはずです。:) 重要情報の公開 Advanced Supply Demandの可能性を最大化するには、 https://www.mql5.com/ja/blogs/post/720245 にアクセスしてください。   エントリーまたはターゲットの正確なトリガーポイントを正確に特定できれば取引がどのように改善されるか想像してみてください。新しい基盤となるアルゴリズムに基づいて構築されているため、買い手と売り手の間の潜在的な不均衡をさらに簡単に特定できます。これは、最も強い需要と供給のゾーンと、過去のパフォーマンス(古いゾーンを表示)がグラフィカルに表現されるためです。これらの機能は、最適
Introduction to X3 Chart Pattern Scanner X3 Cherart Pattern Scanner is the non-repainting and non-lagging indicator detecting X3 chart patterns including Harmonic pattern, Elliott Wave pattern, X3 patterns, and Japanese Candlestick patterns. Historical patterns match with signal patterns. Hence, you can readily develop the solid trading strategy in your chart. More importantly, this superb pattern scanner can detect the optimal pattern of its kind. In addition, you can switch on and off individu
ご紹介     Quantum Breakout PRO は 、ブレイクアウト ゾーンの取引方法を変革する画期的な MQL5 インジケーターです。 13年以上の取引経験を持つ経験豊富なトレーダーのチームによって開発されました。     クォンタム ブレイクアウト プロ   は、革新的でダイナミックなブレイクアウト ゾーン戦略により、あなたのトレーディングの旅を新たな高みに押し上げるように設計されています。 クォンタム ブレイクアウト インジケーターは、5 つの利益ターゲット ゾーンを備えたブレイクアウト ゾーン上のシグナル矢印と、ブレイクアウト ボックスに基づいたストップロスの提案を提供します。 初心者トレーダーにもプロのトレーダーにも適しています。 量子EAチャネル:       ここをクリック 重要!購入後、インストールマニュアルを受け取るためにプライベートメッセージを送ってください。 推奨事項: 時間枠: M15 通貨ペア: GBPJPY、EURJPY、USDJPY、NZDUSD、XAUUSD アカウントの種類: ECN、Raw、またはス
The AT Forex Indicator MT5 is a sophisticated trading tool designed to provide traders with a comprehensive analysis of multiple currency pairs. This powerful indicator simplifies the complex nature of the forex market, making it accessible for both novice and experienced traders. AT Forex Indicator uses advanced algorithms to detect trends, patterns and is an essential tool for traders aiming to enhance their forex trading performance. With its robust features, ease of use, and reliable signal
Matrix Arrow Indicator MT5
Juvenille Emperor Limited
5 (14)
マトリックスアローインジケーターMT5は、すべてのシンボル/商品(外国為替、商品、暗号通貨、インデックス、株式)で使用できる100%再描画されていないマルチタイムフレームインジケーターに続くユニークな10in1トレンドです。マトリックスアローインジケーターMT5は、初期段階で現在のトレンドを判断し、最大10の標準インジケーターから情報とデータを収集します。 平均方向移動指数(ADX) 商品チャネルインデックス(CCI) クラシック平研アシキャンドル 移動平均 移動平均収束発散(MACD) 相対活力指数(RVI) 相対力指数(RSI) 放物線SAR ストキャスティクス ウィリアムズのパーセント範囲 すべてのインジケーターが有効な買いまたは売りシグナルを与えると、対応する矢印がチャートに印刷され、次のろうそく/バーの開始時に強い上昇トレンド/下降トレンドを示します。ユーザーは、使用するインジケーターを選択し、各インジケーターのパラメーターを個別に調整できます。マトリックスアローインジケーターMT5は選択されたインディケーターからのみ情報を収集し、それらのデータのみに基づいてアローを印
Gold TMAF MTF - これは最高の株式テクニカル指標です。指標のアルゴリズムは、資産の値動きを分析し、ボラティリティと潜在的なエントリーゾーンを反映しています。 最高の指標シグナル: - 売りの場合 = TMA2の赤い上限がTMA1の赤い上限の上にある場合 + 上記の赤いフラクタル指標 + 同じ方向に黄色のSRシグナル矢印。 - 買いの場合 = TMA2の青い下限線がTMA1の青い下限線より下にある場合 + 下からの青いフラクタル指標 + 同じ方向の水色のSRシグナル矢印。 このインディケータの利点 1. このインディケータは、高精度のシグナルを生成します。 2. 確定した矢印シグナルは再描画されませんが、フラクタルシグナルは半周期再描画されます。 3. どのブローカーのMetaTrader 5取引プラットフォームでも取引できます。 4. あらゆる資産(通貨、金属、暗号通貨、株式、指数など)を取引できます。 5. M30-H1タイムフレーム(中期取引)で取引するのがよい。 6. 各トレーダーがインディケータを自分用に簡単にカスタマイズできるよ
トレンドラインは、外国為替取引におけるテクニカル分析の最も重要なツールです。残念ながら、ほとんどのトレーダーはそれらを正しく描画していません。自動トレンドラインインジケーターは、市場のトレンドの動きを視覚化するのに役立つ本格的なトレーダー向けのプロフェッショナルツールです。 トレンドラインには、強気トレンドラインと弱気トレンドラインの2種類があります。 上昇トレンドでは、外国為替トレンドラインは価格変動の最低スイングポイントを介して描画されます。 少なくとも2つの「最低安値」を接続すると、トレンドラインが作成されます。 下降トレンドでは、トレンドラインは価格変動の最も高いスイングポイントを介して描画されます。 少なくとも2つの「最高値」を接続すると、トレンドラインが作成されます。 トレンドラインが壊れたとき? 弱気のろうそくが強気のトレンドラインの下で閉じ、ろうそくの高さがトレンドラインの上にあるとき、強気のトレンドラインは壊れます。 強気のろうそくが弱気のトレンドラインの上で閉じ、ろうそくの安値がトレンドラインの下にあるとき、弱気のトレ
Elliott Wave Trend was designed for the scientific wave counting. This tool focuses to get rid of the vagueness of the classic Elliott Wave Counting using the guideline from the template and pattern approach. In doing so, firstly Elliott Wave Trend offers the template for your wave counting. Secondly, it offers Wave Structural Score to assist to identify accurate wave formation. It offers both impulse wave Structural Score and corrective wave Structure Score. Structural Score is the rating to sh
Gartley Hunter Multi - An indicator for searching for harmonic patterns simultaneously on dozens of trading instruments and on all possible timeframes. Manual (Be sure to read before purchasing) | Version for MT4 Advantages 1. Patterns: Gartley, Butterfly, Shark, Crab. Bat, Alternate Bat, Deep Crab, Cypher 2. Simultaneous search for patterns on dozens of trading instruments and on all possible timeframes 3. Search for patterns of all possible sizes. From the smallest to the largest 4. A
Golden Spikes Detector Overview: The Golden Spikes Premium is a groundbreaking trading indicator meticulously crafted for the Boom and Crash indices on the Deriv market. Tailored to meet the needs of discerning traders, this powerful tool operates exclusively on the one-minute timeframe, providing timely and precise signals to maximize your trading potential. The Golden Spikes Detector stands out in its ability to deliver accurate signals, ensuring that you capitalize on market opportunities wit
FX Volume MT5
Daniel Stein
4.94 (17)
mql5と Telegramの モーニング・ブリーフィングで、詳細とスクリーンショットを含む毎日のマーケット・アップデートをご覧 ください! FX Volumeは、ブローカーの視点から市場のセンチメントをリアルに洞察する、最初で唯一の出来高インジケーターです。 ブローカーのような機関投資家が外国為替市場でどのようなポジションをとっているか、COTレポートよりもはるかに速く、素晴らしい洞察を提供します。 この情報をチャート上で直接見ることは、あなたの取引にとって真のゲームチェンジャーであり、画期的なソリューションです。 以下のようなユニークなマーケットデータ洞察から利益を得てください。 比率は 、通貨のロングポジションとショートポジションの比率をパーセントで表示します。 比率の変化は 、選択した期間内のロング比率とその変化率を表示します。 Volumes Totalは 、通貨の取引量(ロングとショート)の合計をロット単位で表示します。 Volumes Long :全通貨のロングポジションの取引量を表示します。 Volumes(ショート )は、全通貨のショートポジションの取引量を表示
IVISTscalp5
Vadym Zhukovskyi
5 (5)
iVISTscalp5インジケーターをご紹介します。このインジケーターは、トレーディングにおいて独自でありながら効果的です。時間データに基づくこのインジケーターは、多年にわたる経験と金融市場の深い分析の結果です。iVISTscalp5インジケーターは、手動トレーディングにとって優れたツールです。便利さ、簡単さ、可視化 - すべての複雑さが内部に隠されています。私たちは、iVISTscalp5インジケーターの設定と使用を最大限に簡素化しました。このインジケーターは、MT5ターミナルにあるすべての金融商品に適しています。 稼働時間は、4時から20時(UTC+3)です。 iVISTscalp5インジケーターメニュー(スクリーンショット1を参照): History - 引用を計算する週数 dT_min - 時間間隔の選択(分) TFline - 水平ボリュームの作成(時間枠) BARSline - 水平ボリュームの作成(バー数) TFtrend1 - デイリーチャンネルの作成(時間枠) BARStrend1 - デイリーチャンネルの作成(バー数) TFtrend2 - 週次チャンネルの作成(時
The indicator very accurately determines the levels of the possible end of the trend and profit fixing. The method of determining levels is based on the ideas of W.D.Gann, using an algorithm developed by his follower Kirill Borovsky. Extremely high reliability of reaching levels (according to K. Borovsky  - 80-90%) Indispensable for any trading strategy – every trader needs to determine the exit point from the market! Precisely determines targets on any timeframes and any instruments (forex, met
Was: $249  Now: $99   Market Profile defines a number of day types that can help the trader to determine market behaviour. A key feature is the Value Area, representing the range of price action where 70% of trading took place. Understanding the Value Area can give traders valuable insight into market direction and establish the higher odds trade. It is an excellent addition to any system you may be using. Inspired by Jim Dalton’s book “Mind Over Markets”, this indicator is designed to suit the
If you want to find good trading opportunities, then you must trade near the Trend Line. This allows you to have a tighter         stop loss   on your trades — which improves your       risk to reward . But that’s not all… Because if you combine Trend Line with Support and Resistance, that’s where you find the best trading opportunities. Now you might wonder: “So when do I enter a trade?” Well, you can use reversal     candlestick patterns   (like the   Hammer, Bullish Engulfing, etc.) as your e
Step into the realm of Forex trading with confidence and precision using XQ, a cutting-edge Forex indicator designed to elevate your trading game to unprecedented heights. Whether you're a seasoned trader or just stepping into the world of currency exchange, XQ Forex Indicator empowers you with the insights and signals needed to make informed trading decisions. The signal conditions are a combination of three indicators, and XQ Forex Indicator only display  medium and long-term trends . The ind
Order Block Hunter MT5
Noha Mohamed Fathy Younes Badr
5 (1)
Order block hunter indicator is the best indicator for  hunt the order blocks that area where there has been a large concentration of limit orders waiting to be executed Order blocks are identified on a chart by observing previous price action and looking for areas where the price experienced significant movement or sudden changes in direction .This indicator does that for you by using very complicated codes and helps you to take the best areas To buy and sell because it make marks at the best a
トレンドに逆らった取引はもうやめましょう! 正確でタイムリーな情報を重視する真剣なトレーダーのために綿密に設計された当社のインジケーターは、28の主要ペアを非常にシンプルな方法で俯瞰することができます。このツールは、人気、強気または弱気のトレンドの強さ、買い手と売り手の割合/ MT5 バージョンに基づいて通貨ペアをランク付けすることができます。 特徴 リアルタイムのトレンド強度: 各通貨ペアのトレンドの強さを正確に評価し、取引機会を特定するための確かなガイドを提供します。 買い手と売り手の分析: 各ペアの買い手と売り手の強さランキングにより、市場のダイナミクスを即座に把握し、重要な動きを予測することができます。 トレーダーの関心: 各通貨ペアのトレーダーの関心と活動に関するデータにアクセスし、新たなトレンドと潜在的な転換点をよりよく理解するのに役立ちます。 直感的でカスタマイズ可能なダッシュボード: 当社の使いやすいダッシュボードは、お客様の好みに合わせて表示をカスタマイズすることができ、一目で関連情報を得ることができます。 リアルタイム更新: リアルタイム更新により
作者のその他のプロダクト
This indicator determines the short-term and long-term trend. The analysis is based on the selected timeframe. Indicator shows the points of opening deals for sale or purchase, and also indicates the direction of the trend at: Short term Long term This indicator not only signals an immediate purchase or sale. It indicates short term and long term trend. The indicator allows you to examine in more detail the real and historical market trends!
The indicator calculates the saturation levels of the price chart. A signal to exit the resale area is a buy signal. A signal to exit the overbought area is a sell signal. Usually, you need to set relative values ​​for the overbought and oversold levels of Bottom and Top - for this indicator. Most often, a good trend is visible on the price chart visually. But an experienced trader must clearly understand the current balance of power in the market before entering. And the indicator will help
This indicator can track the steady price movement in a certain direction. In this case, the movement itself can be downward, upward or lateral, when the market movement does not have a pronounced focus. The indicator works on the basis of two moving average as well as an oscillator. Using the signal search algorithm, the indicator generates signals in the form of arrows. Benefits. Allows you to determine the current trend. You can quickly enough understand which particular trend is currently
Dolphin Bands indicator works equally well on any timeframes. For medium-duration trends, it is recommended to use the standard setting. To study long-term trends, it is recommended to use an indicator value greater than the standard. To analyze short-term trends, it is better to use a lower indicator value. Most often, an exponential method is used to calculate the indicator, but other varieties can also be used. Dolphin Bands is a collection of lines. The two center lines of the indicator a
Martingals indicator works on all currency pairs and on all timeframes. The arrows indicate the optimal entry points for future Martingale averaging, even with a zero exponent. The indicator shows a signal to close the series only if all previous signals can be closed in profit. After closing a series in profit, you need to immediately open an order in the direction of the signal. Thus, the close signal is at the same time the reverse opening point to the other side of the new order. The probabi
Levels Market is one of the simplest, but no less effective tools from this. Pivot points can be built from these levels, levels are constructed as statistical significance at a given point in time. Trading by levels is a classic in the work of a trader. You can use them as a ready-made trading strategy or as an additional filter in your trading system. In the settings you can specify the offset for building levels. Interpretation of levels: Lines 8/8 and 0/8 (Final Resistance). These lines a
Trend New Trend Indicator, shows the signals for entry. Displays both entry points and the trend itself. Shows statistically calculated moments for entering the market with arrows. When using the indicator, it is possible to optimally distribute the risk factor. Settings: Uses all one parameter for settings. Selecting a parameter, it is necessary to visually resemble it so that the appropriate graph has a projection of extremes. Options: Length - the number of bars for calculating the ind
Condors TMA  ( Triangular Moving Average ) is a channel indicator without redrawing, built on the basis of moving averages. The key difference between the Condor TMA indicator and other channel indicators (for example, from the same Bollinger indicator) is that Condor TMA takes into account not simple moving averages, but twice smoothed ones, which allows one to more clearly determine the market movement, and on the other hand makes the indicator less sensitive.
Cancer indicator is great for trend trading! An intelligent indicator algorithm with high probability shows the points of potential market reversal. If you are trading in a trend, then a trading strategy built on the basis of this indicator is perfect for you. The indicator filters out market noise, almost everything and all the necessary functions for working with a thread are built into one tool. It works on all currency pairs and on all timeframes, indicator setting - according to your desire
A very simple and convenient trend indicator based on price divergence. He showed himself well in scalping. Help in finding entry points for analysis. It can be used as a filter in trade. It has two parameters: Period and Level. The Level parameter helps to filter out excess signals. For example, for EURUSD, the Level parameter may be 0.0001. The indicator can work both for entry points and as a filter. The indicator reflects information in a visual form. We must not forget that the approach to
Calculated trend indicator, can be used with an optimal risk to profit ratio, shows successful signals. Uses two options for settings. Shows favorable moments for entering the market with arrows. The probability of a successful trend is not very bad! The indicator can be used both for pipsing on small periods, and for long-term trading. The indicator does not redraw and does not lag. It works on all currency pairs and on all timeframes.
XStrain
Vitalii Zakharuk
The XStrain expert system works on all types of accounts. It works both in 4 and 5-digit quotes. Spread and requotes are not critical, any broker is suitable. To optimize the expert system, one year is recommended for the period H1 or H4. Optimization can be carried out at opening prices, the results differ little from testing on real ticks, since the bot works at opening prices. It is enough to optimize once a month! To get better results, it is recommended to work on several different pairs
An expert of a new type Formulas has been created - it works using sharp tick movements. The uniqueness of the expert is that it can be launched on any hour period, any currency pair, and on the server of any broker. What makes the expert attractive enough to use for trading. It is recommended to work on liquid forex pairs with a low spread. The lower the commission and spread, the greater the profit. You can start using it with $ 100 and a lot of 0.01. A small initial deposit also contributes
The Trend Distinctive indicator smoothes price fluctuations during signal formation by averaging the data. This gives the trader the opportunity to visually determine what trend will be present at a particular time interval. This is an auxiliary tool for technical analysis, which helps to determine the exact direction of the trend: either an upward or downward movement of the price of a trading instrument. Although the indicator is a little late, it still generates the most reliable signals t
Red Bot
Vitalii Zakharuk
The mechanism of work of the Red Bot Expert Advisor is designed so that before opening a transaction, they undergo instant implicit filtering, which, if there are competent and practical settings, allows the buyer to level the number of unprofitable and unproductive transactions. The adviser has a large number of internal regulators, software installations and special codes that help to safely and efficiently trade. This is a fully automated Expert Advisor, built on the scalping strategy, wor
Introduced expert system   Stable Ex works with the EURUSD currency pair and only with it. This system implemented the principle of five orders - that is, a maximum of five orders can be placed in one direction, after which the total position of the series must be closed by stops, either real or virtual. The trading system is designed to work separately with a series of buy orders and separately with a series of sell orders. which makes the trading system versatile enough. The expert passes all
The presented expert system works with the GBPUSD currency pair and only with it. This system implemented the principle of seven orders - that is, a maximum of seven orders can be made in one direction, after which the total position of the series should be closed by stops, either real or virtual. The trading system is designed to work separately with a series of buy orders and separately with a series of sell orders. which makes the trading system versatile enough. The expert passes all types
Transition indicator can track a steady price movement in a certain direction. In this case, the movement itself can be downward, upward or sideways, when the market movement does not have a pronounced focus. The indicator works on the basis of two moving average as well as an oscillator. Using the signal search algorithm, the indicator generates signals in the form of arrows. Trading based on trend indicators is the simplest and often the most effective. If you correctly determine the beginn
Global Trend Indicator, shows the signals for entry. Displays both entry points and the trend itself. Shows statistically calculated moments for entering the market with arrows. When using the indicator, the risk factor can be optimally distributed. Settings: Uses all one parameter for settings. Choosing a parameter, it is necessary to visually resemble it so that the appropriate graph has a projection of extremes. Parameters: Length - the number of bars for calculating the indicator.
Trend DI is an auxiliary tool for technical analysis that helps determine the exact direction of a trend: either an upward or downward movement of the price of a trading instrument. Although the Trend DI indicator is a bit late, it still generates the most reliable signals that a trader can safely navigate. The Trend DI indicator smooths price fluctuations during signal formation by averaging data. This gives the trader the opportunity to visually determine which trend will be present in a pa
The Trend ZVD Trend Indicator is important for identifying trends in financial markets. However, this indicator works equally well during consolidation periods. The Trend ZVD trend indicator indicates the direction in which the asset of your choice can move. The Trend ZVD trend indicator copes with the main task of trading: to find the entry point to the market at the time the trend is created and the exit point at the time it is completed. A trend in trade is the steady movement of quotes in
An indicator from the zigzag family with levels. First of all, I will point out arguments in favor of the advisability of using a level indicator. They give the trader the following benefits: Alternative points of view - the level indicator helps to look at the levels from the side, compare them with several automatic systems, identify errors; Saving time - reducing the cost of effort for self-building lines; Exact mathematical calculation - quick calculation of levels, ratios of indicato
The Progress Scalp strategy is based on tick trading principles. At its core, this strategy is fenders, that is, the trader receives signals for opening positions during pullbacks from the main movement. A distinctive feature of this strategy is that transactions are concluded only during periods of strong tick movements in the forex market. The Progress Scalp strategy was developed for trading with different currency pairs. You need to choose a currency pair with the lowest spreads and virtual
Long
Vitalii Zakharuk
The Long expert system works with the EURUSD currency pair and only with it. The trading system is designed to work separately with a series of buy orders and separately with a series of sell orders. which makes the trading system versatile enough. The expert passes all types of testing throughout the history for the specified currency pair. Also, the expert system is tested with various delay values, it works in fully automatic mode! No settings are needed, use only the default settings. T
The indicator is simple and clear, making the work of the trader as easy as possible and giving clear signals to enter the market. This indicator has two settings for the period. Which makes it more flexible. And at the same time, many false signals do not appear. The larger the period, the smoother the indicator itself will be. It can be used both independently and together with other indicators of technical analysis (including with oscillators), as well as with another same indicator (wit
Индикатор отображает регнессионный канал с сопровождением каналов фактически создавая уровни поддержки и сопротивления. Уровни поддержки и сопротивления являются одним из важнейших элементов технического анализа. С этим утверждением согласится любой трейдер. Уровни в трейдинге используются непосредственно, открывая и закрывая ордера у границ диапазона, очерченного ими. Также уровни применяют баланс спроса и предложения в своих торговых стратегиях на различных временных интервалах. Визуально
An expert of a new type Anniversary - works using sharp tick movements, the algorithm that was created earlier is significantly improved. The uniqueness of the expert is that it can be launched on any hour period, any currency pair, and on the server of any broker. What makes the expert attractive enough to use for trading. It is recommended to work on liquid forex pairs with a low spread. The lower the commission and spread, the greater the profit. You can start using it with $ 100 and a lot o
The Trends Signal indicator displays the direction of the trend with arrows, works in a simple and clear way. It uses a combination of reliable and simple indicators to analyze prices. The signals of the Trends Signal indicator can be interpreted as follows: buy when the bars are colored blue, and sell when they are red. An effective indicator with a wide range of three parameters for trading. Parameters: Length - The number of bars to calculate. LevelUP, LevelDN - Levels for determining over
The Open Trend indicator calculates the saturation levels of the price chart. Most often, a good trend is visible on a price chart visually. But an experienced trader should clearly understand the current balance of power in the market before entering. A signal to exit the oversold area is a buy signal. A signal to exit the overbought area is a sell signal. Usually, you need to set the relative values ​​for the overbought and oversold levels Bottom and Top for this indicator. The Open Trend
Sharp
Vitalii Zakharuk
Sharp expert system works with a deposit of $ 100! The classic method of scalping. It is also worth noting that with the allowable level of the spread, the bot goes through any historical period on any currency pair. The key for the Sharp bot is the spread, it works with default settings, it is possible to work with a spread of up to 10. If the spread is more than 10, then you need to select other settings. Testing should be performed with a spread of up to 10 on all ticks. There is no point
フィルタ:
レビューなし
レビューに返信