Guppy GMMA Cross Arrows Indicator
- インディケータ
- Abir Pathak
- バージョン: 2.1
- アップデート済み: 27 12月 2024
This indicator is based on Guppy's GMMA Strategy. And shows arrows when GMMA lines cross up or down.
To have this indicator and get alerts for Multiple Timeframes and multiple Pairs you can check out the demo of this GMMA Trend Scanner indicator:
https://www.mql5.com/en/market/product/38747
About GMMA In Brief:
GMMA attempts to identify trends by combining two groups of moving averages with differing time periods:
The long-term EMAs (30, 35, 40, 45, 50, and 60) the behaviors of investors that have taken a long-term approach to a given market. The short-term EMAs represent traders (3, 5, 8, 10, 12, and 18) who are attempting to capture short-term profits.
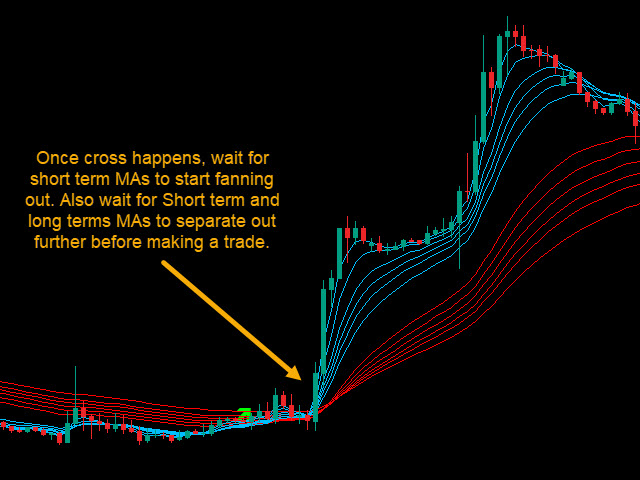
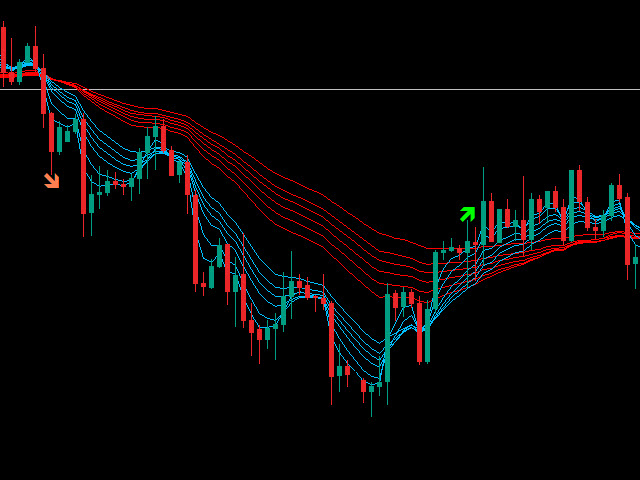
As you can see in the screenshots, blue lines are the short-term EMAs and red lines are long-term. So, buy when all of the blue lines cross above all of the red lines, and sell when the blue lines cross below the red lines. Right after a cross usually the red EMAs consolidate (get closer) and price has a slight reversal. Best time to buy is when the red EMAs start separating and price starts back again towards the trend using Count Back Line approach.
When all short term MAs cross all long term MAs from down to above, the up arrow is shown.
Same way when all short MAs cross below long MAs, then down arrow is shown.
It also shows all GMMA trend lines and all values are available in buffers.
About Settings:
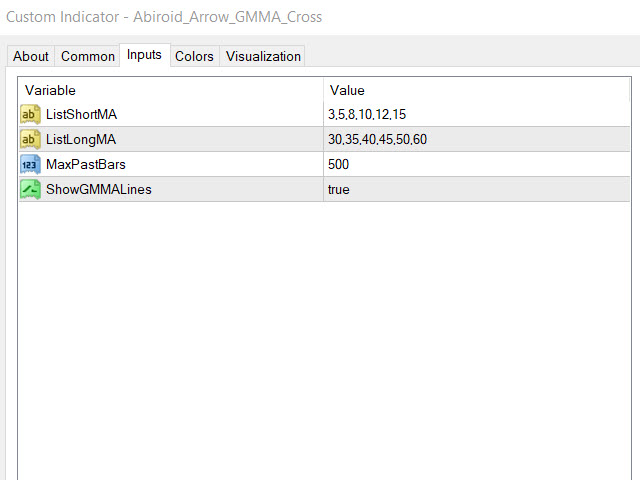
- ListShortMA = "3,5,8,10,12,15" A comma separated list of all short term MAs
- ListLongMA = "30,35,40,45,50,60" A comma separated list of all long term MAs
- MaxPastBars = 500 Maximum previous bars for which to calculate the Arrows
- ShowGMMALines = true Whether or not to show the GMMA Trend lines. If false then only arrows are shown
- ShowAlerts = true Show Alert when GMMA Cross occurs
How to Use:
Use this indicator in conjunction with Support/Resistance, Pivot points or other validation indicators.
Once a GMMA cross happens, be sure to check the overall trend and make sure that the market isn't ranging.
Because in flat market a lot of crosses happen. In trending market when GMMA crosses upwards it is a probable BUY signal.
And if it crosses downwards, it is a probable SELL signal. Once cross happens, wait for short term MAs to start fanning out.
Also wait for Short term and long terms MAs to separate out further before making a trade.
This is best used with higher timeframes. Not good for scalping or trading on very small timeframes.


Exactly what I wanted and it works just fine!