Mirror
- インディケータ
- Stanislav Korotky
- バージョン: 1.1
- アップデート済み: 17 11月 2021
- アクティベーション: 5
This indicator predicts rate changes based on the chart display principle. It uses the idea that the price fluctuations consist of "action" and "reaction" phases, and the "reaction" is comparable and similar to the "action", so mirroring can be used to predict it.
The indicator has three parameters:
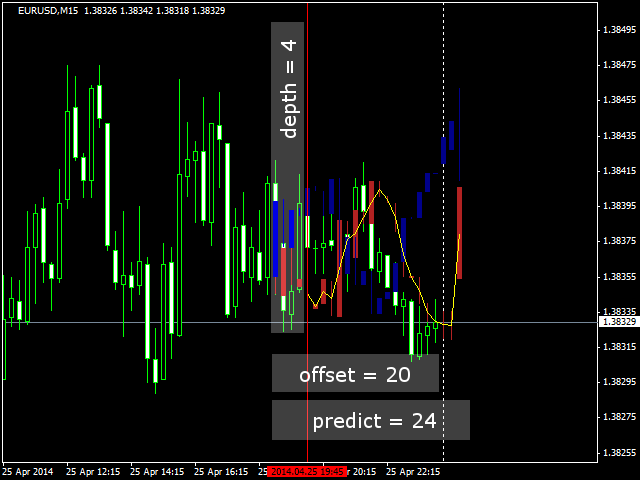
- predict - the number of bars for prediction (24 by default);
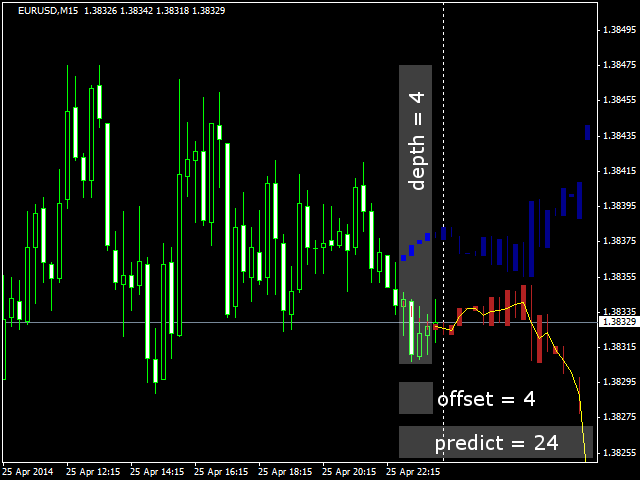
- depth - the number of past bars that will be used as mirror points; for all depth mirroring points an MA is calculated and drawn on the chart; also depth bars are used for selecting the appropriate mirroring method (see details below); default - 4;
- offset - the bar number on which prediction starts; default - 4.
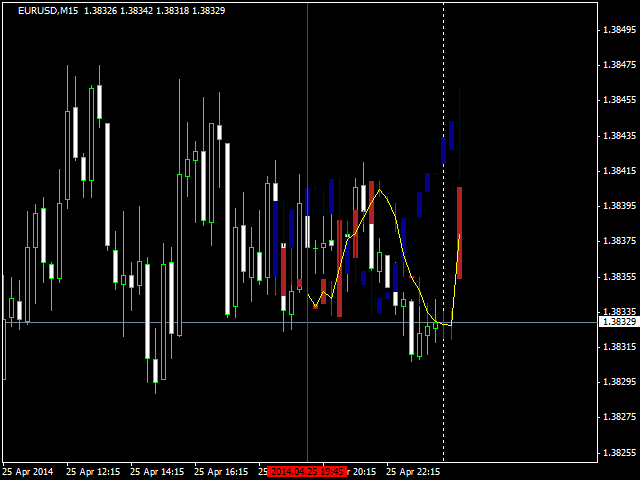
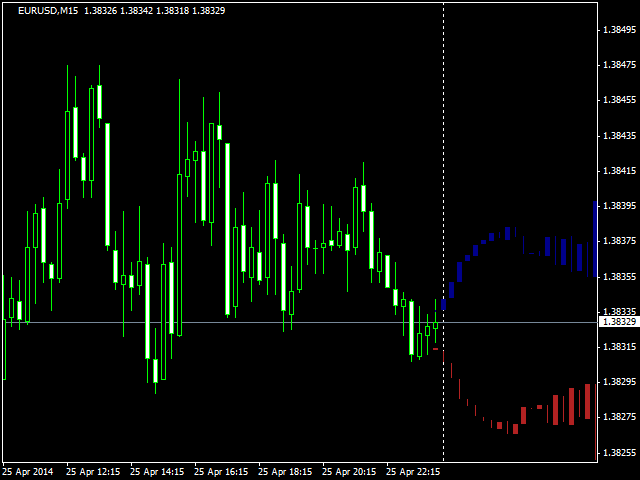
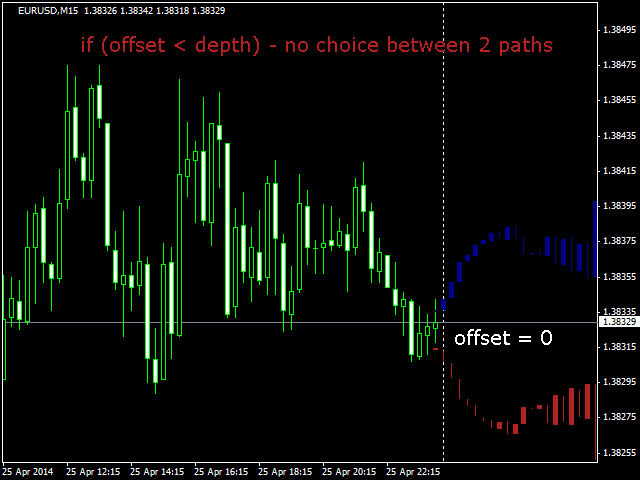
When offset is set to 0, the indicator draws a prediction by simply mirroring the last predict bars to the future. If you set depth 1, you will see that the prediction simply repeats the last history bars in the up and down directions. If you choose, for example, depth 4, the prediction is smoothed out and is more generalized since it is calculated as an average of mirroring on the 4 consecutive bars.
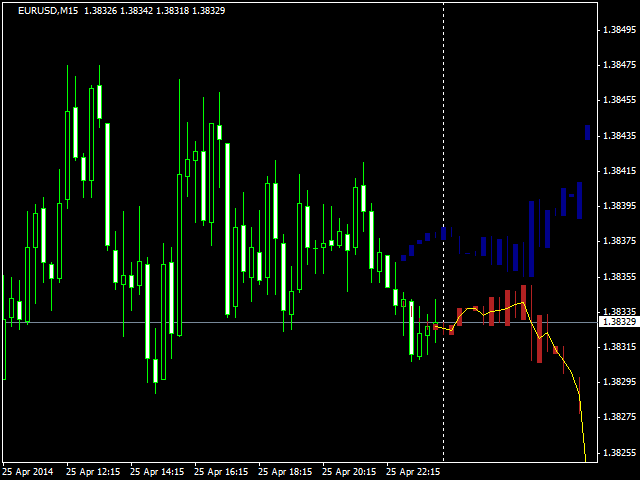
There are 2 modes of mirroring: full chart mirroring along both the time and prise axes, and mirroring only on the time axis. The first one is shown in red, the second - in blue. The indicator offers the best of these variants only if offset >= depth. It uses the first depth bars of each mode of mirroring to calculate the square error as compared to the real prices of the same bars. The mode with the smallest error is preferred and is highlighted as a yellow curve. When offset < depth, prediction option cannot be selected.
Thus, the default values of parameters mean that the indicator starts prediction from bar 4 (offset), uses the same 4 bars (depth) for evaluating each of the two methods, and will display the best option at 20 bars (24 predict - 4 depth), located entirely in the future.
You can shift offset further in the past (a value greater than depth) to check the performance of the indicator on the history.

