• 概要
  • レビュー (8)
  • コメント (43)
  • 最新情報

TDI Scanner Dashboard

5

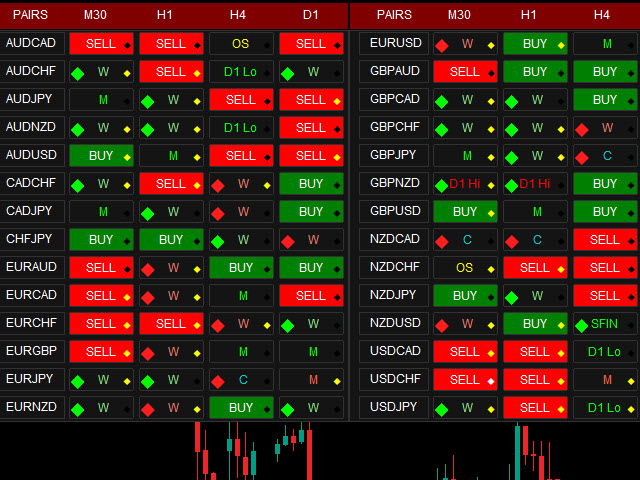
TDI Multi Timeframe Scanner:

This Dashboard indicator uses the TDI (Trader's Dynamic Index) Indicator to find best trades.

Read detailed How to Use Guide:

https://www.mql5.com/en/blogs/post/758252


Extra indicators also available in above post.


Checks for:

- SharkFin Pattern

Free indicator for SharkFin:

https://www.mql5.com/en/market/product/42405/

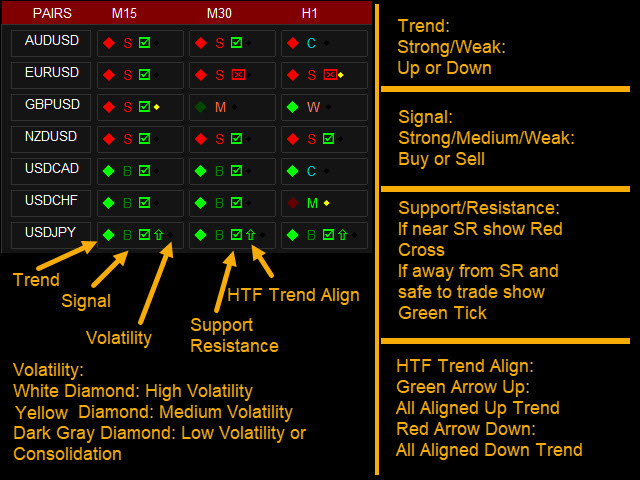
- TDI Trend: Strong/Weak Trend Up/Down

- TDI Signal: Strong/Medium/Weak Signal for Buy/Sell

- Consolidation

- Overbought/Oversold

- Volatility Bands

- Previous Day/Week/Month High/Low


What each button means (examples):
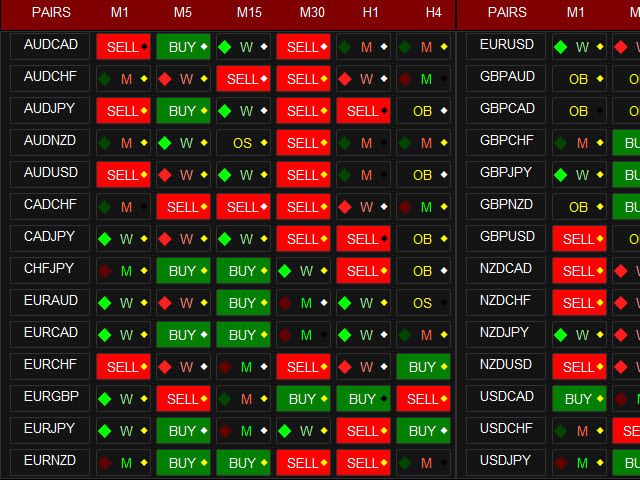
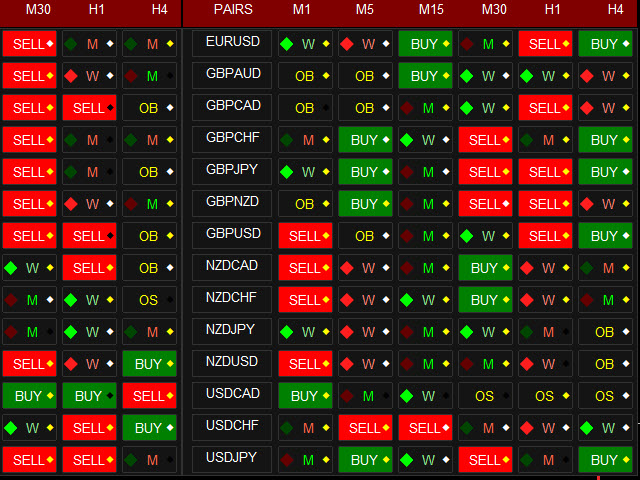
- If TDI Trend and TDI Signal both strong then a Green or Red BUY or SELL button


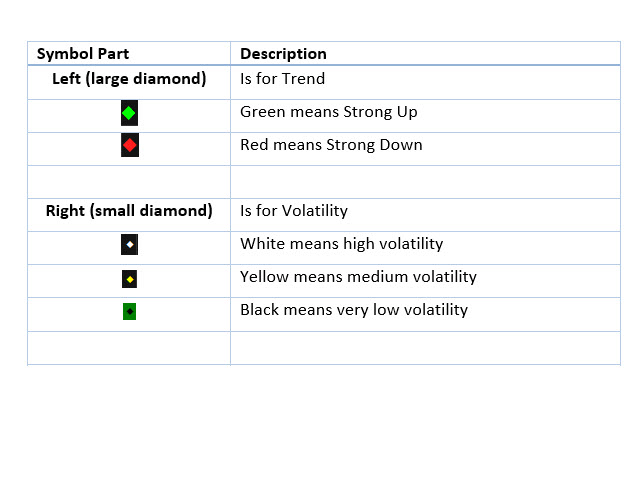
Left diamond is for trend:

- Green means Strong Up and Red means Strong Down

- Dark Green means Weak Up and Dark Red means Weak Down


Right (small diamond) Icon is for Volatility:

- White means high volatility

- Yellow means medium volatility

- Black means very low volatility


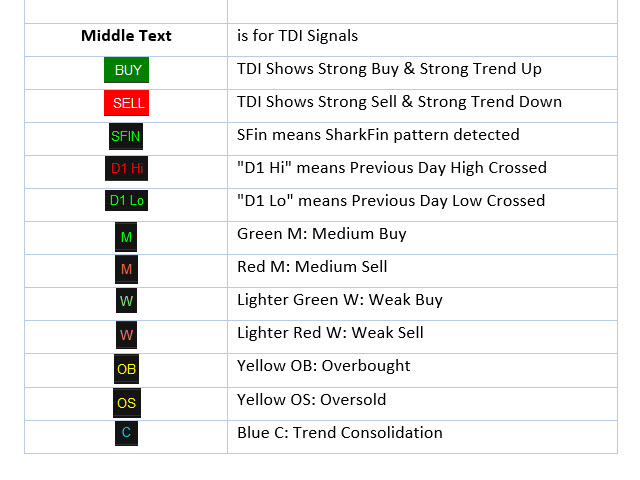
Middle Text is for TDI Signals:

- SFin means SharkFin pattern detected

- "D1 Hi" or "D1 Lo" means Previous Day High or Low Crossed

- Green B: Strong Buy, Red S: Strong Sell

- Green MB: Medium Buy and Red MS: Medium Sell

- Lighter Green WB: Weak Buy and Lighter Red WS: Weak Sell

- Yellow OB: Overbought and OS: Oversold

- Blue C: Trend Consolidation


Settings:

Detailed Common Dash Settings:

https://www.mql5.com/en/blogs/post/747456

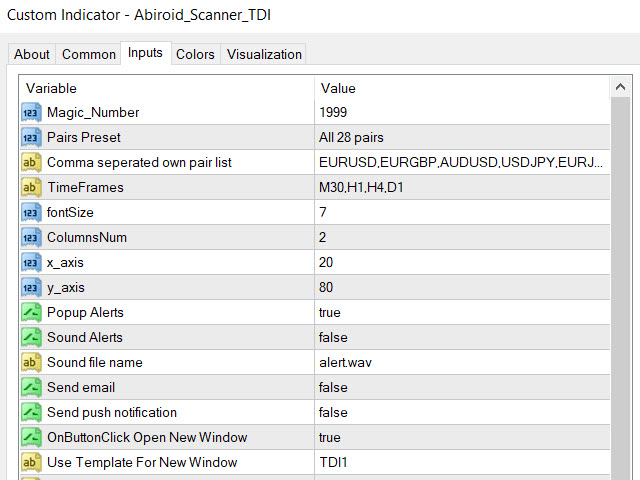
- Specify your Own Pairs (comma-separated list). Or select a pairs list from our drop-down for forex pairs like "Forex Core 7", "Forex Core 14", etc.

- Specify your own preferred time frames in a comma-separated list.

- Settings for showing alerts: Popup, email, sound alerts, etc.

- x_axis, y_axis: to position Scanner Dashboard

- fontSize: to resize the whole panel and it's fonts. For best experience use fontSize between 5 and 8.

- ColumnsNum: Number of Dashboard Columns

- OnButtonClick Open New Window: On clicking any dash buttons open that Pair-TimeFrame in a new window with your specified template (next setting)

- Use Template for New Window: Template name without ".tpl". Eg: Create a file Template1.tpl in templates folder and here specify: "Template1".

(only works if previous property set to true). Does not work if on button click is set to open in current window because otherwise you might lose your current window indicators or existing dashboard settings.

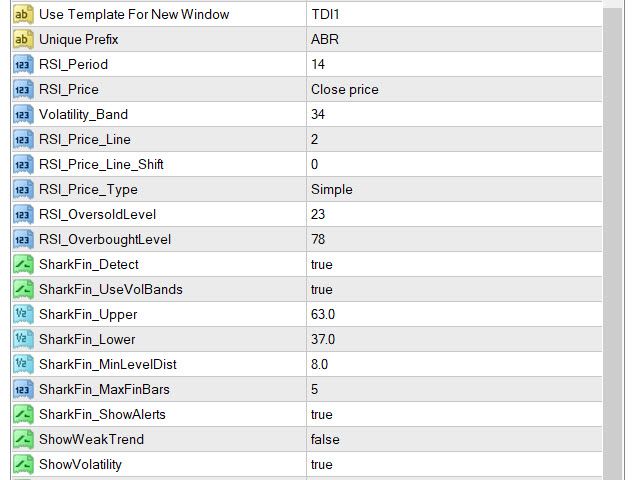
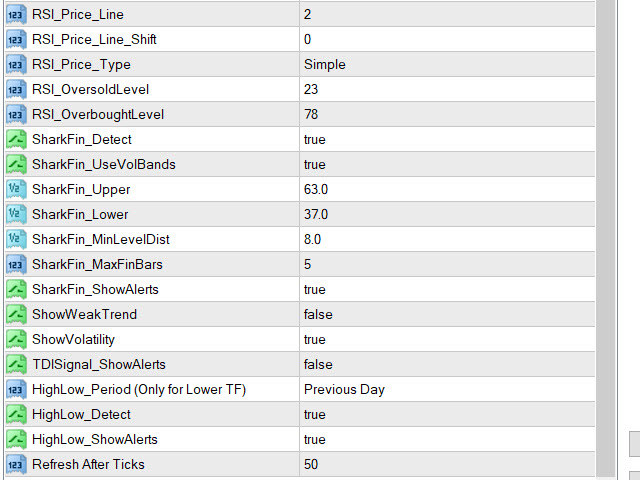
- ShowWeakTrend: true/false To Show left diamond if trend is weak or not

- ShowVolatility: true/false To Show right diamond for volatility or not

- Refresh After Ticks (if shift 0): For shift 0, wait for this number of ticks before refreshing everytime. By default 100. If you want this to refresh faster specify a lower number.

For higher TF use a higher number like 300 or 500.


SharkFin:

- Detect: true/false

- UseVolBands: Check Volatility Bands Cross along with SharkFin pattern

- Upper/Lower Levels: RSI Levels where price crosses and comes back to create a SharkFin

- MinLevelDist: Minimum distance from RSI Upper/Lower Level (for valid Sharkfin)

- MaxFinBars: Max no of bars within which pattern should be created


High/Low:

- Detect: true/false

- Period: Previous Day/Week/Month


How to Trade:

Best way to use this indicator is with Support and Resistance, Fibo or other such supporting Indicators. Or any other indicator which might validate that trend is still strong and not near an SR Zone.

Use volatility for further checking the signal. Don't trade when volatility diamond is black and trade carefully when Overbought or Oversold.

You can also use RSI and V-Bands patterns to trade. Like when an RSI "M" forms slightly outside the V-Bands, trade Sell if high volatility. Or if a "W" forms trade Buy.


Important Note:

- Please don't use too many Timeframes and too many Pairs because Scanner will need to scan each and every one and might get slower the more pairs you select.

- Best is to trade trending markets for higher timeframes. For lower timeframes, scalping sideways markets also works well with TDI.


レビュー 8
Sl80
553
Sl80 2021.11.01 11:25 
 

The scanner and TDI system is very useful and a good piece of work but a little heavy on the computer resources.

Yerly
610
Yerly 2021.10.05 08:35 
 

Un peu lourd, mais très efficace. Top.

Aravind Kolanupaka
8900
Aravind Kolanupaka 2021.03.13 23:53 
 

Good

おすすめのプロダクト
What Is Currency StrengtT Indicator? A currency strengthT indicator is a graphical tool that shows the strength of a currency. Common indicators usually show the strength of a currency in relation to another currency, however, with some calculations it is possible to find the absolute strength of each individual currency. Therefore, a currency strength matrix indicator (or meter) is a tool that tries to express the absolute strength of a currency, so that you can compare this strength with
The Trend Analysis Indicator is an innovative tool designed for traders and investors who seek to navigate the complexities of the financial markets with greater precision and insight. This powerful indicator is engineered to adeptly identify whether a market is trending or not, offering users a vital edge in their trading strategy. Key Features: Accurate Trend Detection : The core functionality of the Trend Analysis Indicator lies in its ability to accurately detect market trends. It analyzes p
Please contact me at telegram  https://t.me/smartforex7 After purchasing SmartForex Indicator then Use This Indicator...................... SMART EXIT PROFIT LINE Indicator is very Helpful with SmartForex Indicator ........................................ SMART EXIT PROFIT LINE Indicator Attach with SmartForex Indicator after then Red Line Show Exit buy Profit , Green Line show Exit Sell Profit................
FREE
MQLTrend
Mohammad Reza Aghaei
This tool helps you to control the situation at other times and include them in your trades when analyzing the market  This tool scans the market and reports the movement of the market at different times With the help of this tool, you can prevent many wrong analyzes With the help of this tool, you can have an overview of the market in the shortest time and save your time
FREE
The Trap Play MT4
Carl Gustav Johan Ekstrom
5 (3)
Trap Play  refers to a market situation where price initially makes a new high or low, luring traders into believing a strong trend is forming. However, the price quickly reverses and invalidates the breakout, trapping those traders who entered positions based on the initial move. This sudden reversal often results in a rapid exit of positions, leading to significant price movement in the opposite direction.  Trap plays  can occur in various financial markets and timeframes and are characterized
SSA stands for ' Singular Spectrum Analysis '. It combines elements of classical time series decomposition, statistics, multivariate geometry, dynamical systems and signal processing. SSA decomposes time series into a sum of components (ETs), with each component representing a lower smoothing, using several SVD ( Singular Value Decompositions ). It is a powerful filtering process used in many fields of research (climatology, biomedical, aerospace, etc), where high quality forecasting and smoo
SuperOsma Arrowは、買いシグナルと売りシグナルを与えるスーパートレンドOSMAベースのインジケーターです。インジケーターは再描画されず、シグナル統計を表示するダッシュボードが付属しています。 推奨期間:15 歳以上 Buy : バーが開いているときに購入矢印が表示され、tp と sl をチャートに描かれたとおりに設定します Sell : バーが開いているときに売り矢印が表示され、tp と sl をチャートに描かれたとおりに設定します ===============================     ダッシュボードには履歴信号情報が表示されます。     1.勝率%     2.勝者は何人ですか     3.敗者は何人ですか     4.連続当選者数     5.連敗者は何人か     6.pips単位の利益 ============================     パラメーター :     1.スーパートレンド1期     2.スーパートレンド1マルチプライヤー     3.スーパートレンド
The Donchian Scanner Signals Indicator with is a powerful tool designed for traders operating in the financial market using the Metatrader 4 platform. This indicator combines the popular Donchian Channels strategy with advanced signalization and real-time alert features, providing a clear view of potential entry and exit points in a financial asset. Key Features: Donchian Channels Visualization: The indicator graphically displays Donchian Channels on the price chart. These channels are formed us
Indicator for binary options arrow is easy to use and does not require configuration works on all currency pairs, cryptocurrencies buy signal blue up arrow sell signal red down arrow tips do not trade during news and 15-30 minutes before their release, as the market is too volatile and there is a lot of noise it is worth entering trades one or two candles from the current period (recommended for 1 candle) timeframe up to m 15 recommended money management fixed lot or fixed percentage of the depo
This indicator continuously changes the color of candlestick borders and bodies, as well as the color of volumes in real time. The indicator is easy to use. The palette of colors is diverse. This product is a graphical solution, so it is difficult to describe what it does by text, it is easier to see by downloading it, besides the product is free. The indicator is suitable for bloggers who want to create a beautiful picture of a chart for video editing or traders who want to make their chart al
FREE
Niubility Trend  Niubility Trend displays the trend direction for all time frames in real time. You'll see at a glance at which direction the trends are running, how long they last and how powerful they are. All this makes it an easy-to-use trend trading system for beginners, advanced and professional traders. Features Easy to trade Customizable colors and sizes It is non-repainting and non-backpainting It is fantastic as a trailing stop method It implements alerts of all kinds
Market Ticker
John Louis Fernando Diamante
The only Market Ticker on the market! Add a professional novelty to your workspace, with built in mini-charts A scrolling Market Ticker that displays price changes from all symbols in the Market Watch list. Provides an easy snapshot of symbol prices, and keeps scrolling automatically while you trade and analyse the chart. The ticker color (+/- price changes) are based on either the current or completed candle, and the previous candle. Options include: - MTF, eg choose to show price changes
The Burst MT4 Hurry and Buy Before Price Doubles Tomorrow! *Non-Repainting Indicator "The Burst" is an indicator that shows precise Buy and Sell Trades. A great arsenal to add to any chart. It's Best to Use The D1,H4 or H1 chart "The Burst" is designed to alert BUY and SELLS. So Of course, For the best take The Arrows In a Uptrend or Downtrend Only For Confirmation *Non-Repainting *For Desktop MT4 Only *Great For Scalping *Great For Intraday *Great For Swing Trading *Arrow Appears at  The "Clo
TDI Signals generates buy and sell arrows based on a TDI(Traders Dynamic Index) algorithm. It looks for price breakouts, continuations and reversals. By default it runs in the trend mode but user is provided with the option to change that to reversal mode. Trader can use the mode which compliments his/her trading style.  Usage:-   TDI Signals can be used as a stand alone indicator with context or even be added to strategies to make confirmations more strong. Volatility based stop loss, take pr
Hello Guys! I want to share with you a very useful tools. Anyone of us who has used MT4 for some time knows how impractical this platform can be for discretionary trading. That's why I created this graphical interface!  Interface is very simple, all the info that you need are in the video and in the screenshot. NB: Before to run the EA Interface, remember to copy the file in the comment in your MT4 folder "Controls". PATH: .../MQL4/INCLUDE/CONTROLS NB: unfortunately the interface can't be t
Forex 3D は、あらゆる通貨ペアでのスキャルピングに対応したトレーディング システムです。 推奨時間枠 M5. 毎日開くことができるトランザクションの平均数は 5 から 15 です。この取引システムは、金と銀を含むすべての通貨ペアでの取引に適しています。 Forex 3D は、外国為替初心者に適した非常にシンプルな取引システムです。 他の取引手段を使用した追加の市場分析は必要ありません。 このインディケータのテクニカル分析に専念し、そのシグナルのみでオーダーを開くことができます。 外国為替 3D 取引戦略: 買い注文を開くには、インジケーターを H1 時間枠に配置し、時間足チャートの価格が茶色の三角形の上にあることを確認する必要があります。 1 時間ごとの最後の手は緑色である必要があります。 M5 時間枠を開き、インジケーターがこの時間枠に緑色の矢印を描くのを待ちます。 インディケータがチャートに緑色の矢印を描くとすぐに、買い注文を開きます。 TakeProfit +25-35 pips を設定します (取引する通貨ペアによって異なります)。 茶色の三角形のレベルに設定され
Dark Breakout   is an Indicator for intraday trading. This Indicator is based on Trend Following  strategy, providing an entry signal on the breakout. The signal is provided by the arrow, which confirms the breaking of the level. We can enter in good price with this Indicator, in order to follow the main trend on the current instrument. It is advised to use low spread ECN brokers. This Indicator does Not repaint and N ot lag . Recommended timeframes are M5, M15 and H1. Recommended working pairs
この取引ツールを使用すると、15 の市場を同時にスキャンできます。 新しい取引指標 2024 のご紹介: ️ ダッシュボード マルチ通貨 マルチタイムフレーム 確率的。 私がこの取引ツールを作成した理由は少なくとも 2 つあります。 まず、1 つの市場だけを観察することに飽きました。 次に、別の市場への参入の瞬間を逃したくないです。 だからこそ、他の市況も同時に知りたいのです。 このため、複数の市場の状況を同時にスキャンできるスキャナーが必要です。 私は確率的メインライン > (または <=) 確率的シグナルラインが M1 から H4 (または単に M1 から M30) で始まる市場をよく探します。 私の分析に同意するなら、これがあなたが探していた取引指標です。 市況が上記の要件を満たす瞬間を見逃さないでください。 これは、多くの優れた機能を備えたストキャスティックのスキャナーまたはダッシュボードです。 確率的メインラインのデータを表示可能 確率シグナルラインのデータを表示可能 確率的メインラインとシグナルラインの位置を表示可能(シグナル
The arrow indicator for Forex and Binary options is based on tick volumes. Unlike many volume indicators, the "Super volumes" indicator calculates bullish and bearish volumes and gives signals based on the predominance of any of them. If, say, there was an advantage of bullish volumes in this range at the moment, then the signal will be on Buy. Or if the predominance was bearish volumes, then, accordingly, the signal will be on Sell. In the indicator settings in the "volumes" variable, you ca
Introducing Daily Hedge - Your Advanced Custom Hedge System for Forex Trading Unleash the Power of Daily Hedge - Your Ultimate Trading Companion Experience the next level of trading sophistication with Daily Hedge, an advanced custom hedge system designed to revolutionize your Forex trading experience. With its cutting-edge features and intelligent algorithms, Daily Hedge empowers you to make informed decisions and seize profitable opportunities like never before. Unlocking Advanced Trading Str
macd との 3ma クロスに基づくバイナリー取引用のインジケーターで、バーが開いているときに買いシグナルと売りシグナルを与え、再ペイントやバックペイントは行いません。 このインジケーターはマーチンゲール取引用に作成されているため、高い勝率には焦点を当てておらず、連続して最も低い損失シグナル数に焦点を当てています。 戦略 : 最低入金額は 1000 単位で、1 単位で取引を開始します (取引サイズは資本 1000 ごとに 1 単位です) 現在のシグナルが失われた場合、次のシグナルでトレードサイズを2倍にします。連続で最大7つの損失シグナルを持つインジケーター設定のみを採用します。 過去 10000 キャンドル (x 個のキャンドル以上の履歴取引を表示するために設定で入力できる数値) -推奨タイマーフレーム:任意 -有効期限 : 運用された時間枠と同じ パラメーター : 1.高速馬期 2.ファストマタイプ 3.スローマ期 4..スローマタイプ 5.トレンドマ期間 6.トレンドマタイプ 7.バー数 (シグナルとバックテスト結果を表示するために使用する履歴
Global Trend Indicator, shows the signals for entry. Displays both entry points and the trend itself. Shows statistically calculated moments for entering the market with arrows. When using the indicator, the risk factor can be optimally distributed. Settings: Uses all one parameter for settings. Choosing a parameter, it is necessary to visually resemble it so that the appropriate graph has a projection of extremes. Parameters: Length - the number of bars for calculating the indicator.
The Icarus Reversals(TM) Indicator is a powerful tool to identify high-probability reversal points, across all instruments.  The Reversals Indicator provides traders and investors with a simple-to-use and highly dynamic insight into points of likely price-action reversals.  Generated by a unique proprietary code-set, the Reversals Indicator generates long and short trade signals, which can be customised for all inputs, allowing for the complete optimisation fitted to any trader or investor style
The new update makes this indicator a complete tool for studying, analyzing and operating probabilistic patterns. It includes: On-chart Multi-asset percentage monitor. Configurable martingales. Twenty-one pre-configured patterns , including Mhi patterns and C3. An advanced pattern editor to store up to 5 custom patterns. Backtest mode to test results with loss reports. Trend filter. Hit operational filter. Martingale Cycles option. Various types of strategies and alerts. Confluence between patte
This is a Manual Indicator to help Manual traders see the Trend Visually it allows you to fully control how the candle closes with many different options, and you can plot the path with many different options. This Indicator is best used in Timeframe: H1 or higher Close Candle Methods Close Open High Low Median Typical Weighted Close Median Body (Open+Close)/2 Average (High+Low+Open+Close)/4 Trend Biased Heiken Ashi Close Heiken Ashi Open Heiken Ashi High    Heiken Ashi Low Heiken Ashi Media
Just $30 for six months!!!. This will draw Order Blocks just by clicking on a candle with different colors for different timeframes. It will use the body or the wicks. It can also draw the mean threshold of the candle open/close or high/low. As a drawing tool, it is not active all the time after adding it to the chart. Activate by pressing 'b' twice on the keyboard within a second. If activated but then decided not to draw, deactivate by pressing 'b' once.  Box color depends if candle is ab
通貨強度メーターは、現在どの通貨が強いか、どの通貨が弱いかをすばやく視覚的にガイドします。 メーターは、すべての外国為替クロスペアの強度を測定し、それらに計算を適用して、個々の通貨の全体的な強度を決定します。 28ペアのトレンドに基づいて通貨の強さに基づいて計算します。 MQL5ブログにアクセスすると、インジケーターの無料バージョンをダウンロードできます。 Metatrader Testerの制限なしで、購入する前に試してみてください: ここをクリック 1.ドキュメント すべてのトレンド通貨強度のドキュメント(手順)と戦略の詳細は、MQL5ブログのこの投稿で入手できます: ここをクリックしてください。 2.お問い合わせ ご不明な点がある場合やサポートが必要な場合は、プライベートメッセージでご連絡ください。 3.作成者 SAYADI ACHREF、フィンテックソフトウェアエンジニア、Finansyaの創設者。
Fibonacci colores
Carlos Augusto Cedeno Rocha
Fibonacci por color en niveles para aplicar estrategia profesional inicialmente se coloca en el punto mas alto del dia y mas bajo con esto es para ubicar operaciones a una distancia exacta con lo cual se busca generar ganancias residuales internas en el mismo dia con esto las lineas fusias es para colocar las entrdas sell y las lineas verdes amarillas van los buy
Have you ever wondered why so many Forex traders get trapped in weak positions on the wrong side of the market? One of the easiest ways the market makers do this, is by using volatility. A currency pair moves suddenly, often on a news release or economic data. Traders jump in, expecting some quick and easy profits, but the move suddenly moves in the opposite direction. This happens in all timeframes, and in all currency pairs. The candle or bar closes, with a wide spread, but then reverses sharp
FOREXBOB AUTO CLOSER   is a very handsome tool for manual traders who doing :- Scalping  Correlation Hedging Those who use averaging methods etc. As this utility tool will help you by closing all your running trades when the universal floating P/L reaches a certain value that you will put in inputs. You may enable and disable the alert message on your mobile phone when auto closer close all the running deals on specified profit. You may add any message you want in notification.  This tool consid
FREE
このプロダクトを購入した人は以下も購入しています
An exclusive indicator that utilizes an innovative algorithm to swiftly and accurately determine the market trend. The indicator automatically calculates opening, closing, and profit levels, providing detailed trading statistics. With these features, you can choose the most appropriate trading instrument for the current market conditions. Additionally, you can easily integrate your own arrow indicators into Scalper Inside Pro to quickly evaluate their statistics and profitability. Scalper Inside
現在20%OFF! 初心者やエキスパートトレーダーのためのベストソリューション! このダッシュボードソフトウェアは、28の通貨ペアで動作しています。それは私達の主要な指標(高度な通貨の強さ28と高度な通貨インパルス)の2に基づいています。それは全体の外国為替市場の大きい概観を与えます。それは、すべての(9)時間枠で28の外国為替ペアのための高度な通貨の強さの値、通貨の動きの速度と信号を示しています。チャート上で1つのインディケータを使用して市場全体を観察し、トレンドやスキャルピングの機会をピンポイントで見つけることができたら、あなたのトレードがどのように改善されるか想像してみてください。 このインディケータには、強い通貨と弱い通貨の識別、潜在的な取引の識別と確認がより簡単になるような機能が搭載されています。このインディケータは、通貨の強さや弱さが増加しているか減少しているか、また、すべての時間枠でどのように機能しているかをグラフィカルに表示します。 新機能として、現在の市場環境の変化に適応するダイナミックなマーケットフィボナッチレベルが追加され、すでに当社のAdvan
Reversal First Impulse levels (RFI)    INSTRUCTIONS        RUS       -       ENG              R ecommended to use with an indicator   -   TPSpro  TREND PRO -  Version MT5 A key element in trading is zones or levels from which decisions to buy or sell a trading instrument are made. Despite attempts by major players to conceal their presence in the market, they inevitably leave traces. Our task was to learn how to identify these traces and interpret them correctly. Main functions: Displaying activ
The AT Forex Indicator MT4 is a sophisticated trading tool designed to provide traders with a comprehensive analysis of multiple currency pairs. This   powerful indicator   simplifies the complex nature of the forex market, making it accessible for both novice and experienced traders. AT Forex Indicator uses   advanced algorithms   to detect trends, patterns and is an essential tool for traders aiming to enhance their forex trading performance. With its robust features, ease of use, and reliabl
mql5と Telegramの モーニング・ブリーフィングで、詳細とスクリーンショットを含む毎日のマーケット・アップデートをご覧 ください! FX Power MT4 NGは 、長年の人気を誇る通貨強度計FX Powerの次世代モデルです。 この次世代ストレングスメーターは何を提供するのでしょうか?初代FXパワーの魅力すべて プラス GOLD/XAUの強さ分析 より正確な計算結果 個別に設定可能な分析期間 カスタマイズ可能な計算上限値により、さらに優れたパフォーマンスを実現 もっと見たい人のための特別なマルチインスタンス設定 すべてのチャートでお好みの色を無限に設定可能 数え切れないほどの通知オプションにより、重要なことを見逃すことはありません。 Windows 11とmacOSのスタイルで角を丸くした新しいデザイン 魔法のように動くインジケーターパネル FXパワーの主な機能 すべての主要通貨の強さの完全な履歴 すべての時間枠における通貨の強さの履歴 すべてのブローカーとチャートで同一の計算結果 100%信頼できるリアルタイム計算 -> リペイントなし ドロップダウン・リストから
TPSpro TRENDPRO  - is a trend indicator that automatically analyzes the market and provides information about the trend and each of its changes, as well as giving signals for entering trades without redrawing! The indicator uses each candle, analyzing them separately. referring to different impulses - up or down impulse. Exact entry points into transactions for currencies, crypto, metals, stocks, indices!  -  Version MT5               DETAILED DESCRIPTION                R ecommended to use with
Indicator : RealValueIndicator Description : RealValueIndicator is a powerful tool designed specifically for trading on the EURUSD pair. This indicator analyzes all EUR and USD pairs, calculates their real currency strength values, and displays them as a single realistic value to give you a head start on price. This indicator will tell you moves before they happen if you use it right. RealValueIndicator allows you to get a quick and accurate overview of the EURUSD currency pair tops and bottoms,
ご紹介   クォンタム トレンド スナイパー インジケーターは 、トレンド反転を特定して取引する方法を変革する画期的な MQL5 インジケーターです。 13年以上の取引経験を持つ経験豊富なトレーダーのチームによって開発されました。     クォンタムトレンドスナイパーインジケーター   は、非常に高い精度でトレンドの反転を識別する革新的な方法で、あなたのトレーディングの旅を新たな高みに押し上げるように設計されています。 ***Quantum Trend Sniper Indicatorを購入すると、Quantum Breakout Indicatorを無料で入手できます!*** クォンタム ブレイクアウト インジケーターは、トレンドの反転を特定するとアラートを発し、矢印を示し、3 つのテイクプロフィットレベルを提案します。 初心者トレーダーにもプロのトレーダーにも適しています。 量子EAチャネル:       ここをクリック MT5のバージョン:       ここをクリック 推奨事項: 期間: すべての時間枠。最良の結果を得るには、
TrendMaestro
Stefano Frisetti
5 (3)
note: this indicator is for METATRADER4, if you want the version for METATRADER5 this is the link:  https://www.mql5.com/it/market/product/108106 TRENDMAESTRO ver 2.4 TRENDMAESTRO recognizes a new TREND in the bud, he never makes mistakes. The certainty of identifying a new TREND is priceless. DESCRIPTION TRENDMAESTRO identifies a new TREND in the bud, this indicator examines the volatility, volumes and momentum to identify the moment in which there is an explosion of one or more of these data a
まず第一に、この取引インジケーターは再描画されず、再描画されず、遅延しないことを強調する価値があります。これにより、手動取引とロボット取引の両方に理想的なものになります。 ユーザーマニュアル:設定、入力、戦略。 アトミックアナリストは、価格の強さとモメンタムを利用して市場でより良いエッジを見つけるためのPA価格アクションインジケーターです。ノイズや誤ったシグナルを除去し、取引ポテンシャルを高めるための高度なフィルターを備えています。複雑なインジケーターの複数のレイヤーを使用して、アトミックアナリストはチャートをスキャンし、複雑な数学的計算をシンプルなシグナルと色に変換します。これにより、どのような初心者トレーダーでも理解して使用し、一貫した取引の決定を行うことができます。 「アトミックアナリスト」は、新規および経験豊富なトレーダー向けにカスタマイズされた包括的な取引ソリューションです。プレミアムインジケーターとトップノッチの機能を1つの取引戦略に組み合わせ、すべてのタイプのトレーダーにとって汎用性のある選択肢にします。 デイリートレーディングとスキャルピング戦略:高
現在26%オフ 初心者やエキスパートトレーダーに最適なソリューション! このインジケーターは、独自の機能と新しい計算式を取り入れた、ユニークで高品質、かつ手頃な価格のトレーディングツールです。たった1枚のチャートで28の為替ペアの通貨強度を読み取ることができます。新しいトレンドやスキャルピングチャンスの引き金となるポイントを正確に特定することができるので、あなたのトレードがどのように改善されるか想像してみてください。 ユーザーマニュアルはこちら  https://www.mql5.com/en/blogs/post/697384 これが最初の1本、オリジナルだ! 価値のないクローンを買わないでください。 特別な サブウィンドウの矢印で強い通貨の勢いを表示 GAPがあなたのトレードを導く! 基準通貨や気配値が売られすぎ・買われすぎのゾーン(外相フィボナッチレベル)にあるとき、個別チャートのメインウィンドウに警告表示。 通貨がレンジの外側から反落した場合、プルバック/リバーサルのアラート。 クロスパターンの特別なアラート 複数の時間枠を選択可能で、トレンドを素早く
Advanced Supply Demand
Bernhard Schweigert
4.92 (313)
現在33%オフ 初心者にもエキスパートトレーダーにも最適なソリューション このインジケーターは独自の機能と新しい公式を多数内蔵しており、ユニークで高品質かつ手頃な取引ツールです。このアップデートでは、2つの時間枠ゾーンを表示できるようになります。より長いTFだけでなく、チャートTFとより長いTF(ネストゾーンを表示)の両方を表示できます。すべてのSupply Demandトレーダーの皆さんのお気に召すはずです。:) 重要情報の公開 Advanced Supply Demandの可能性を最大化するには、 https://www.mql5.com/ja/blogs/post/720245 にアクセスしてください。   エントリーまたはターゲットの正確なトリガーポイントを正確に特定できれば取引がどのように改善されるか想像してみてください。新しい基盤となるアルゴリズムに基づいて構築されているため、買い手と売り手の間の潜在的な不均衡をさらに簡単に特定できます。これは、最も強い需要と供給のゾーンと、過去のパフォーマンス(古いゾーンを表示)がグラフィカルに表現されるためです。これらの機能は、最適
ご紹介     Quantum Breakout PRO は 、ブレイクアウト ゾーンの取引方法を変革する画期的な MQL5 インジケーターです。 13年以上の取引経験を持つ経験豊富なトレーダーのチームによって開発された Quantum Breakout PROは 、革新的でダイナミックなブレイクアウトゾーン戦略により、あなたの取引の旅を新たな高みに押し上げるように設計されています。 クォンタム ブレイクアウト インジケーターは、5 つの利益ターゲット ゾーンを備えたブレイクアウト ゾーン上のシグナル矢印と、ブレイクアウト ボックスに基づいたストップロスの提案を提供します。 初心者トレーダーにもプロのトレーダーにも適しています。 量子EAチャネル:       ここをクリック MT5バージョン:   ここをクリック 重要!購入後、インストールマニュアルを受け取るためにプライベートメッセージを送ってください。 推奨事項: 時間枠: M15 通貨ペア: GBPJPY、EURJPY、USDJPY、NZDUSD、XAUUSD アカウントの種類: ECN、Raw、また
NAM Order Blocks
NAM TECH GROUP, CORP.
5 (1)
MT4マルチタイムフレームオーダーブロック検出インジケーター。 特徴 -チャートコントロールパネルで完全にカスタマイズ可能で、完全な相互作用を提供します。 -必要な場所でコントロールパネルを表示および非表示にします。 -複数の時間枠でOBを検出します。 -表示するOBの数量を選択します。 -さまざまなOBユーザーインターフェイス。 -OBのさまざまなフィルター。 -OB近接アラート。 -ADRの高線と低線。 -通知サービス(画面アラート|プッシュ通知)。 概要 注文ブロックは、金融機関や銀行からの注文収集を示す市場行動です。著名な金融機関と中央銀行が外国為替市場を牽引しています。したがって、トレーダーは市場で何をしているのかを知る必要があります。市場が注文ブロックを構築するとき、それは投資決定のほとんどが行われる範囲のように動きます。 注文の構築が完了すると、市場は上向きと下向きの両方に向かって急激に動きます。注文ブロック取引戦略の重要な用語は、機関投資家が行っていることを含むことです。それらは主要な価格ドライバーであるため、機関投
FX Volume
Daniel Stein
4.61 (36)
mql5と Telegramの モーニング・ブリーフィングで、詳細とスクリーンショットを含む毎日のマーケット・アップデートをご覧 ください! FX Volumeは、ブローカーの視点から市場のセンチメントをリアルに洞察する、最初で唯一の出来高インジケーターです。 ブローカーのような機関投資家が外国為替市場でどのようなポジションをとっているか、COTレポートよりもはるかに速く、素晴らしい洞察を提供します。 この情報をチャート上で直接見ることは、あなたの取引にとって真のゲームチェンジャーであり、画期的なソリューションです。 以下のようなユニークなマーケットデータ洞察から利益を得てください。 比率は 、通貨のロングポジションとショートポジションの比率をパーセントで表示します。 比率の変化は 、選択した期間内のロング比率とその変化率を表示します。 Volumes Totalは 、通貨の取引量(ロングとショート)の合計をロット単位で表示します。 Volumes Long :全通貨のロングポジションの取引量を表示します。 Volumes(ショート )は、全通貨のショートポジションの取引量を表示
Enigmera
Ivan Stefanov
5 (4)
エニグメラ:市場の中核 https://www.enigmera.com はじめに このインディケータと取引システムは、金融市場に対する驚くべきアプローチです。ENIGMERAは、フラクタルサイクルを使用して、サポートとレジスタンスレベルを正確に計算します。本格的な蓄積局面を示し、方向性と目標を示します。 トレンド中でも調整中でも機能するシステムです。 どのように作動するのか? ENIGMERAは、支持線・抵抗線、目標線、乖離線の3つのラインで構成されています。このシステムは、過去のデータを現在と未来に外挿する典型的な市場指標とは異なり、現在の完全な画像を提供します。支持線上にある場合、それは本当の支持を意味し、抵抗線上にある場合、それは本当の抵抗を意味する。ある水準が破られた場合、それはトレンドの変化を意味する。再描画はしない。 市場は常に進化しているため、ENIGMERAはその評価ツールを適応させ、定期的に戦略を修正しています。  これにより、すべてのシナリオが徹底的に評価されることが保証されます。この市場指標の独自性は、その能力を見れば明らかです。  ENIGM
TrendDecoder Premium
Christophe Pa Trouillas
5 (6)
レンジと次の動きを特定    |  トレンドの最も早いシグナルと強さを得る   |  反転の前に明確な出口を得る   |  価格がテストするフィボ・レベルを見つける。 非リペイント、非遅延インディケータ - マニュアルおよび自動売買に最適 - すべての資産、すべての時間単位に対応 期間限定キャンペーン   >> 50%OFF 購入後、 推奨セッティングについては、このチャンネルで私に連絡してください。 MT5 バージョン: ここをクリック BladeSCALPER   と   PowerZONES   を使った完全な方法を入手する どのようなものですか? TrendDECODERは、トレンド監視をシンプルかつ簡単にするための複数のイノベーションを集約したものです。 Projective TrendLine (投影トレンドライン) - 今後のトレンドのスピードリファレンス。 RealTime TrendLine vs. Projective TrendLine (リアルタイムトレンドライン vs. Projective TrendLine) - 市場が同じ方
Cycle Sniper
Elmira Memish
4.41 (37)
NEW YEAR SALE PRICE FOR LIMITED TIME!!! Please contact us after your purchase and we will send you the complimentary indicators to complete the system Cycle Sniper is not a holy grail but when you use it in a system which is explained in the videos, you will feel the difference. If you are not willing to focus on the charts designed with Cycle Sniper and other free tools we provide, we recommend not buying this indicator. We recommend watching the videos about the indiactor and system before pu
The All-in-One Trade Indicator (AOTI) determines daily targets for EURUSD, EURJPY, GBPUSD, USDCHF, EURGBP, EURCAD, EURAUD, AUDJPY, GBPAUD, GBPCAD, GBPCHF, GBPJPY, AUDUSD, and USDJPY. All other modules work with any trading instruments. The indicator includes various features, such as Double Channel trend direction, Price channel, MA Bands, Fibo levels, Climax Bar detection, and others. The AOTI indicator is based on several trading strategies, and created to simplify market analysis. All-in-One
TakePropips Donchian Trend Pro
Eric John Pajarillaga Aldana
4.61 (18)
TakePropips Donchian Trend Pro   (MT4) は、ドンチャン チャネルを使用してトレンドの方向を自動的に検出し、エントリーとエグジットの取引シグナルを提供する強力で効果的なツールです! この多機能インジケーターには、トレンド スキャナー、取引シグナル、統計パネル、スクリーナー、取引セッション、およびアラート履歴ダッシュボードが含まれます。取引シグナルを提供し、チャートを分析する時間を節約するように設計されています! ユーザー マニュアルとインストール ガイドは、ブログ投稿 (   https://www.mql5.com/en/blogs/post/751368   ) からダウンロードできます。 今日は 50% オフ! 98ドルから49ドルに値下げ! このインジケーターは、ストラテジー テスターでテストできます (ビジュアル モードを有効にします)。 詳細については、説明の下にあるビデオ チュートリアルも利用できます。 ご不明な点やサポートが必要な場合は、私に連絡してください。 TakePropips Donchian Trend Pro イン
これはMT4のインジケーターで、再描画なしで取引に参入するための正確なシグナルを提供します。 外国為替、暗号通貨、金属、株式、インデックスなど、あらゆる金融資産に適用できます。かなり正確な見積もりを提供し、取引を開始して終了するのに最適な時期を教えてくれます。1つのシグナルを処理しただけでインジケーターの元が取れた例の 動画 (6:22)をご覧ください。Entry PointsPro インジケーターの助けを借りたほとんどのトレーダーの最初の1週間の結果が改善しています。 Telegramグループ に登録してください。Entry Points Proインジケーターのメリットは次の通りです。 再描画のないエントリーシグナル 再描画されるインジケーターでは一度表示されたシグナルが削除されて大きな金銭的損失につながることがありますが、これと異なり、表示されて確認されたシグナルは消えることがありません。 エラーなしの取引開始 インジケーターアルゴリズムによって取引を開始する(資産を売買する)理想的な瞬間を見つけることができます。それを使用するすべてのトレーダーの成功率が向上します。
プレシジョン・インデックス・オシレーター(Pi-Osc)は、Precision Trading SystemsのRoger Medcalfによるものです。 バージョン2は、チャートにスーパーファストでロードされるように注意深く再コードされ、その他の技術的な改良も組み込まれて、エクスペリエンスを向上させています。 Pi-Oscは、市場が強制的に行かなければならない、すべての人のストップを取り除くためのポイントである、極限のエクソースト・ポイントを見つけるために設計された正確な取引タイミング信号を提供するために作成されました。 この製品は、極限のポイントがどこにあるかを知るという古代の問題を解決し、トレーダーの生活をはるかにシンプルにします。 これは、業界標準のオシレーターとは異なる強力な要素を持つ高度なコンセンサス・インジケーターです。 使用されている一部の機能には、需要指数、マネーフロー、RSI、スティリング、パターン認識、出来高分析、標準偏差の極値などがあり、異なる長さでこれらのバリエーションが多く含まれています。 初めて見ると、訓練されていない目には、他の
Welcome to the world of SMC (Smart Money Concepts) Trading, where we empower traders with the tools and knowledge to make smarter trading decisions. Our latest addition to our suite of trading tools is the SMC Trading Pro indicator, version 1.0. Key Features: Major Market Structure Identification with BODY break. Order Block must be in Major Swing ( not Small Swing ). Order Block with Fair Value Gap Detection. Order Block in Discount | Premium zone. Filter for only Bullish, Bearish or All Order
ZeusArrow Smart Liquidity Finder  Smart Liquidity Finder is Ai controlled indicator based on the Idea of Your SL is My Entry. It scan and draws the major Liquidity areas on chart partitioning them with Premium and Discount Zone and allows you find the best possible trading setups and help you decide the perfect entry price to avoid getting your Stop Loss hunted . Now no more confusion about when to enter and where to enter. Benefit from this one of it's kind trading tool powered by Ai an trade
A. A2SR とは何ですか ?   * 先行テクニカル指標です (塗り直しなし、ラグなし)。 -- ガイダンス : -- https://www.mql5.com/en/blogs/post/734748/page4#comment_16532516 -- そして https://www.mql5.com/en/users/yohana/blog A2SR には、サポート (需要) とレジスタンス (供給) のレベルを決定する特別な手法があります。 ネットで見かける通常の方法とは異なり、A2SR は実際の SR レベルを決定する独自のコンセプトを持っています。 元の手法はインターネットから取得されたものではなく、インターネット上で公開されたこともありません。 A2SR は、取引スタイルに応じて SR レベルを自動選択します。 時間枠を変更しても、SR レベルはその位置にとどまります。 実際のSRは、使用する時間枠から取得されるわけではないため. A2SR には、取引のための完全な手段があります 。 実際のサポート (需要) とレジスタンス (供給) の真のコンセプト。
PRO Renko Systemは、特別にRENKOチャートを取引するために設計された高精度の取引システムです。 これは、様々な取引商品に適用することができる普遍的なシステムです。 システムは効果的に正確な逆転信号へのアクセスを与えるいわゆる市場の騒音を中和する。 表示器は非常に使いやすく、信号の生成に責任がある1つの変数だけがあります。 あなたは簡単にお好みの任意の取引ツールとレンコバーのサイズにツールを適応させることができます。 私はいつもあなたが私のソフトウェアで収益性の高い取引を支援するために余分なサポートを提供する準備ができています! 私はあなたに幸せで収益性の高い取引をしたいです! ご購入後にご連絡ください! 私はあなたに私のレンコチャートジェネレータを送信します。 私はまた、私の個人的な推奨事項やシステムの他のモジュールを無料で共有します!
現在31%オフ! 初心者やエキスパートトレーダーに最適なソリューション! このインジケータは、独自の機能と秘密の数式を組み込んだ、ユニークで高品質かつ手頃な価格のトレーディングツールです。たった1枚のチャートで28の通貨ペアのアラートを表示します。新しいトレンドやスキャルピングチャンスの引き金となるポイントを正確に把握することができるので、あなたのトレードがどのように改善されるか想像してみてください! 新しい基本的なアルゴリズムに基づいて構築されているため、潜在的な取引の特定と確認がより簡単になります。これは、通貨の強さや弱さが加速しているかどうかをグラフィカルに表示し、その加速のスピードを測定するためです。加速すると物事は明らかに速く進みますが、これはFX市場でも同じです。つまり、反対方向に加速している通貨をペアにすれば、利益を生む可能性のある取引を特定することができるのです。 通貨の勢いを示す縦の線と矢印は、あなたの取引の指針となるでしょう。 ダイナミックマーケットフィボナッチ23レベルはアラートトリガーとして使用され、市場の動きに適応します。もしインパルスが黄色
収益性の高い取引機会を簡単に特定するのに役立つ強力な外国為替取引インジケーターをお探しですか?ビースト スーパー シグナル以外に探す必要はありません。 この使いやすいトレンドベースのインジケーターは、市場の状況を継続的に監視し、新しいトレンドを検索したり、既存のトレンドに飛びついたりします。ビースト スーパー シグナルは、すべての内部戦略が一致し、互いに 100% 合流したときに売買シグナルを発するため、追加の確認は不要です。シグナル矢印アラートを受け取ったら、単に売買します。 購入後、プライベート VIP グループに追加されるようにメッセージを送ってください! (完全な製品購入のみ)。 購入後、最新の最適化されたセット ファイルについてメッセージを送ってください。 MT5バージョンは こちらから入手できます。 Beast Super Signal EA は こちらから 入手できます。 コメント セクションをチェックして、最新の結果を確認してください。 ビースト スーパー シグナルは、1:1、1:2、または 1:3 のリスクと報酬の比率に基づいて、エントリ
このインディケータは、当社の2つの製品 Advanced Currency IMPULSE with ALERT  +   Currency Strength Exotics . のスーパーコンビネーションです。 このインジケーターは全ての時間枠で作動し、8つの主要通貨と1つのシンボルの強弱のインパルスをグラフで表示します。 このインジケータは、金、エキゾチックペア、商品、インデックス、先物など、あらゆるシンボルの通貨強度の加速度を表示することに特化されています。金、銀、原油、DAX、US30、MXN、TRY、CNHなどの通貨強度の加速度(インパルスまたは速度)を表示するために、任意のシンボルを9行目に追加できる、この種の最初のものです。 新しいアルゴリズムに基づいて構築され、潜在的な取引の特定と確認がさらに容易になりました。これは、通貨の強さや弱さが加速しているかどうかをグラフィカルに表示し、その加速の速度を測定するためです。加速すると物事は明らかに速く進みますが、これはFX市場でも同じです。つまり、反対方向に加速している通貨をペアリングすれば、潜在的に利益を生む取
️️ Attention:      The price will soon be raised to what it was before ($500).      No more losses with this indicator, test it for years ago and see if there is losses in one day results. but before testing it please see the explaining video down here.    FxBears Powers is working on all forex pairs, metals, commodities, futures, indices, energies, crypto, and everything...and on all timeframes from M1 to MN.   It's based on supply and demand zones, price action, and some internal indicators,
作者のその他のプロダクト
Dashboard uses Ichimoku Strategy to find best trades. Get extra Indicators/Template: And read more about detailed Product Description and usage here: https://www.mql5.com/en/blogs/post/747457 Please note: I won’t be able to add new settings. It already has 72 settings  :) Some people are using it with their EAs. And iCustom function can only take Max 64 settings. So, I cannot let it grow any further. I’ll definitely be maintaining the code and solving issues. Don’t worry. Please check all
Scanner Dashboard for Best Heiken Ashi VQZZ Arrows Indicator here: https://www.mql5.com/en/market/product/45900 Check out this post for detailed description on How To Use All Indicator extras and template: https://www.mql5.com/en/blogs/post/758259 Please note that if you are using too many pairs/timeframes, then VQZZ calculations might slow down the dashboard. So be careful not to use too many VQZZ Higher timeframes if you are using too many pairs. Also, VQZZ is based on higher timeframes. e
Read detailed description and Get Free Demo and extra indicators: https://abiroid.com/product/abiroid-halftrend-scanner Features: - Halftrend Arrow Scan: Scan Max Past Bars for Halftrend arrows. Show how many bars back the arrow occurred in a bracket - Past Bars Back Alerts: Num of bars back for which scanner will send alerts - Halftrend HTF Align: Scan Higher timeframes for Trend Direction of Halftrend Indicator and if trends align show a slanting Green/Red Arrow for Up/Down trend - Semafor
How To Use Check out this post for detailed description on  All Indicator extras and template: https://www.mql5.com/en/blogs/post/758259 The Best Heiken Ashi System is a simple trading system for trading based only two indicators for generate signals: Heiken ashi smoothed and Vqzz indicator multi-timeframe. The system was created for scalping and day trading but can also be configured for higher time frames. As mentioned, the trading system is simple, you get into position when the two ind
FREE
About: A Fibonacci indicator is best used with other indicators like Pivots, Support/Resistance etc. Price tends to use Fibo levels as Support or Resistance lines. So, this indicator is very useful to know when price might reverse or if a level is crossed, price might continue the trend. Also, to find the best Take Profit and StopLoss lines. Don't use Fibo Indicator alone for trading as it might not always be accurate. Use it to make your strategies better as a supporting indicator. Settings:
FREE
This indicator is based on Guppy's GMMA Strategy. And shows arrows when GMMA lines cross up or down. To have this indicator and get alerts for Multiple Timeframes and multiple Pairs you can check out the demo of this GMMA Trend Scanner indicator: https://www.mql5.com/en/market/product/38747 About GMMA In Brief: GMMA attempts to identify trends by combining two groups of moving averages with differing time periods: The long-term EMAs (30, 35, 40, 45, 50, and 60) the behaviors of investors that
FREE
This is a Sharkfin Arrows Indicator. Get TDI extra indicators here: https://www.mql5.com/en/blogs/post/758252 This indicator will show only Arrows. It does not have TDI symbols on chart. Please get the extras from links above for TDI indicators. TDI Scanner Dash (paid): https://www.mql5.com/en/market/product/41826 About: This Indicator finds the Shark Fin Pattern. It will show an arrow in the current bar if RSI sharkfin is finished forming in previous bar. What is Shark Fin TDI Patt
FREE
How the Indicator Works: This is a Multi-timeframe MA multimeter indicator which studies if price is above or below a particular EMA range and shows Red/Green/Yellow signals. Red: Price Below EMA range Green: Price above range Yellow: Price within range Indicator Properties: EMA Settings: - Default Period is 200. You can change all MA Settings like Period, MA Method (SMA, EMA, etc) or MA Applied Price (Close, Open, etc). - EMA Range list is a comma separated value list for different timefr
FREE
3 Level ZZ Semafor Scanner: This is a Dashboard indicator which uses 3LZZ Indicator in the background to find semafors. It will give priority to the semafors3 because they specify a strong signal. So, even if there is a sem1 or 2 on current bar, and if Sem3 was within "Check Previous Bars for Sem 3". Then it will show Sem3 instead. Read about this in detailed post: https://www.mql5.com/en/blogs/post/758250 And get all extra Indicators/Template from above link. Please note: Number of setti
Features: Find these engulfing patterns: Simple Engulf Stick Sandwich Engulf Three Line Strike Rising Three Morning Star Doji Scanner is useful to make your strategy better. Don't always go by Win/Loss percentage. Because this tool is not based on past results. Basic Settings: For All Patterns You can set: First:Last Candle Ratio This will make sure that the earlier opposite candle is at least this given ratio in height as compared to the engulfing candle. This is not checked for Three Line Stri
FREE
This Indicator uses Center of Gravity (COG) Indicator to find you the best trades. It is a reversal based Swing Indicator which contains an  Arrows Indicator. That you can buy here from Metatrader Market. Check out this blog post for detailed How to Use Guide and links to free scanner: https://www.mql5.com/en/blogs/post/758262 Scanner needs this arrows indicator in same directory to run Copy scanner ex4 in same folder as your Arrows Indicator: MQL4/Indicators/Market/ All extra indicators
This strategy is best used for Trend based trading. While market is trending, price still makes smaller ranges. Darvas boxes show breakouts from these small ranges, while still following the original market trend. Detailed Description: https://www.mql5.com/en/blogs/post/747919 Features: Darvas - Check Darvas Box Breakout -   Check Price Above/Below MA or Darvas Box has crossed MA -   Min, Max Box Height -   Max Distance Between Entry Price and Darvas Box Other Indicators: - NRTR Tren
Features: - Moving Average Slope for Max Past Bars - Slope Period - Slope Thresholds - Multiple Slope Type options - See slope visually as a histogram - Info Panel Show/Hide Slope Calculations and Types: The slope value is calculated using the Slope Period. Suppose Period is 5, it will check the MA value for bar (x) and bar (x+5). And find the slope angle between them. Read detailed description about Slope Types and Settings here: https://www.mql5.com/en/blogs/post/747651
FREE
This Scanner Dashboard uses the Extreme TMA System Arrows Indicator to show good BUY/SELL signals. This Product contains dashboard only. It does not contain the Abiroid_Arrow_Extreme_TMA.ex4 indicator. Arrows indicator is not necessary for dashboard to work.  To see arrows, you can buy the arrows indicator separately if you like: https://www.mql5.com/en/market/product/44822 Dash shows Slopes for current and Higher Timeframes. - 1st diamond is current TF. Next diamonds are higher TFs (Please N
Moving Average Rainbow Stack: Free: Single Currency & Single Timeframe MA Stack Very useful for finding current and higher timeframe trends. Best suited for long term trend based trading. Use fewer MAs for quick scalping. And not suitable during low volatility. Only use during high volatility and steady trending markets. Use this to enhance your existing Trend based strategies to find best trends. Read detailed description https://abiroid.com/product/abiroid-ma-stack Available MTF and Scanner
FREE
About Scanner: Detailed blog post is here: https://www.mql5.com/en/blogs/post/749119 BB Squeeze Scanner uses   bbsqueeze.ex4   in background to calculate when BB Squeeze (Bollinger Bands Squeeze) happens and when BBands expand. It is attached with the above blog post. What is Bollinger Bands Squeeze: The Bollinger bands squeeze is a special pattern when the volatility of a market decreases after trending periods. It is generally observed the price is ranging during this period until a
Description This scanner uses 3LZZ TRO ex4 and scans for Semafors at given “Shift” bar. Scanner Detailed Settings: https://www.mql5.com/en/blogs/post/747456 Other Settings: Set Periods for Semafor 1,2,3 Set alerts on/off for Semafor 1,2,3 Shift bar (Bar on which semafor is scanned) Refresh After Ticks (Number of ticks when dash is refreshed) This scanner is pretty simplistic version. And a more detailed version with a different strategy is available here: https://www.mql5.com/en/market/produ
FREE
Abiroid Multi Slope indicator allows you to calculate a Slope Histogram for any line of any indicator . Histogram is for 1 slope line only, but slope values can be calculated for 3 lines total. To have multiple histograms, add as many Slope indicators for custom indicators as you like on chart. You just need to provide the Indicator name, buffer value, slope's period and max number of bars back. By default it has slope calculation for TDI_v4.ex4 indicator. There is no way to specify parameters f
FREE
Features: - Current TF GMMA Cross and Trend (Mandatory Check.. G-Up/G-Down) - HTF GMMA Trend Check (Optional.. slanting arrow) - TDI or NRTR Trend Check (Optional.. diamond) Read post for detailed description and downloading extra indicators: https://www.mql5.com/en/blogs/post/758264 Scanner: This is a Dashboard Scanner for finding good trades using the GMMA method as base and TDI method for trend verification. All buttons for all Pairs and Timeframes are clickable and will change the ch
Extreme TMA System with Arrows Indicator And Buy/Sell Boxes with Take Profit & Stop Loss This is a Non-Repainting Arrows Indicator based on the Extreme TMA System. It shows TMA cross signals and the best BUY/SELL signals. Along with the most predicted TakeProfit. And StopLoss based on TakeProfit ratio. Please note: This is an Arrows only Indicator. Dashboard is sold separately here: https://www.mql5.com/en/market/product/44825 About Indicator: This indicator shows BUY/SELL Signal Arrows a
Abiroid Profit Percent Series 1: Arrows Indicator Stochastic Ichimoku with ATR Get the Scanner for free. For getting Profit Percentages for Multiple Timeframes and Multiple Pairs. And read detailed description about this indicator and all the settings here. And get extra Indicators, Templates and settings for download: https://abiroid.com/product/profit-percent-stoch-ichimoku-with-atr Watch the tutorial video here: https://youtu.be/C45-9kWPE2Q About The Strategy: This strategy has 3 main
Profit Percent Series 2 The scanner dashboard available here (for  Free) : https://abiroid.com/product/profitpercent-arrows-ma-confluence Read detailed information about MA Confluence here: https://www.mql5.com/en/blogs/post/747474 Here's a post about Common Settings for all Profit Percent Series Indicators: https://www.mql5.com/en/blogs/post/747456 Strategy: Main Signal Indicators (Any One): MA Cross (In-built) or Hull, OBV Cross, Heiken Ashi Cross Validation Indicators (Preferably l
Free scanner available here: https://abiroid.com/product/abiroid-ema-scalper Basic Strategy: 1: MA Crossover Up/Down Arrow (Mandatory Check) Optional Checks: 2: If NRTR Check On (Optional): For BUY: Check if NRTR blue and For SELL: NRTR Red If NRTR Shadow Distance On (Optional): Check price for 'x' bars back: at Shadow distance (ATR Multiplier distance) from NRTR line. 3: If High Volume bar On: Check if High Volume or if Medium (if on) Volume bar 'x' bars back 4: If HTF Trend Align On (Option
This is a Multi-currency multi-timeframe Support/Resistance Scanner Dashboard for Metatrader 4 (MT4) platform. Get all extras and download free demo here: https://abiroid.com/product/abiroid-support-resistance-scanner Read detailed description in post above. Features: Scan Support/Resistance zones (also called Supply/Demand zones) Show alert when price is inside these zones and highlights the pair/timeframe Show or hide SR zones price nearest to current price (Price_Close) Show or hide cur
This strategy is useful for small timeframe scalping and binary options. Best timeframes: M5,M15,M30 M1 timeframe is too unpredictable. So be careful with that. Read Detailed Description and Get All: - Free Demo - Free Scanner - Extra Indicators ex4 files from https://abiroid.com/product/abiroid-donchian-scanner-and-arrows Arrows Demo only works in strategy tester. So, Arrows Demo won't work with the free scanner. Scanner needs "Abiroid Donchian Arrow.ex4" to work. So make sure both arrows a
Read detailed description and   Get Free Demo   and extra indicators: https://abiroid.com/product/abiroid-supertrend-scanner This is a very simplistic Supertrend scanner dashboard. Features: - Select one of In-Built Supertrend Indicators: xSupertrend or Supertrend_CCI (based on CCI). - Or select your own Custom Supertrend indicator. And specify the UpTrend and DownTrend Buffer numbers - Supertrend Trend Direction Change Scan: Scan Max Past Bars for Supertrend Change. Show how many bars bac
Get Free Scanner and example Strategies And understand detailed description here: https://abiroid.com/product/abiroid-customizer-arrows-and-scanner And get example wrapper here: https://abiroid.com/indicators/customizer-sample-wrappers You can make your own wrappers if your indicators have complex conditions or for In-Built MT4 indicators. Features: - Specify your own Custom Indicator - Specify Buffer values and create Variables - Use those Variables to create your own Buy/Sell Conditions
This is a multi-timeframe multi-currency Fibo (Fibonacci levels) and Pivots scanner which also shows Missed Pivot count and Fibo Golden Ratio Zones. Select separate Pivot Timeframes for each Dashboard Timeframe Check when price is near a Pivot point Check for Price Crossing Pivot Point Use Mid Pivots (Optional) Show Missed Pivots (Optional) Show High Volume Bar Use Fibo (Optional) Use Fibo Golden Ratio (Optional) Set your preferred Timeframe for Fibo or Pivots Check out   Common Scanner Settin
This strategy is best used for Scalping and Binary Options. Strategy: There are 3 EMAs: Faster, Medium and Slower. When Price is Trending, wait for Price to bounce an EMA and scalp at each bounce. Features: - Check if 3 MAs are Stacked - Check Price Bounce Off MAs (Faster, Medium, Slower) - Min Distance Between Faster and Medium MA Filter - Max Distance Between Entry Price and Faster MA Filter - High Volume Check - Heiken Trend Check - Volatility Check - Higher/Lower Timeframes MA Stacked check
Bollinger Bands Breakout Strategy has an Arrows and Scanner Dashboard indicator set. It is for MT4 (Metatrader 4) platform. When price breaks out of a Bollinger Outer Band in a powerful way, it becomes a great position for scalping. Because the next few bars will most likely keep going in the same direction. Especially if Middle band is also sloping towards that breakout. It's also great for Binary options when using 2-3 next few bars. Strategy: BUY  Bollinger Bands: - Price breaks out of
フィルタ:
Sl80
553
Sl80 2021.11.01 11:25 
 

The scanner and TDI system is very useful and a good piece of work but a little heavy on the computer resources.

Yerly
610
Yerly 2021.10.05 08:35 
 

Un peu lourd, mais très efficace. Top.

Aravind Kolanupaka
8900
Aravind Kolanupaka 2021.03.13 23:53 
 

Good

Jorge Bascope Lazo De La Vega
437
Jorge Bascope Lazo De La Vega 2021.03.01 18:36 
 

Excelente indicador, lo puede combinar con cualquier estrategia.

Paulina Andrea Madariaga Figueroa
4147
 

I don't understand how this indicator is not so popular. All of this author's products are fantastic.

keltonactis
1052
keltonactis 2020.06.10 04:20 
 

ユーザーは評価に対して何もコメントを残しませんでした

asaens15
2126
asaens15 2020.05.12 19:32 
 

ユーザーは評価に対して何もコメントを残しませんでした

Wan Ping Fei
1690
Wan Ping Fei 2019.12.24 06:37 
 

👍👍👍

レビューに返信
バージョン 1.11 2023.01.19
TDI Scanner v1.11
Added TSL Period, Shift and Type as options
バージョン 1.10 2021.01.30
TDI Scanner v1.10:
- VB_Consolidation 0 will now disable Consolidation check
- Added Option to Highlight pairs with Open Orders for easier trading.
バージョン 1.9 2020.07.30
TDI Scanner v1.9
- Fixed bug of Missing Pair names in Popup Alerts
バージョン 1.8 2020.07.30
TDI Scanner v1.8
Added feature for File Alerts in MQL4/Files folder
Useful for getting alerts in your EA.
For e.g.: using Abiroid Telegram Forwarder EA like this:
https://abiroid.com/product/abiroid-dashboards-to-telegram-ea
バージョン 1.7 2020.07.20
TDI Scanner v1.7:
Fixed Trend Aligned timeframes alert message repeating bug.
バージョン 1.6 2020.05.29
v1.6
Added support for ECN and Micro broker accounts which have a suffix "i" or "m"
Like EURUSDi
バージョン 1.5 2020.05.12
v1.5

New Features
- Support/Resistance Check
- HTF Trend Alignment Check
- Option to use Stochastic instead of RSI (RSI is default)
- VB Consolidation Level
(Check screenshots for new Symbols and meanings)

Removed:
- Trend Align Check Comma separated timeframes
And instead checking current TF trend with it's corresponding Higher Timeframe Trends
バージョン 1.4 2020.02.16
TDI Scanner v1.4
Added Features: (All Optional - can be set in Properties)
- Prices in Email Alerts,
- Volatility Check for BUY/SELL Alert
- OverBought/Sold Check for BUY/SELL Alert
- Check Timeframes Aligned with BUY/SELL and get Alert on Alignment
バージョン 1.3 2019.10.01
Added code to detect if Previous Day/Week/Month's High or Low is Crossed (with Alerts)
バージョン 1.2 2019.09.27
Added TDI SharkFin Pattern Scan Feature.
バージョン 1.1 2019.09.10
Created Prefix external variable.