Three CCI and BandSqueeze for MT5
- インディケータ
- Norio Takahashi
- バージョン: 1.1
- アクティベーション: 5
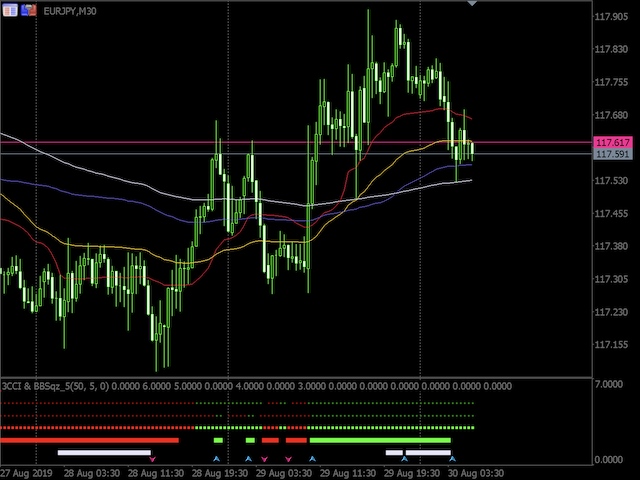
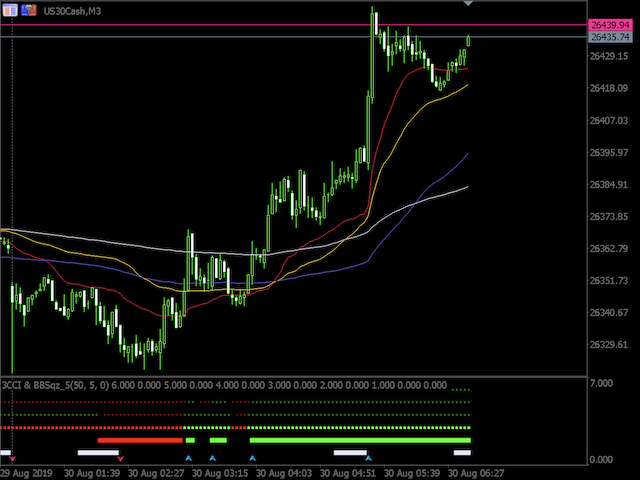
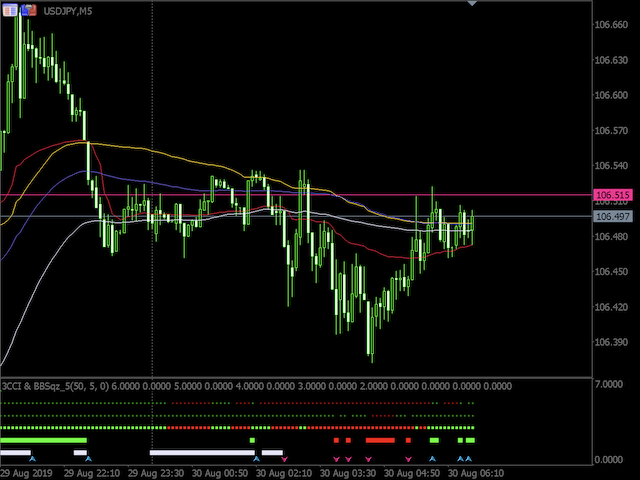
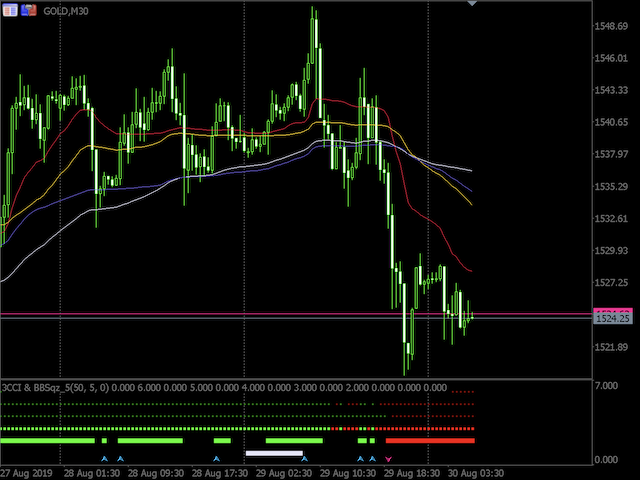
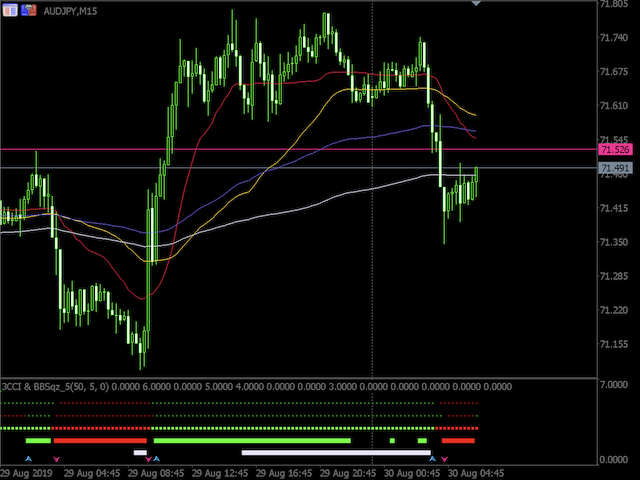
3つの周期のCommodity Channel Index(CCI)から現在の騰落を判断し、色分けでパネル状に表示します。
3つの周期は、第1周期(最小周期)に対して乗ぜられる補正係数によって第2、第3が変更されます。
さらに、それぞれのCCIはATR(Average
True Range)でバラツキを修正して表示されます。
3つのCCIのうち、2つが揃ったときにTrend_1、3つすべてが揃ったときにTrend_2を表示します。
//---
Bollinger Bandsのバンド幅が極端に狭くなったところでSqueezを表示します。
Bands周期及びBandsDeviation(偏差)、ならびにバンド幅の過去最大と過去最小に於ける許容偏差を調整することで、
Squeez強度の表示を変更できます。
//---
Up矢印およびDown矢印表示は、
Squeezが発生しているときには表示されません。
Squeez終了時点のTrend_1状況、Trend_2発生の状況に応じ表示されます。