Fractal SR Clusters
- インディケータ
- Daniel Shea
- バージョン: 1.2
- アップデート済み: 28 3月 2020
- アクティベーション: 5
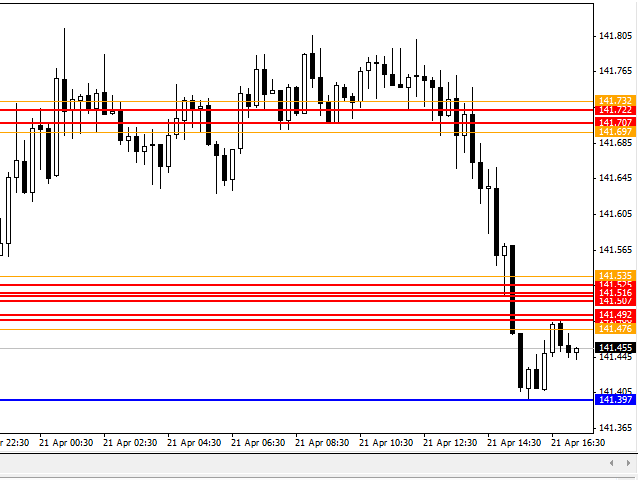
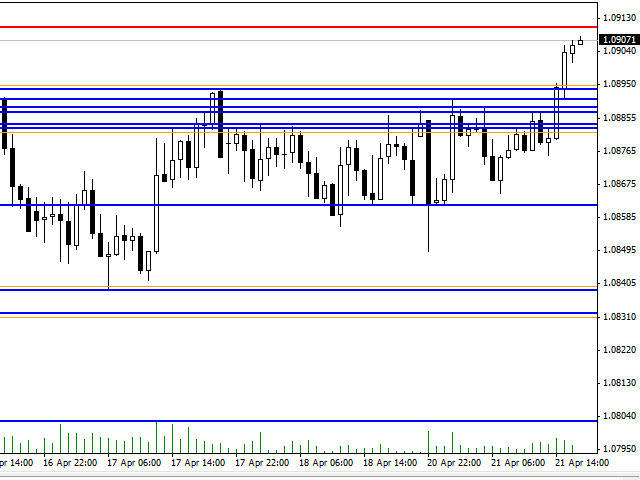
Fractal Support/Resistance Clusters is an indicator that draws support and resistance lines based on fractals whose sources have not yet been broken and are therefore still relevant. A fractal is relevant as an indicator of support or resistance when the price of its previous opposing fractal has not been broken.
Clusters of support and resistance zones are derived using the density-based spatial clustering of applications with noise (DBSCAN) algorithm and can be drawn on the screen. These clusters use the standard deviation of the price as bounds. For more information concerning the algorithm itself, see the Wikipedia page: http://en.wikipedia.org/wiki/DBSCAN
If desired, alerts may be enabled to notify the user of a bullish or bearish breakout when it occurs. A breakout is defined as an instance in which the closing price of the previous bar is outside of a cluster while the closing price of the bar prior to that is within a cluster. Breakouts can be defined by either an arbitrary point break or relative to the standard deviation of the price based on the cluster settings.
For general purposes, the default settings should suffice.
Parameters
Main Indicator Settings:
- LookBack - the number of bars to look back to find relevant fractals
- SupportColor - the color of the support lines
- ResistanceColor - the color of the resistance lines
- SRLineWidth - the width of the support and resistance lines
- ShowPrice - if true, displays the price on the right side of the window
Cluster Settings:
- ShowClusters - whether clusters should be calculated at all
- StdDevPeriod - the period used to derive the standard deviation of the price
- StdDevSigma - the amount, by which the standard deviation should be multiplied
- DrawBoundsByStdDev - if true, then boundaries for cluster regions are drawn based on the distance, by which a cluster region searches for more members; this is recommended for greater timeframes
- PointDistance - the distance in points that should be used to draw bounds for cluster regions; this is used if the previous parameter is set to false and is recommended for lower timeframes
- ClusterColor - the color of the cluster boundary lines
- ClusterLineWidth - the width of the cluster region lines
Alert Settings:
- AlertOnBreakout - notify the user when there is a cluster breakout
