PZ Penta O MT5
- インディケータ
- PZ TRADING SLU
- バージョン: 8.1
- アップデート済み: 31 1月 2022
- アクティベーション: 20
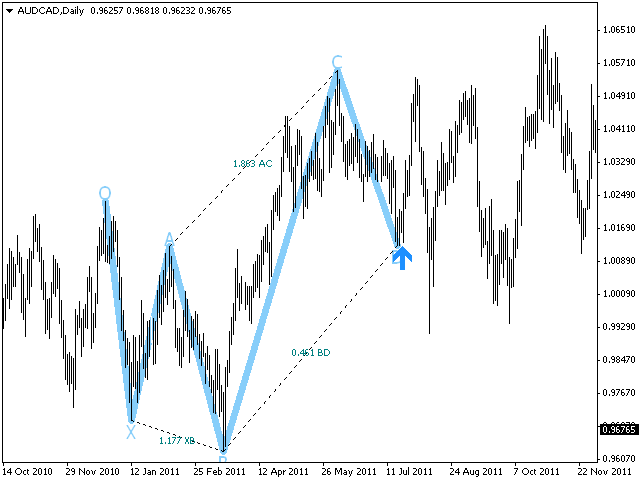
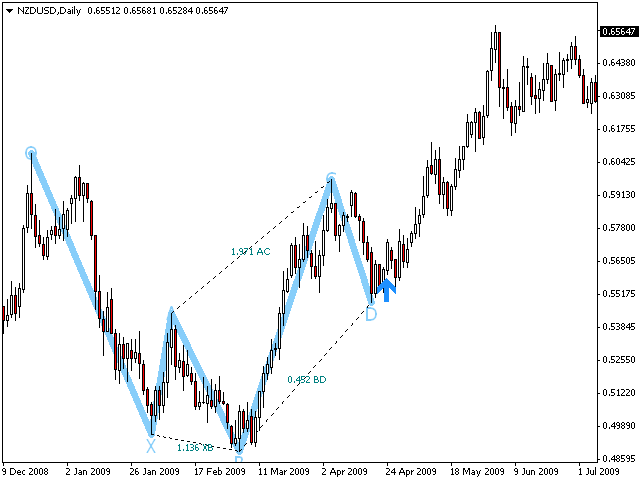
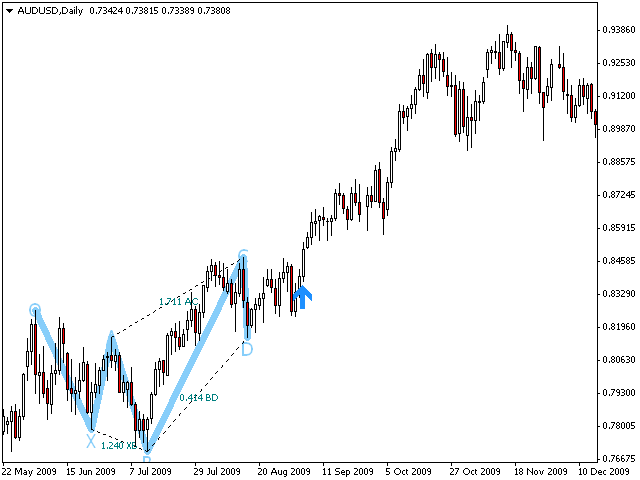
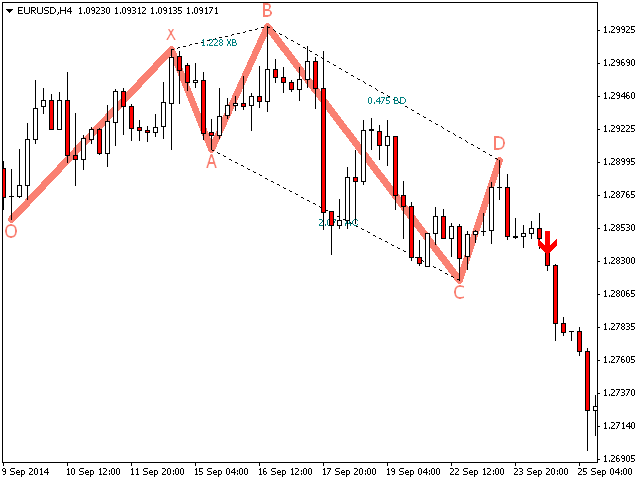
The Penta-O is a 6-point retracement harmonacci pattern which usually precedes big market movements. Penta-O patterns can expand and repaint quite a bit. To make things easier this indicator implements a twist: it waits for a donchian breakout in the right direction before signaling the trade. The end result is an otherwise repainting indicator with a very reliable trading signal. The donchian breakout period is entered as an input. [ Installation Guide | Update Guide | Troubleshooting | FAQ | All Products ]
- Customizable pattern sizes
- Customizable colors and sizes
- Customizable breakout periods
- Customizable pattern ratios
- It implements visual/sound/push/mail alerts
Kindly note that price patterns such as this can expand and the indicator must repaint to follow the expansion of the pattern. If the pattern repaints beyond the ratios entered in the parameters, the pattern will dissapear as it won't be valid any more. To trade these patterns, please resort to the donchian breakout signal.
- Bullish patterns are blue
- Bearish patterns are red
Penta-O patterns do not happen very often: to find more, load the indicator many times in the chart with different amplitudes.
Important: This indicator has been renamed to comply with a trademark complaint from Mr. Scott M. Carney, who owns the following trademarks in the USA: Five-O Pattern.
Technical Information
- The indicator is evaluated every bar, not every tick.
- The last point of the pattern repaints as the pattern expands.
- You can have several indicators on the chart with different amplitudes.
- An alert is displayed when the pattern forms and also when the breakout takes place.
- A small percentage of trading signals can repaint. You can increase the breakout period.
Input Parameters
- Amplitude: Size of the patterns to be found
- Breakout Period: Donchian breakout period to time signals
- Max History Bars: Amount of bars to look back when the indicator loads
- Min XB: Minimum XB ratio for a valid pattern
- Max XB: Maximum XB ratio for a valid pattern
- Min AC: Minimum AC ratio for a valid pattern
- Max AC: Maximum AC ratio for a valid pattern
- Min BD: Minimum BD ratio for a valid pattern
- Max BD: Maximum BD ratio for a valid pattern
- Labels: Select colors and sizes of the O,A,B and 1,2,3 labels
- Ratios : Select colors and font-size for ratios
- Alert on breakouts: Enable to receive alerts when a pattern is found
- Alert on patterns: Enable to receive alerts when a breakout happens and arrows show up
- Alert settings: Enable or disable visual, push, email and sound alerts
Author
Arturo López Pérez, private investor and speculator, software engineer and founder of Point Zero Trading Solutions.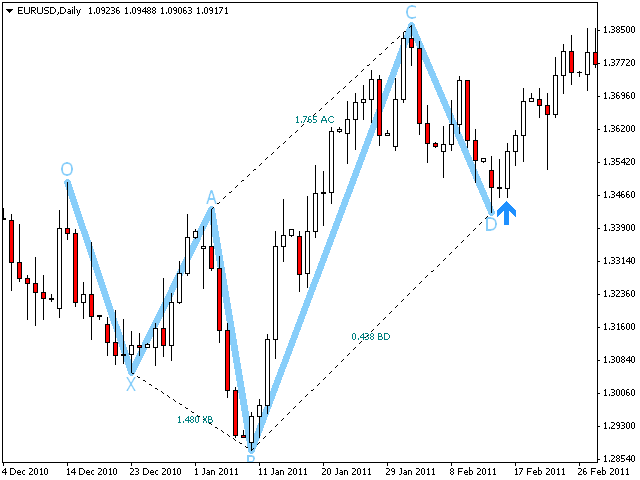


ユーザーは評価に対して何もコメントを残しませんでした