Alert Breakout Scanner and Dashboard
- インディケータ
- Ammar Yaseen
- バージョン: 1.1
- アクティベーション: 5
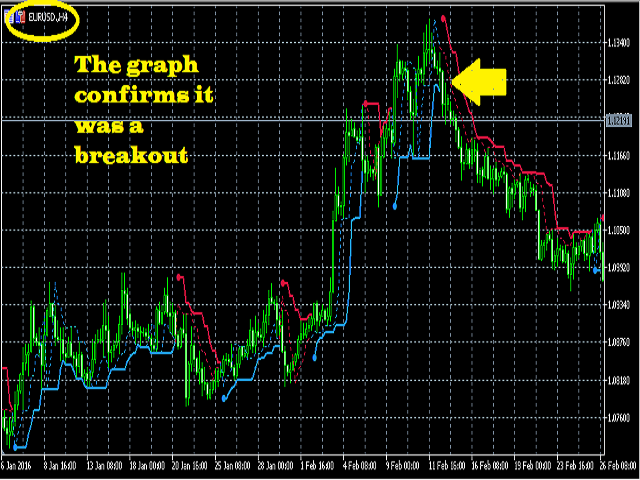
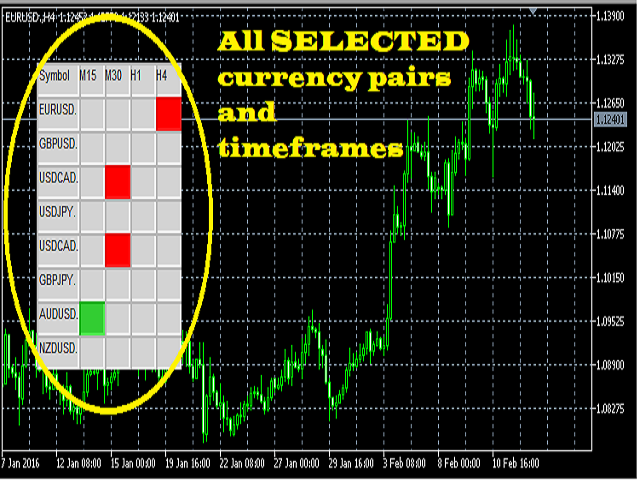
PRICE BREAKOUT ALERT!!!! PRICE BREAKOUT ALERT!!!
Now you dont have to worry about going through each currency pair,
your favorite stocks watch list or crypto to find breakouts. This indicator does everything for you.
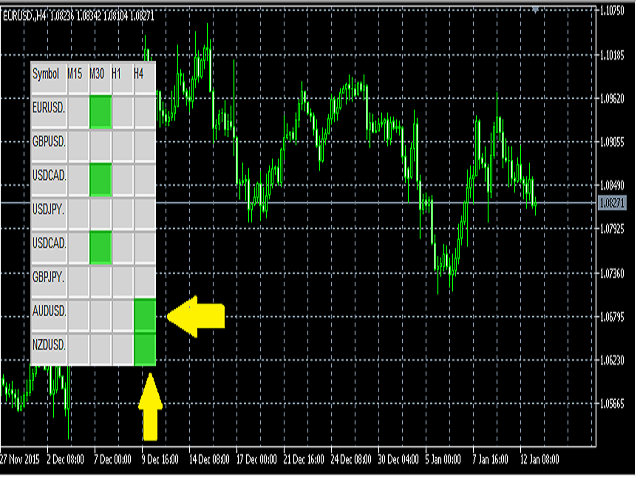
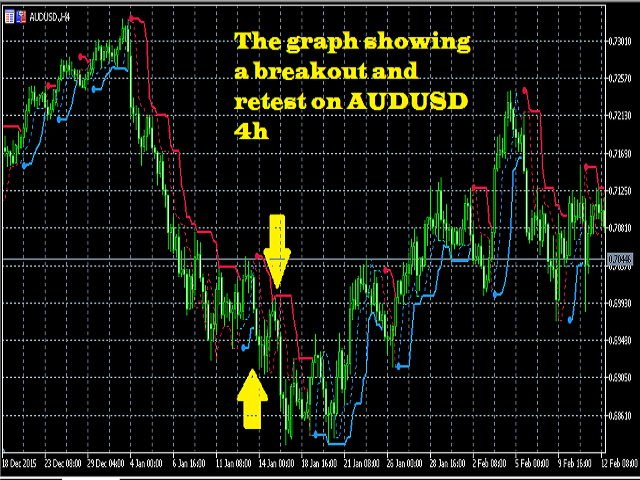
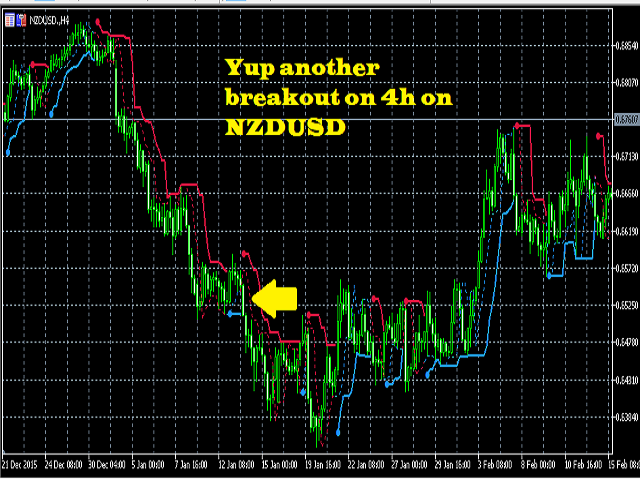
This indicator has the capability to SCAN different CURRENCY PAIRS and TIMEFRAMES to
give you breakout information through
ALERT (MOBILE NOTIFICATION, EMAIL AND PUSH NOTIFICATION)
NOTE: If you are willing to scan more currency pairs along
with many timeframes, you need to have a heavy system because the indicator would have to go through all the combinations to find you your
preferred BREAKOUT settings
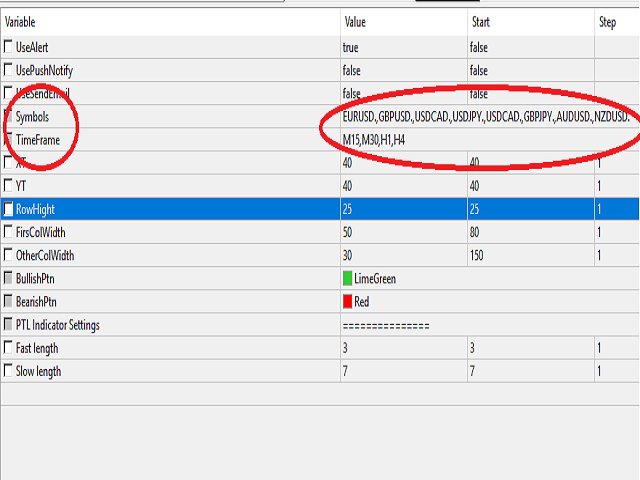
PARAMETERS:
UseAlert: true/false
USEPushNptifify: true/false
UseSendEmail: true/false
SYMBOLS:
You can add as many symbols as you want
NOTE: You have to add symbols
along with a comma
, in between each currency pair like GBPUSD,EURUSD,USDJPY. If your broker uses symbols in currency
pairs, for example if the broker offers symbols EURUSD# and GBPUSD#, you can add like this EURUSD#,GBPUSD#,USDJPY#
TIMEFRAME:
You can add as many timeframes as you want on which you want to check breakouts of your symbols
NOTE: You have to add symbols with a comma , in between each timeframe alloted for example m15,m30,h1,h4
XT: Horizontal
Position of the dashboard
YT: Vertical Position of the dashboard
Row Height: The height of the Dashboard
FirstColWidth: The width of
the Column
OtherColWidth: The width of the Color of currency pair (Bearish or Bullish)
BULLISHPTN: The
bullish pattern color. Default as
LIMEGREEN
BEARISHPTN: The bearish pattern color. Default as RED
BREAKOUT INDICATOR SETTINGS
FAST
LENGTH: The fast length of breakout pattern
SLOW LENGTH: The slow length of breakout pattern


ユーザーは評価に対して何もコメントを残しませんでした