PinBar Scanner PRO
- インディケータ
- Andrzej Grzegorz Kwiatkowski
- バージョン: 1.5
- アップデート済み: 9 7月 2019
- アクティベーション: 5
PINBAR SCANNER PRO with TREND and RSI + CCI OSCILLATORS filter
This indicator has been designed to automatically and constantly scan entire market to find high probability pinbar formations, so you can just wait for the perfect trading opportunity come to you automatically.
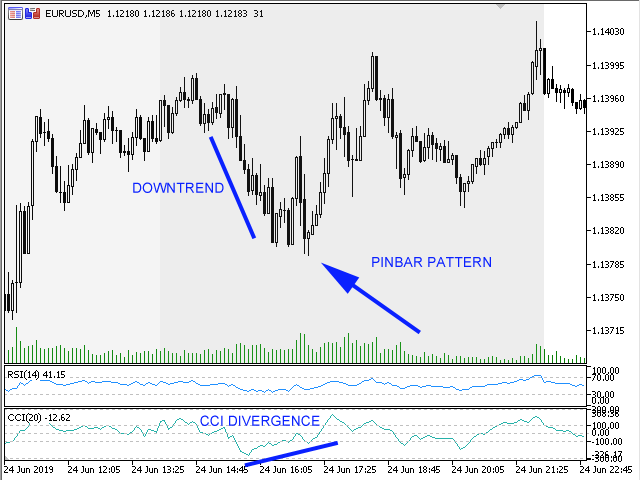
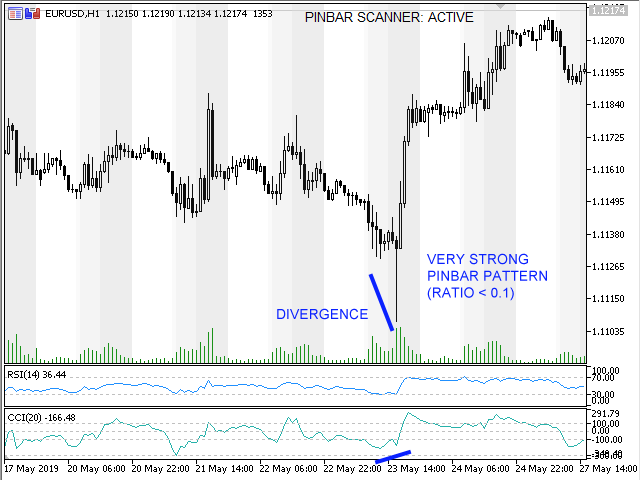
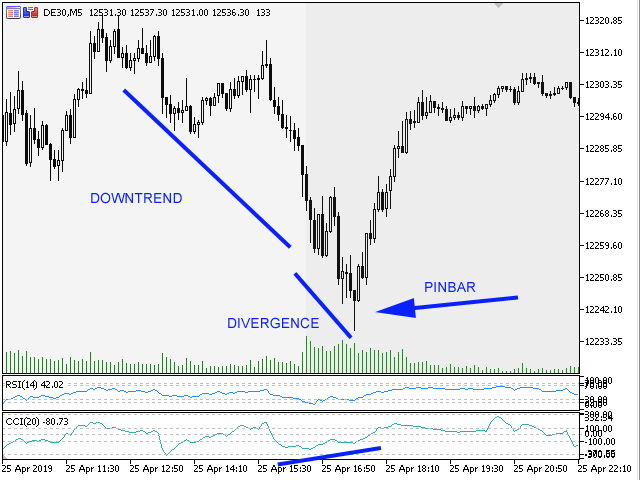
PINBAR is the strongest candle reversal pattern known in technical analysis.
It shows excellent areas to determine potential entries and exits with opportunity to use excellent risk and reward ratios.
It includes an RSI and CCI trend-filter for making it even stronger, finding the best oppportunities and it will show you an alert and send push notification to your mobile phone when these setups are found.
You can even set 3 different levels of strength, and for example only the strongest show in push notifications.
Features:
- This indicator can monitor all symbols which you attach indicator to, all at the same time.
- It can monitor every timeframe, from 1 Minute to Monthly. All at the same time.
- It will automatically trigger an alert + notification whenever the appropriate pattern is identified.
- It will automatically calculate and shows a strength of the pinbar (based on the setting).
- The indicator includes an RSI and CCI oscillators filter, to identify the best possible pinbars.
- The indicator has also trend filter, showing only the PINBARS which are at the end of the downtrend or uptrend.
- It can monitor any symbol in your Metatrader platform. Including crypto, commodities, indices, equities, ETF's etc.
The best way to use the indicator is, after receiving the alert, checking if on that particular price is some important support/resistance level, or if there is divergence on RSI & CCI indicator (screenshots).
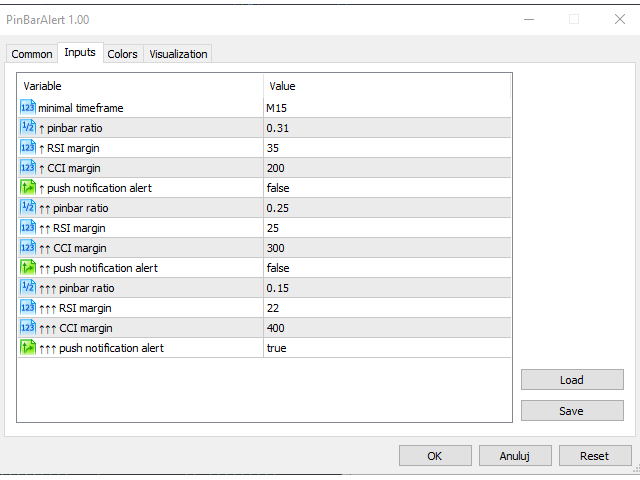
Indicator Parameters:
- minimal timeframe: minimal timeframe indicator will scan the chart
- ↑ pinbar ratio: pinbar ratio (see description below about ratios) of level 1 of strentgh
- ↑ RSI margin: RSI margin high value (for example if it is set to 70 - RSI levels will be 30/70)
- ↑ CCI margin: CCI margin high value (for example if it is set to 300 - CCI levels will be -300/300)
- ↑ push notification alert: true/false - setting for level 1 strength push notification alerts
- ↑↑ pinbar ratio: pinbar ratio (see description below about ratios) of level 1 of strentgh
- ↑↑ RSI margin: RSI margin high value (for example if it is set to 70 - RSI levels will be 30/70)
- ↑↑ CCI margin: CCI margin high value (for example if it is set to 300 - CCI levels will be -300/300)
- ↑↑ push notification alert: true/false - setting for level 1 strength push notification alerts
- ↑↑↑ pinbar ratio: pinbar ratio (see description below about ratios) of level 1 of strentgh
- ↑↑↑ RSI margin: RSI margin high value (for example if it is set to 70 - RSI levels will be 30/70)
- ↑↑↑ CCI margin: CCI margin high value (for example if it is set to 300 - CCI levels will be -300/300)
- ↑↑↑ push notification alert: true/false - setting for level 1 strength push notification alerts
PINBAR RATIO is ratio the body of the candle to the whole candle. It should be lower than 0.31, because larger values indicates that thisi is not pinbar anymore.
Therefore, the smaller the percentage you choose, the stronger pinbar must be.
For example: 0.20 - the body of the candle can only be a maximum of 20% (1 / 5th) of the entire candle.
IMPORTANT:
Scanner will execute an alert if signal will pass all 3 filters at the same time:
1> pinbar ratio
2> RSI level
3> CCI level
In that way you will receive only very strong signals with high probability for signal to make profit with high reward/risk ratio.
THANK YOU for taking the time to review our indicator
CHECK ALSO OUR SESSIONS PRO INDICATOR
IT IS AT LIMITED TIME FREE PROMO OFFER RIGHT NOW
FOLLOW US ON TWITTER (we often give away our pro tools for free).
https://twitter.com/_MT_KING_

Keine Antwort auf Anfragen zum Produkt