TrendPi
- インディケータ
- Andriy Sydoruk
- バージョン: 1.0
- アクティベーション: 5
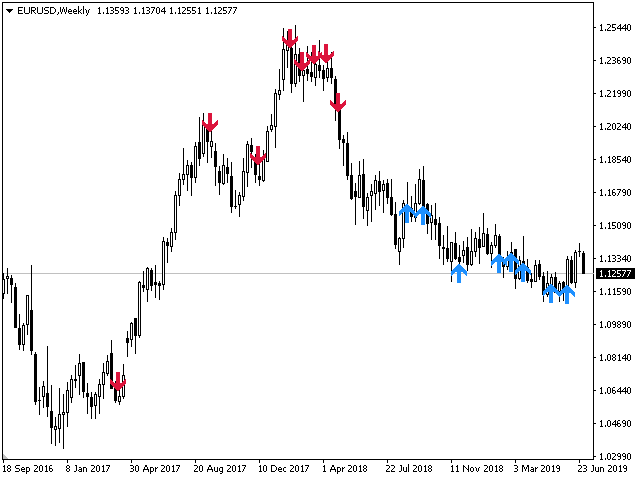
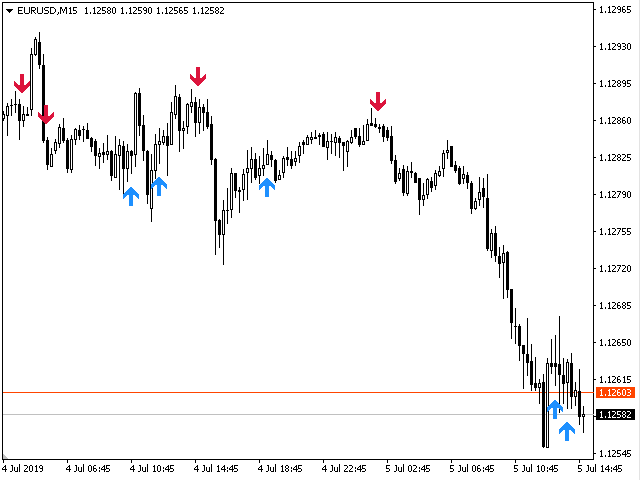
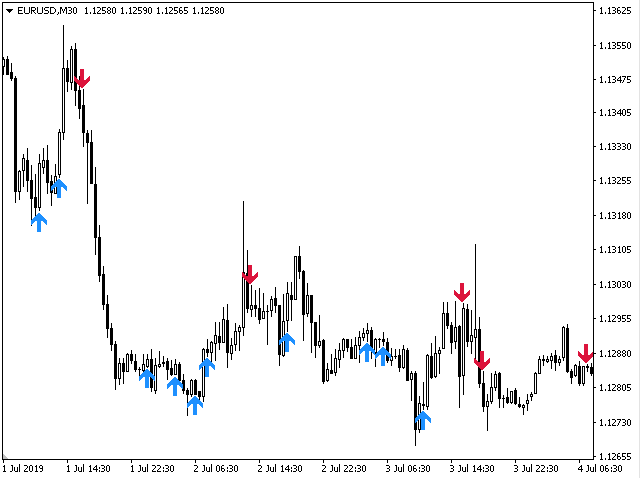
The indicator tracks the market trend with unsurpassed reliability, ignoring sharp market fluctuations and noises around the average price.
This indicator allows you to track the trend and see its beginning, as well as the end, especially when the reversal begins! It catches the
trend and shows the favorable moments of entry into the market with arrows. The indicator can be used for pipsing on small periods, and for
long-term trading. The indicator implements a variety of technical analysis based on the idea that the market has a cyclical nature.