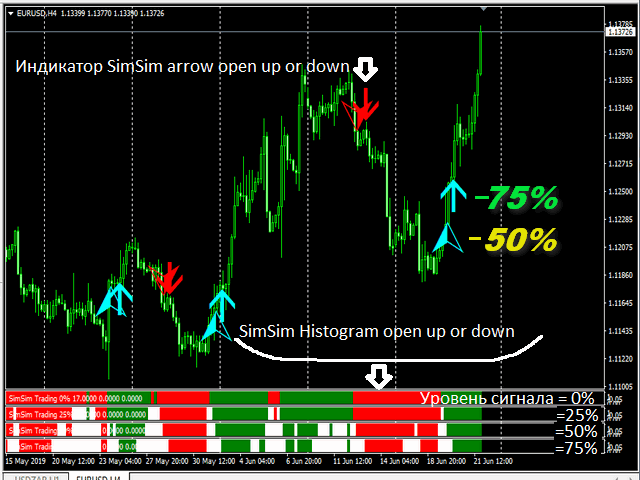
SimSim Histogram open up or down
- インディケータ
- Aleksandr Tyunev
- バージョン: 2.1
- アップデート済み: 23 6月 2020
- アクティベーション: 9
SimSim Histogram open up or down
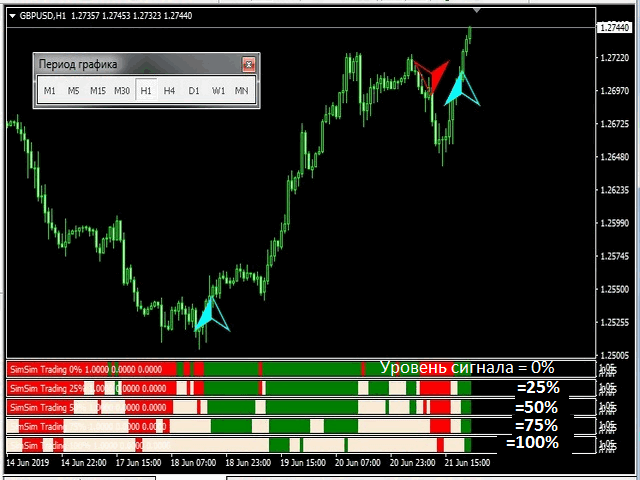
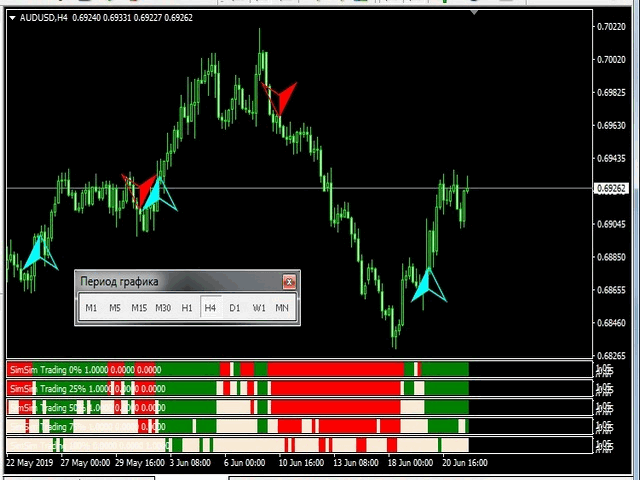
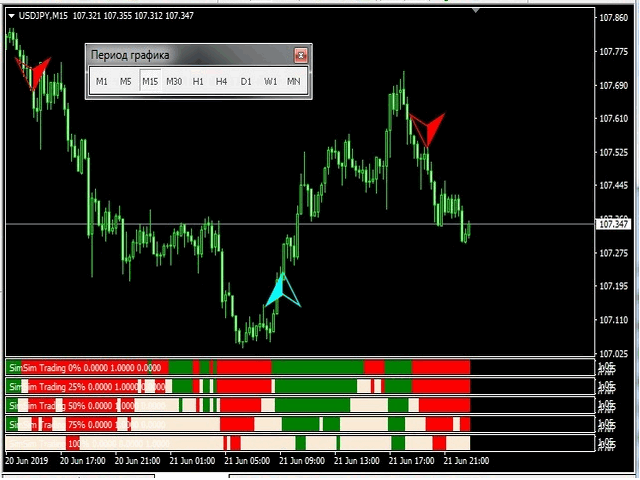
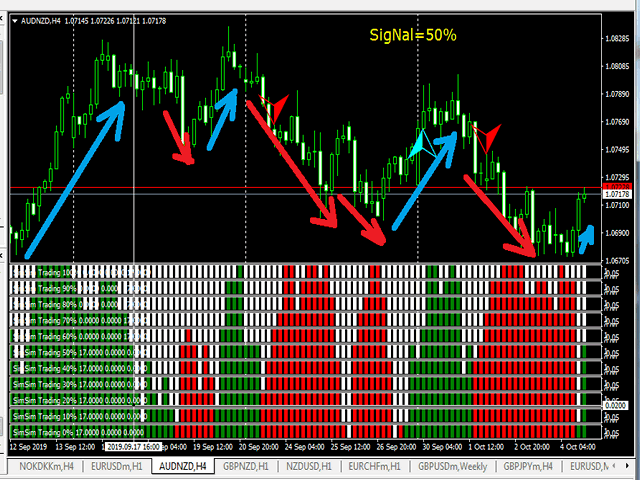
この指標は、25の標準指標からデータを計算して要約します。どの標準指標を使用するか、トレーダーは自分で決定します。計算の結果、現在の信号レベルを取得し、ヒストグラムに色を付けます。
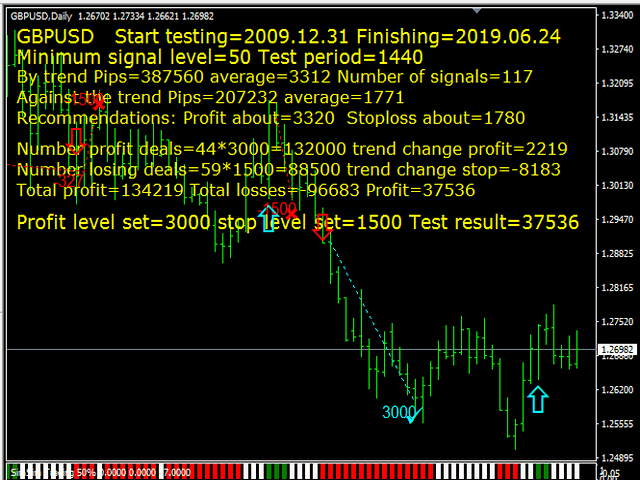
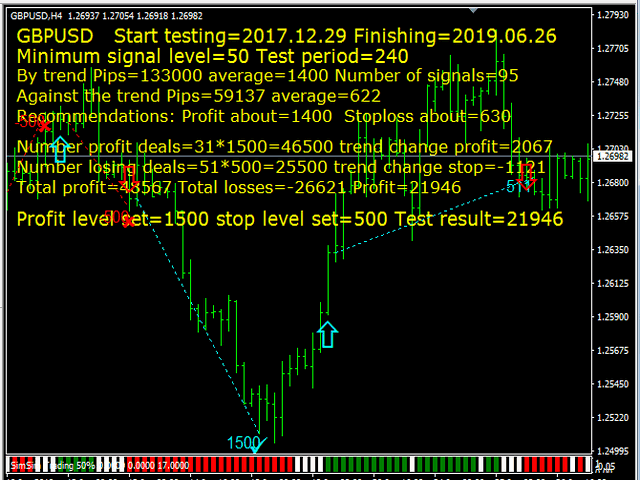
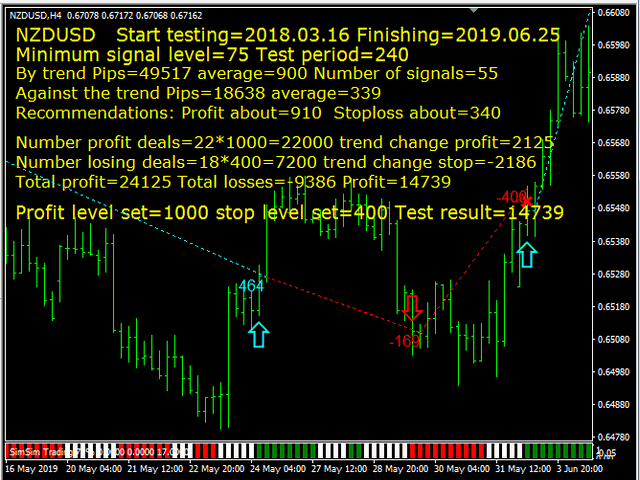
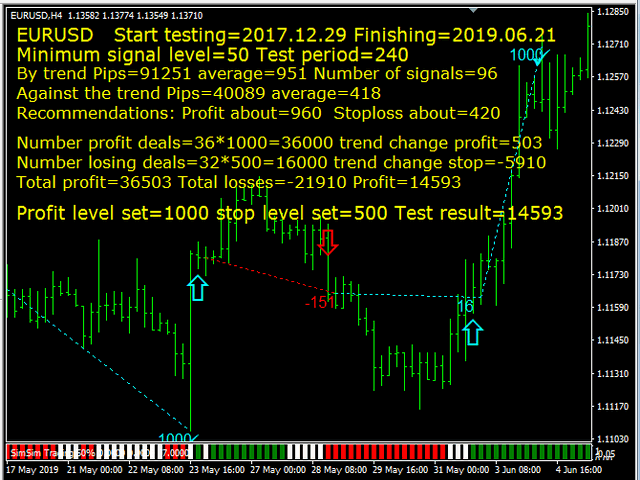
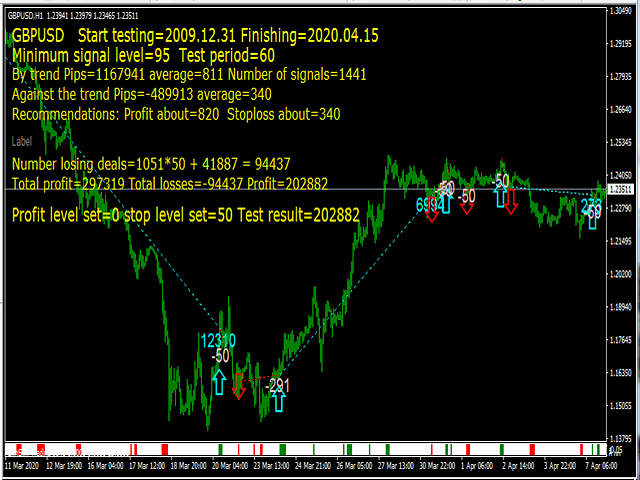
インジケーターは、デモ版をダウンロードしてテストできるテストシステムを実装しています。
インディケータはあなたのトレーディング戦略への良い追加となります。
試用版の最初の試用版-レンタルまたは購入!!!
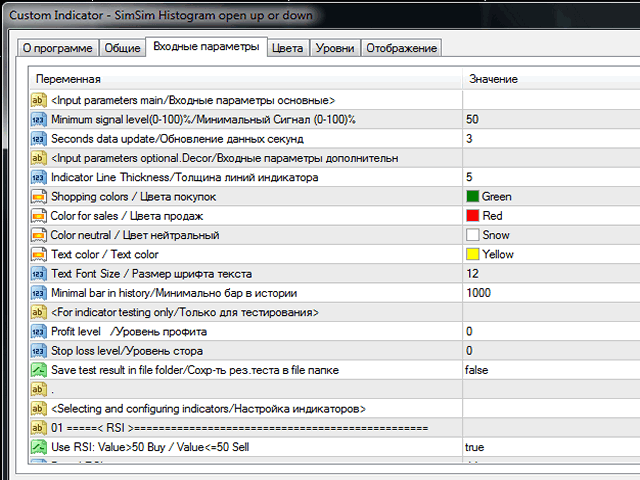
入力パラメータ
Seconds data update - 秒データ更新-
オプションの入力パラメーター
Shopping colors - ショッピングカラー-
Color for sales - 販売色-
Color neutral - ニュートラルカラー-
Text color - テキストの色 -
Text Font Size - テキストのフォントサイズ-
Minimal bar in history -歴史上最小のバー-
オンラインでの指標テスト用
Stop loss level - ストップロスレベル-
Save test result in file folder - テスト結果をファイルフォルダーに保存-
信号を計算するための標準インジケーターのパラメーター。 True-計算に参加し、False-参加しません。
No. 01 Use RSI:Value> 50 Buy / Value <= 50 Sell-指標値が50を超える場合-Buyシグナル、Sellシグナルが50以下の場合。
No. 03 Use CCI:Value> 0 Buy / Value <= 0 Sell-インジケーター値が0より大きい場合-Buyシグナル、Sellシグナルが0以下の場合。
No. 05 ADXを使用:PLUSDI> MINUSID Buy / PLUSDI <= MINUSID Sell-インジケーターラインがPLUSDI> MINUSIDの場合-PLUSDI <= MINUSID Sellシグナルの場合、シグナルを購入します。
。 。 。
No. 25 Use RVI:Value> 0 Buy / Value <= 0 Sell-インジケーター値が0より大きい場合-Buyシグナル、Sellシグナルが0以下の場合。