RoundNumber MT5
- インディケータ
- Mohamad Zulhairi Baba
- バージョン: 1.0
RoundNumbers indicator is a simple and powerful psychological price levels.
Trader usually use these levels as a Support and Resistance (SnR).
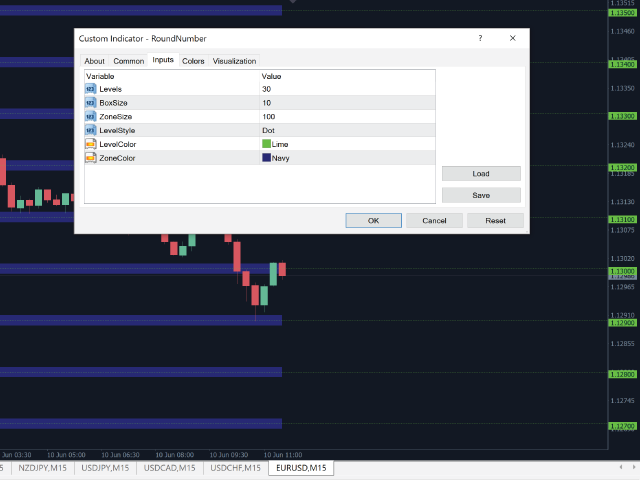
Indicator Input:
- Levels - Numbers of levels drawn on chart. Default 30 levels.
- BoxSize - Box size drawn on each levels, indicate buffers around levels. Default value 1pips (10point) above and below each levels.
- ZoneSize - Distance between each levels, default value 10pips (100point).
- Style & Colours - User inputs customization.
For MT4 version, please refer to this link https://www.mql5.com/en/market/product/39401
Excellent