Niubility Trend
Niubility Trend
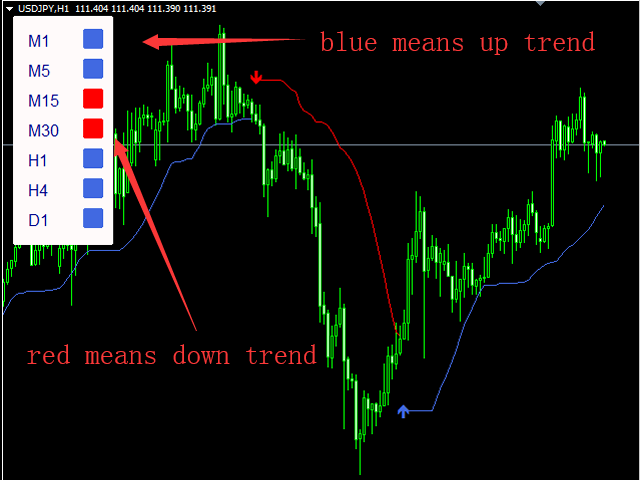
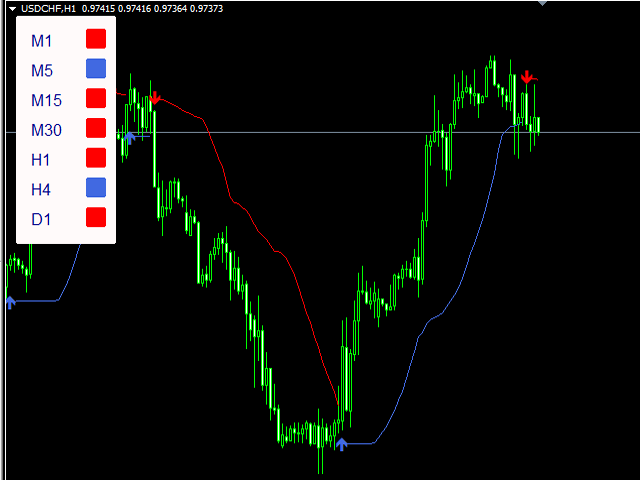
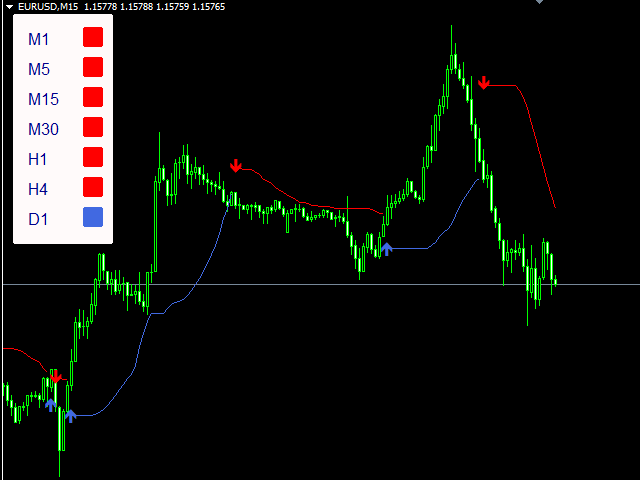
Niubility Trend displays the trend direction for all time frames in real time.
You'll see at a glance at which direction the trends are running, how long they last and how powerful they are.
All this makes it an easy-to-use trend trading system for beginners, advanced and professional traders.
Features
Easy to trade
Customizable colors and sizes
It is non-repainting and non-backpainting
It is fantastic as a trailing stop method
It implements alerts of all kinds