Clever Order Blocks
- インディケータ
- Carlos Forero
- バージョン: 1.59
- アップデート済み: 29 12月 2023
- アクティベーション: 5
Description
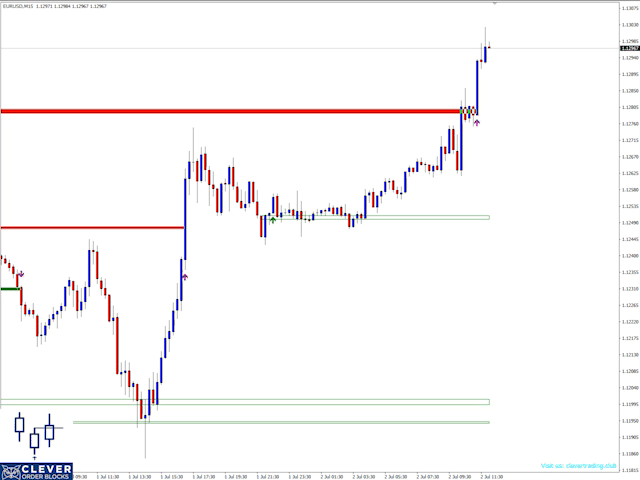
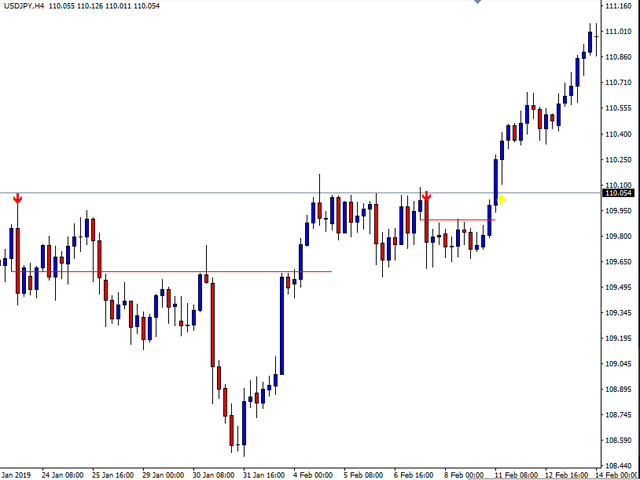
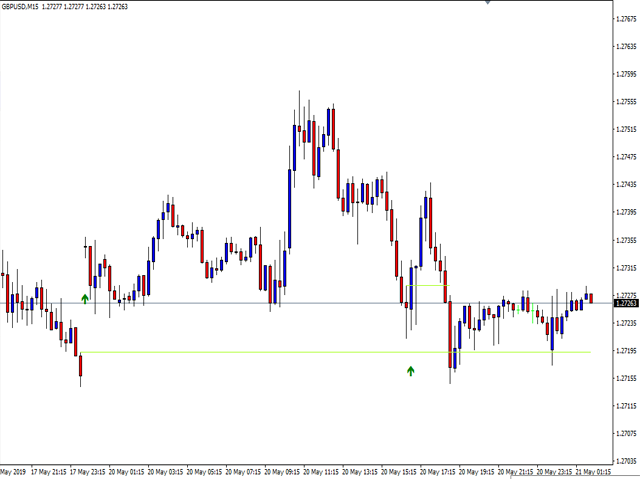
Very precise patterns to detect: entry signals as well as breakout, support and resistance reversal patterns. It points out zones in which, with a high probability, institutional orders with the potential to change the price’s direction and keep moving towards it, have been placed.
KEY LINKS: Indicator Manual – How to Install – Frequent Questions - All Products
How is this indicator useful?
- It will allow you to trade on the order’s direction, once its direction has been identified.
- It will allow you to trade retracement or breakout patterns, everytime they occur in a given zone.
- You’ll be able to identify potential resistance or support levels. Be mindful that you can use these levels as take profit zones.
- You’ll be able to combine this indicator with trend and market maker patterns. In order to identify these patterns.
Components
- Horizontal green lines: These represent bullish order blocks.
- Horizontal red lines: These represent bearish order blocks.
- Green, red Arrows: Bullish or Bearish signal of recent OB Formed
- Yellow Arrows: Bullish or Bearish signal of Breakout of OB.
About Author:
Carlos Forero, Member of Clever Trading Club, private organization with the purpose of design clever solutions to generate constant profits with adapted risk.

Good. Do not trade arrow to arrow as signals, use it along with your strategy.