• 概要
  • レビュー (23)
  • コメント (92)
  • 最新情報

Supply and Demand Dashboard PRO

4.82
現在20%OFF!

このダッシュボードは、複数のシンボルと最大9つのタイムフレームで動作するソフトウェアの非常に強力な部分です。
このソフトは、弊社のメインインジケーター(ベストレビュー:Advanced Supply Demand)をベースにしています。   Advanced Supply Demand

ダッシュボードは、素晴らしい概要を提供します。それは示しています。 
  1. ゾーン強度評価を含むフィルタリングされた需給値。
  2. ゾーン内/ゾーンへのPips距離。
  3. ネストされたゾーンがハイライトされます。
  4. 選択されたシンボルの4種類のアラートを全ての(9)時間枠で提供します。
  5. それはあなたの個人的なニーズに合わせて高度に設定可能です。


あなたの利益!


すべてのトレーダーにとって最も重要な質問です。

市場に参入するのに最適なレベルはどこか?
成功のチャンスとリスク/リターンを得るために、強力な供給/需要ゾーン内またはその近くで取引を開始します。


損切りの最適な位置はどこですか?
最も安全なのは、強力な供給/需要ゾーンの下/上にストップを置くことです。


最適な利益目標は?
出口戦略はエントリーと同様に重要であり、より高い時間枠の画像を知ることはこの点で役に立ちます。買いの場合は次の供給ゾーンをターゲットに、売りの場合は次の需要ゾーンをターゲットにします。高い時間枠の需給に十分な利幅の余地があることを確認するために、需給のプルバックでエントリーすると、利益が増加します。


なぜ強いゾーンと弱いゾーンをフィルタリングするのか?
アンバランスが大きければ大きいほど、価格の動きも大きくなります。最も確率の高い価格水準は、買い手と売り手の間の不均衡が最も大きいものです。事前の警告もなく、その場で反転し、石のように落ちる-それが大きなアンバランスのあるエリアです。その価格で大量の売り手が市場に参入し、買い手を圧倒しているのです。また、突然の売りが出た場合、ちょうどその水準あたりでより多くの売り手が売りを待っていた可能性が高いのです。


重要な情報が明らかになった。

需給のポテンシャルを最大限に引き出すには、ユーザーマニュアルをご覧ください。    https://www.mql5.com/en/blogs/post/725584

需給取引に慣れていない方は、こちらのブログもお読みください。   blog

上級者向けの機能として、4つの特別なアラートがあります。
  • 新しいゾーンが出現しました。
  • 価格がゾーンに入った。
  • 価格がゾーンを離れました。
  • ゾーンが破壊された。


必要であれば、ネストされたゾーンのみに対してすべてのアラートをフィルタリングすることができます。
アラートされる時間枠を選択することができます。
アラートの対象からシンボルを除外することができます。


ダッシュボード上の視覚的な機能。
供給と需要の価格。(上段から下段へ:供給上限価格/供給下限価格/需要上限価格/需要下限価格)。
供給と需要までのピップス距離。価格がゾーンから遠い場合、緑色に表示されます。
需給の範囲内でPipsの距離。ピンクと太字は、価格がゾーンに入った場合です。(外側の価格までのpips / 内側の価格までのpips)
特別なゾーンの強さの評価。黄色の数字は、最小強度に達した場合。
新規またはテスト中:ゾーンがまだテストされていない、または新規の場合、価格に「N」が追加されます。
ネスティッド: ゾーンが上位の時間枠のゾーンにネストしている場合、背景がハイライトされる。
ネステッド・アンド・ニュー: 需要と供給のための価格が太字で表示されます。


チャート上の視覚的な機能。


ダッシュボードのサブウィンドウをマウスで下にドラッグするだけで、実際のチャートが表示されます。シンボル名をクリックすると、シンボルが変更されます。
ダッシュボードに表示されている全ての時間枠がチャートに表示されます。
チャートより下位のタイムフレームは破線の四角形で表示されます。
チャートの実際のタイムフレームは四角で表示されます。
チャートより上位のタイムフレームは空白の四角で表示されます。
時間枠が高いほど、四角の端が右に寄っています。
カラーコードは、そのゾーンが新しいかテストされているかを示します。
価格はチャート上に表示することも、しないことも可能です。


価格はチャート上に表示することも、表示しないことも可能です。    https://www.mql5.com/en/blogs/post/725584


ストラテジーテスター
ご注意ください。マルチシンボル、マルチタイムフレームダッシュボードであるため、ストラテジーテスターでデモを動作させるには特別な設定が必要です。また、チャートデータの引用を準備する必要があります。プライベートメッセージを送ってください。(同じように動作するAdvanced Supply Demandのデモを代わりに試すこともできます。)


ヒント


ユーザーマニュアルをお読みください。ここをクリックしてください。    https://www.mql5.com/en/blogs/post/725584
特別です。MT4チャート履歴を更新するために、1つのサポートチャートが開かれます。この機能は無効にすることができます。
取引システムと取引例については、プロフィールの私のニュースやブログをチェックしてください。
インジケーターを手に入れたら、より多くの情報、リンク、テンプレートなどが入ったスターターパックメール(マニュアル)をリクエストしてください。私はあなたの成功を確認したい


自動的に翻訳されます 英語オリジナルはこちら https://www.mql5.com/en/market/product/37335


レビュー 20
MarcoEA
138
MarcoEA 2023.06.09 22:50 
 

hello, I bought two of your indicators. Sup and Dem and Dashboard of Sup and Demand. What are the bonuses?

Gabor Bocsak
2345
Gabor Bocsak 2023.05.23 18:42 
 

I really like the indicators! Actually i use 4 of them and they work really well together! I had a lot of questions as i use a bit different strategy.but i got all the help! Thank you!

Tyrena Booker
96
Tyrena Booker 2023.02.01 19:59 
 

The indicator is phenomenal!!! This indicator help me to know when pullbacks are happening.I enjoy the enhance features of this indicator because you can add any symbols see the whole market within seconds. I use this indicator with Currency Strength Exotics on the chart and let just say you will be counting PIPS. Bernhard will help with your question and answer each one in punctual time. I highly recommend this indicator to anyone. I appreciated your help Bernhard!!!

おすすめのプロダクト
Binary Options Support Resistance Indicator This indicator is designed for binary options trading and effectively shows retracements from support and resistance levels. Signals appear on the current candle. A red arrow pointing downwards indicates a potential selling opportunity, while a blue arrow pointing upwards suggests buying opportunities. All that needs adjustment is the color of the signal arrows. It is recommended to use it on the M1-M5 timeframes as signals are frequent on these timef
Credible Cross System   indicator is designed for signal trading. This indicator generates trend signals. It uses many algorithms and indicators to generate this signal. It tries to generate a signal from the points with the highest trend potential. The indicator works based on instant price movements. This indicator is a complete trading product. This indicator does not need any additional indicators. The indicator certainly does not repaint. The point at which the signal is given does not
This   Rattling Signal Point   indicator is designed for signal trading. This indicator generates trend signals. It uses many algorithms and indicators to generate this signal. It tries to generate signals from the points with the highest trend potential. This indicator is a complete trading product. This indicator does not need any additional indicators. The indicator is never repainted. The point at which the signal is given does not change. When the signal comes the arrows are put back
This   Real Magic Trend   indicator is designed for signal trading. This indicator generates trend signals. It uses many algorithms and indicators to generate this signal. It tries to generate signals from the points with the highest trend potential. This indicator is a complete trading product. This indicator does not need any additional indicators. The indicator is never repainted. The point at which the signal is given does not change.      Features and Recommendations Time Frame
SuperTrend Alerts adds alerts to the widely popular SuperTrend indicator. As the name suggests, SuperTrend is a trending indicator which works best in trendy (not choppy) markets. SuperTrend is extremely popular for intraday and daily trading, and can be used on any timeframe. Place a call when the price closes above the SuperTrend line, and place a put when the price closes below the SuperTrend line. These crossovers are highlighted by non-repainting up/down arrows. Alerts Email, message and
The new update makes this indicator a complete tool for studying, analyzing and operating probabilistic patterns. It includes: On-chart Multi-asset percentage monitor. Configurable martingales. Twenty-one pre-configured patterns , including Mhi patterns and C3. An advanced pattern editor to store up to 5 custom patterns. Backtest mode to test results with loss reports. Trend filter. Hit operational filter. Martingale Cycles option. Various types of strategies and alerts. Confluence between patte
Real Pro Signal   indicator is designed for signal trading. This indicator generates trend signals. It uses many algorithms and indicators to generate this signal. It tries to generate a signal from the points with the highest trend potential. This indicator is a complete trading product. This indicator does not need any additional indicators. The indicator certainly does not repaint. The point at which the signal is given does not change.     Features and Suggestions Time Frame: H1 W
Signal Tower   indicator is designed for signal trading. This indicator generates trend signals. It uses many algorithms and indicators to generate this signal. It tries to generate a signal from the points with the highest trend potential. This indicator is a complete trading product. This indicator does not need any additional indicators. The indicator certainly does not repaint. The point at which the signal is given does not change. The indicator has a pips counter. You can see how
Pro Magic Signal   indicator is designed for signal trading. This indicator generates trend signals.  It uses many algorithms and indicators to generate this signal. It tries to generate a signal from the points with the highest trend potential. This indicator is a complete trading product. This indicator does not need any additional indicators.  The indicator certainly does not repaint. The point at which the signal is given does not change.  Thanks to the alert features you can get the signals
Great Strong System   indicator is designed for signal trading. This indicator generates trend signals. It uses many algorithms and indicators to generate this signal. It tries to generate a signal from the points with the highest trend potential. This indicator is a complete trading product. This indicator does not need any additional indicators. The indicator certainly does not repaint. The point at which the signal is given does not change.     Features and Suggestions Time Frame:
The   True Magic Oscillator   indicator is designed for signal trading. This indicator generates trend signals. It uses many algorithms and indicators to generate this signal. It tries to generate signals from the points with the highest trend potential. This indicator is a complete trading product. This indicator does not need any additional indicators. The indicator is never repainted. The point at which the signal is given does not change.         Features and Recommendations Wor
Gvs Undefeated Trend   indicator is designed for trend and signal trading. This indicator generates trend signals.  It uses many algorithms and indicators to generate this signal. It tries to generate a signal from the points with the highest trend potential. This indicator is a complete trading product. This indicator does not need any additional indicators.  You can only trade with this indicator. The generated signals are displayed on the graphical screen.  Thanks to the alert features you ca
Signal Undefeated   indicator is designed for trend and signal trading. This indicator generates trend signals.  It uses many algorithms and indicators to generate this signal. It tries to generate a signal from the points with the highest trend potential. This indicator is a complete trading product. This indicator does not need any additional indicators.  You can only trade with this indicator. The generated signals are displayed on the graphical screen.  Thanks to the alert features you can g
The indicator is designed to trade binary options on small time frames up to m 30 Signals The blue up arrow is a buy signal. The red dn arrow is a sell signal. The signal will appear together with the advent of a new candle  and during formation Signals on the current candle Expiration time one candle from the timeframe on which you are trading You can use moving average to filter out false signals. Or escort support levels. This tool is reliable in trading.
This is a Binary Options signal indicator. Extremely powerful for the 1 min chart. The signals are based on my personal tweak (based on real trial and error & backtested) of the RSI, ADX and Ichimoku and my observation on how price moves. It turns out, 2 candles expiry is the most consistent with this set up. How to use: 1. Wait for arrow signal to show. 2. Place a 2 candle expiry right after the close of the signal candle. So if you are trading a 1 min chart, place an expiry for 2 mins... if yo
This   Happy Trend Arrow   indicator is designed for signal trading. This indicator generates trend signals. It uses many algorithms and indicators to generate this signal. It tries to generate signals from the points with the highest trend potential. This indicator is a complete trading product. This indicator does not need any additional indicators. The indicator is never repainted. The point at which the signal is given does not change.       Features and Recommendations Time Fra
Entry Signal Arrows   indicator is designed for signal trading. This indicator generates trend signals.  It uses many algorithms and indicators to generate this signal. It tries to generate a signal from the points with the highest trend potential. This indicator is a complete trading product. This indicator does not need any additional indicators.  The indicator certainly does not repaint. The point at which the signal is given does not change.  Thanks to the alert features you can get the sign
Advanced Stochastic Scalper - is a professional indicator based on the popular Stochastic Oscillator. Advanced Stochastic Scalper is an oscillator with dynamic overbought and oversold levels, while in the standard Stochastic Oscillator, these levels are static and do not change. This allows Advanced Stochastic Scalper to adapt to the ever-changing market. When a buy or a sell signal appears, an arrow is drawn on the chart and an alert is triggered allowing you to open a position in a timely mann
Big Trend Signal   indicator is designed for trend and signal trading. This indicator generates trend signals.  It uses many algorithms and indicators to generate this signal. It tries to generate a signal from the points with the highest trend potential. This indicator is a complete trading product. This indicator does not need any additional indicators.  You can only trade with this indicator. The generated signals are displayed on the graphical screen.  Thanks to the alert features you can ge
ナイト ゴースト - バイナリ オプションの矢印インジケーター。 これからのあなたの頼もしいアシスタントです! 11 - チャートの再描画なし - すべての通貨ペアで大活躍! -インジケータの精度は最大 90% (特に夜間) ・長時間の設定不要(バイナリーオプションに最適な設定) - 信号が遅れない - 現在のローソク足でのシグナルの出現 ・M1期にピッタリ(No More!) ・目に優しいキャンドルカラー(赤・青) -インストールされたアラート それを扱う: - 青い矢印は信号アップを示します -赤い下向き矢印 M1 以上のインジケーターをチャートに配置しないでください. シグナルの精度が低下します! インジケーターのスクリーンショットとビデオを見る
This indicator is customized for binary option trading like M1 timeframe or turbo option trading. The way a binary option works is from the traders perspective is that you choose whether or not a certain underlying asset (a stock, commodity, currency etc.) is going to go up or down in a certain amount of time. You essentially bet money on this prediction. You are shown how much money up front you will earn if your prediction is correct. If your prediction is wrong, you lose your bet and the mone
The indicator is designed for binary options and short-term transactions on Forex To enter a trade when a signal appears blue up arrow buy red down arrow sell signal For Forex enter on a signal exit on the opposite signal or take profit For binary options Enter on 1 candle, if the deal goes negative, set a catch on the next candle Works on all timeframes If you apply a filter like Rsi, you will get a good reliable strategy.. The algorithm is at the stage of improvement and will be further develo
indicator for trading binary options and forex trading. The indicator does not redraw the readings. when trading binary options, testing was performed. This indicator showed the good results correct predictions. Under these conditions, the eur / usd m1 chart, when a signal appears, the transaction opens in the direction indicated by the indicator for 5 candles, then the truth is (5 minutes since in us the 1-minute chart of a candlestick is 1 minute) the result was. When trading in the forex
VR Cub
Vladimir Pastushak
VR Cub は、質の高いエントリーポイントを獲得するためのインジケーターです。このインジケーターは、数学的計算を容易にし、ポジションへのエントリーポイントの検索を簡素化するために開発されました。このインジケーターが作成されたトレーディング戦略は、長年にわたってその有効性が証明されてきました。取引戦略のシンプルさはその大きな利点であり、初心者のトレーダーでもうまく取引することができます。 VR Cub はポジション開始ポイントとテイクプロフィットとストップロスのターゲットレベルを計算し、効率と使いやすさを大幅に向上させます。取引の簡単なルールを理解するには、以下の戦略を使用した取引のスクリーンショットを見てください。 設定、設定ファイル、デモ版、説明書、問題解決方法は、以下から入手できます。 [ブログ] レビューを読んだり書いたりすることができます。 [リンク] のバージョン [MetaTrader 5] エントリーポイントの計算ルール ポジションをオープンする エントリーポイントを計算するには、VR Cub ツールを最後の高値から最後の安値までストレッチする必要があります。
Beta Signal   - индикатор предназначенный для поиска локальных экстремумов, определения текущей тенденции. В расчетах индикатора используется авторская методика. С помощью индикатора можно определять места возможного разворота цены желательно в направлении тенденции, но также с достаточной точностью и против нее. Также с помощью индикатора можно определять текущую тенденцию. Индикатор подходит для любых валютных пар, но для адекватного отображения показания необходимо, чтобы было достаточно исто
Indicator for binary options arrow is easy to use and does not require configuration works on all currency pairs, cryptocurrencies buy signal blue up arrow sell signal red down arrow tips do not trade during news and 15-30 minutes before their release, as the market is too volatile and there is a lot of noise it is worth entering trades one or two candles from the current period (recommended for 1 candle) timeframe up to m 15 recommended money management fixed lot or fixed percentage of the depo
How to use Pair Trading Station Pair Trading Station is recommended for H1 time frame and you can use it for any currency pairs. To generate buy and sell signal, follow few steps below to apply Pair Trading Station to your MetaTrader terminal. When you load Pair Trading Station on your chart, Pair Trading station will assess available historical data in your MetaTrader platforms for each currency pair. On your chart, the amount of historical data available will be displayed for each currency pai
Super Magic Signal     indicator is designed for signal trading. This indicator generates trend signals. It uses many algorithms and indicators to generate this signal. It tries to generate a signal from the points with the highest trend potential. This indicator is a complete trading product. This indicator does not need any additional indicators. The indicator certainly does not repaint. The point at which the signal is given does not change.     Features and Suggestions Time Frame:
Trend PRO Expert Advisor  is developed base on the PipFinite Trend PRO Indicator, the best indicators on the market so far. PipFinite  Trend Pro's smart algorithm detects the trend, filters out market noise and gives entry signals with exit levels.  This EA open order when the indicator has buy/sell signals and set SL/TP follow the indicator rules. You can read more information about PipFinite Trend PRO indicator  here . Important Information   This EA will only work if you purchased  PipFin
[ZhiBiCCI]インディケータは全てのサイクル使用に適しており、そして全ての市場品種にも適しています。 [ZhiBiCCI]緑色の実線は強気の発散の逆転です。緑色の点線は古典的な強気の発散です。 [ZhiBiCCI]赤への実線は逆弱気の発散である。赤い点線は古典的な弱気の発散です。 [ZhiBiCCI]はパラメータ(アラート、メール送信、通知送信)で設定でき、(true)に設定するとインスタント信号をアラームウィンドウに送信し、Eメール、インスタントメッセージを送信できます。 パラメータ設定の説明 [displayAlert]:これはアラームスイッチで、trueに設定され、矢印が表示されればプロンプトに自動的に警告され、falseに設定されれば警告されません。 [sendmail_NO_OFF]:これはメールを送信するためのスイッチで、trueに設定します。矢印が表示されていればMT4で設定したメールボックスにメールを送信し、falseに設定されていればメールを送信しません。 [sendnotification_NO_OFF]:これはインスタントメッセー
このプロダクトを購入した人は以下も購入しています
Indicator : RealValueIndicator Description : RealValueIndicator is a powerful tool designed specifically for trading on the EURUSD pair. This indicator analyzes all EUR and USD pairs, calculates their real currency strength values, and displays them as a single realistic value to give you a head start on price. This indicator will tell you moves before they happen if you use it right. RealValueIndicator allows you to get a quick and accurate overview of the EURUSD currency pair tops and bottoms,
TrendMaestro
Stefano Frisetti
5 (3)
note: this indicator is for METATRADER4, if you want the version for METATRADER5 this is the link:  https://www.mql5.com/it/market/product/108106 TRENDMAESTRO ver 2.4 TRENDMAESTRO recognizes a new TREND in the bud, he never makes mistakes. The certainty of identifying a new TREND is priceless. DESCRIPTION TRENDMAESTRO identifies a new TREND in the bud, this indicator examines the volatility, volumes and momentum to identify the moment in which there is an explosion of one or more of these data a
NAM Order Blocks
NAM TECH GROUP, CORP.
5 (1)
MT4マルチタイムフレームオーダーブロック検出インジケーター。 特徴 -チャートコントロールパネルで完全にカスタマイズ可能で、完全な相互作用を提供します。 -必要な場所でコントロールパネルを表示および非表示にします。 -複数の時間枠でOBを検出します。 -表示するOBの数量を選択します。 -さまざまなOBユーザーインターフェイス。 -OBのさまざまなフィルター。 -OB近接アラート。 -ADRの高線と低線。 -通知サービス(画面アラート|プッシュ通知)。 概要 注文ブロックは、金融機関や銀行からの注文収集を示す市場行動です。著名な金融機関と中央銀行が外国為替市場を牽引しています。したがって、トレーダーは市場で何をしているのかを知る必要があります。市場が注文ブロックを構築するとき、それは投資決定のほとんどが行われる範囲のように動きます。 注文の構築が完了すると、市場は上向きと下向きの両方に向かって急激に動きます。注文ブロック取引戦略の重要な用語は、機関投資家が行っていることを含むことです。それらは主要な価格ドライバーであるため、機関投
Enigmera
Ivan Stefanov
5 (4)
エニグメラ:市場の中核 https://www.enigmera.com はじめに このインディケータと取引システムは、金融市場に対する驚くべきアプローチです。ENIGMERAは、フラクタルサイクルを使用して、サポートとレジスタンスレベルを正確に計算します。本格的な蓄積局面を示し、方向性と目標を示します。 トレンド中でも調整中でも機能するシステムです。 どのように作動するのか? ENIGMERAは、支持線・抵抗線、目標線、乖離線の3つのラインで構成されています。このシステムは、過去のデータを現在と未来に外挿する典型的な市場指標とは異なり、現在の完全な画像を提供します。支持線上にある場合、それは本当の支持を意味し、抵抗線上にある場合、それは本当の抵抗を意味する。ある水準が破られた場合、それはトレンドの変化を意味する。再描画はしない。 市場は常に進化しているため、ENIGMERAはその評価ツールを適応させ、定期的に戦略を修正しています。  これにより、すべてのシナリオが徹底的に評価されることが保証されます。この市場指標の独自性は、その能力を見れば明らかです。  ENIGM
ZeusArrow Smart Liquidity Finder  Smart Liquidity Finder is Ai controlled indicator based on the Idea of Your SL is My Entry. It scan and draws the major Liquidity areas on chart partitioning them with Premium and Discount Zone and allows you find the best possible trading setups and help you decide the perfect entry price to avoid getting your Stop Loss hunted . Now no more confusion about when to enter and where to enter. Benefit from this one of it's kind trading tool powered by Ai an trade
A. A2SR とは何ですか ?   * 先行テクニカル指標です (塗り直しなし、ラグなし)。 -- ガイダンス : -- https://www.mql5.com/en/blogs/post/734748/page4#comment_16532516 -- そして https://www.mql5.com/en/users/yohana/blog A2SR には、サポート (需要) とレジスタンス (供給) のレベルを決定する特別な手法があります。 ネットで見かける通常の方法とは異なり、A2SR は実際の SR レベルを決定する独自のコンセプトを持っています。 元の手法はインターネットから取得されたものではなく、インターネット上で公開されたこともありません。 A2SR は、取引スタイルに応じて SR レベルを自動選択します。 時間枠を変更しても、SR レベルはその位置にとどまります。 実際のSRは、使用する時間枠から取得されるわけではないため. A2SR には、取引のための完全な手段があります 。 実際のサポート (需要) とレジスタンス (供給) の真のコンセプト。
️️ Attention:      The price will soon be raised to what it was before ($500).      No more losses with this indicator, test it for years ago and see if there is losses in one day results. but before testing it please see the explaining video down here.    FxBears Powers is working on all forex pairs, metals, commodities, futures, indices, energies, crypto, and everything...and on all timeframes from M1 to MN.   It's based on supply and demand zones, price action, and some internal indicators,
もちろんです。以下は、提供いただいたテキストの日本語への翻訳です: MT4用の天文学指標をご紹介します:究極の天体トレーディングコンパニオン トレーディング体験を天空の高みに高める準備はできていますか?私たちの革命的なMT4用の天文学指標をご紹介します。この革新的なツールは、複雑なアルゴリズムの力を借りて、類まれなる天文学的洞察と精密な計算を提供します。 あなたの指先で宇宙の情報を: 宝のような天文学的データが明らかになる包括的なパネルをご覧ください。惑星の地理的/太陽中心座標、太陽と地球の距離、星の大きさ、伸び、星座、黄道座標および赤道座標、さらには水平座標まで、それぞれが綿密に計算され美しく表示されています。指標によって生成される垂直線は時間値に対応し、トレーディングの旅に宇宙の視点を提供します。 惑星のラインと関係: グラフを飾る惑星のラインの魔法を体験し、スケールと角度をカスタマイズできます。直感的なコントロールパネルを介して各惑星のラインの表示を簡単に切り替えることができます。指定された時刻範囲内での合会、六分会、四分会、三分会、対会、逆行の指標で天体の関係の芸術を発見してく
Gold Channel is a volatility-based indicator, developed with a specific timing algorithm for the XAUUSD pair, which consists of finding possible corrections in the market. This indicator shows two outer lines, an inner line (retracement line) and an arrow sign, where the theory of the channel is to help identify overbought and oversold conditions in the market. The market price will generally fall between the boundaries of the channel. If prices touch or move outside the channel it is a tra
Please send me Direct message on MQL5 CHAT after purchasing the Indicator for Training and Installation Support There are some additional files that is important to use with the Indicator . So be sure to contact me after purchasing the Indicator So that I can add you for training and support . If you find any difficulty with installation then send me Direct message here So that I can connect with you via Anydesk or Teamview for the product installation. " Smart Order Block Indicator " to find
The indicator " ZigZag on Trend " is an assistant in determining the direction of price movement, as well as a calculator of bars and points. It consists of a trend indicator, which follows the price direction by the trend line presented in the form of a zigzag and a counter calculating the number of bars traversed in the direction of the trend and the number of points on the vertical scale. (calculations are carried out by the opening of the bar) The indicator does not redraw. For convenience,
ECM Elite Channel is a volatility-based indicator, developed with a specific time algorithm, which consists of finding possible corrections in the market. This indicator shows two outer lines, an inner line (retracement line) and an arrow sign, where the channel theory is to help identify overbought and oversold conditions in the market. The market price will generally fall between the boundaries of the channel. If prices touch or move outside the channel, it's a trading opportunity. The
Gann Signal is a very simple indicator at first glance, but hidden inside is many years of experience in studying W.D.Ganna methods. The indicator gives accurate BUY/SELL signals, without redrawing. The indicator is very easy to use. All you need to do is attach it to your chart and follow its recommendations. The indicator constantly analyzes the market for entry opportunities. When such an opportunity appears, the indicator gives a signal in the form of an arrow. I repeat, all signals are NOT
驚異的なFXインジケーター「Miraculous」をご紹介します。完璧な結果を得るための1時間足を含むすべてのタイムフレームで効果的に機能する、最強の強力な特殊MT4フォレックスインジケーターです。 すべてのタイムフレームで優れた結果を提供する最高のFXインジケーターを探し続けるのに疲れましたか?これ以上探す必要はありません!「Miraculous」フォレックスインジケーターをご紹介します。このインジケーターは、トレーディングの経験を変革し、収益を新たなレベルに引き上げるために設計されました。 先進のテクノロジーと長年にわたる緻密な開発に基づいて構築された「Miraculous」フォレックスインジケーターは、FX市場における力と正確さの頂点となります。この素晴らしいツールは、すべてのレベルのトレーダーのニーズを満たすように設計されており、一貫した収益性を追求する上で比類のない優位性を提供します。 「Miraculous」フォレックスインジケーターの他との違いは、その非常に適応性にあります。デイトレーダー、スウィングトレーダーであろうと、長期ポジションを好む方であろうと、このインジケータ
この指標は、W.D。Gannが書いた「市場予測の数式」​​の記事に基づく市場分析手法であり、9の2乗と144の2乗に依存しています。 ユーザーマニュアル: Add Your review And contact us to get it MT5のフルバージョンは次の場所から購入できます。 https://www.mql5.com/en/market/product/28669 あなたは無料でMT4でテストすることができます: https://www.mql5.com/en/market/product/15320?source=Site +Profile+Seller#!tab=reviews この製品は、レベル/スター/グリッド/ガンファン/として9の正方形を描くことができます。 ガンスクエアも描画します:52/90/144。 チャート上で直接移動可能なフリーガンスターを描画します。 また、ガンダイヤモンドを描画します。 それはあなたがあなたのエントリーのために最高のロットを計算することができるようにするロット計算機を持っ
3 Indicators in 1 indicator Strategy based on price action Made specifically for the best forex currency pairs Can be used in the best time frame of the market at a very reasonable price This indicator is basically 3 different indicatos . But we have combined these 3 indicators in 1 indicator so that you can use 3 indicators at the lowest price. All three strategies are based on price action. But based on different trends. Long term, medium term and short term Attributes : No repaintin
Introduction to X3 Chart Pattern Scanner X3 Cherart Pattern Scanner is the non-repainting and non-lagging indicator detecting X3 chart patterns including Harmonic pattern, Elliott Wave pattern, X3 patterns, and Japanese Candlestick patterns. Historical patterns match with signal patterns. Hence, you can readily develop the solid trading strategy in your chart. More importantly, this superb pattern scanner can detect the optimal pattern of its kind. In addition, you can switch on and off individu
Max Payneは、矢印の形でシグナルを与える反転/トレンドシグナルインジケーターです。このインジケーターは、同じバーの終値でシグナルを出します。このインジケーターは、異なる期間でチャート上に複数回ドロップして、シグナルの2倍/3倍の確認を取得できます。 このインジケーターは、あらゆる取引スタイルに合わせて高度に調整できますが、再描画やバックペイントは一切行われません。購入後には、使用したテンプレートとともにスクリーンショットに表示される完全なシステムが表示されます。 ----------------- 取引方法: トレンドフィルター(購入後に得られるペイントレンド)が方向に一致している間、同じバーでトリプル確認が得られるまで待ちます 取引を開始し、買い取引の場合は金色の矢印 (テンプレート) より下、売り取引の場合は金色の矢印 (テンプレート) より上にストップロスを設定します。終了シグナルは最初の反対側の白い点のシグナル (テンプレート) です。 ----------------- パラメーター : 信号周期:矢印周期 フィルター: 信号フィルター 距離 : ローソクからの矢印
SNR LEVEL INDICATOR Accurate Snr level indicator will only display Fresh Levels that are close to the Current Market Price. This indicator is very accurate in mapping Support & resistance levels. there is an alert feature when the price TOUCHES the SNR LEVEL, WHEN CLOSE CANDLE BREAK/REJECT SNR LEVEL. INDICATOR MARKING : - SUPPORT LEVEL = V SHAPE - RESISTANCE LEVEL = APEX LEVEL - GAP RESISTANCE & GAP SUPPORT = OPEN CLOSE CANDLE - SUPPORT BECAME RESISTANCE & RESISTANCE BECAME SUPPORT INDICATOR
ON Trade Waves Patterns Harmonic Elliot Wolfeをご紹介します。これは手動および自動の方法を使用して市場のさまざまなパターンを検出するために設計された高度なインジケーターです。以下はその動作方法です: ハーモニックパターン: このインジケーターは、チャートに表示されるハーモニックパターンを識別できます。これらのパターンは、Scott Carneyの「Harmonic Trading vol 1および2」で説明されているように、ハーモニックトレーディング理論を実践するトレーダーにとって重要です。手動で描画するか、自動検出に頼るかにかかわらず、ON Trade Waves Patternsがお手伝いします。 コントロールパネル: このインジケーターはユーザーフレンドリーなコントロールパネルを備えています。チャートと時間枠の設定を保存し、異なる構成間をスムーズに切り替えることができます。チャートスペースを最大限に活用するために最小化することもできます。他の分析ツールで作業することを好む場合、閉じるボタンをクリックするだけで、すべてのインジケーターデ
Introduction Excessive Momentum Indicator is the momentum indicator to measure the excessive momentum directly from raw price series. Hence, this is an extended price action and pattern trading. Excessive Momentum Indicator was originally developed by Young Ho Seo. This indicator demonstrates the concept of Equilibrium Fractal Wave and Practical Application at the same time. Excessive Momentum detects the market anomaly. Excessive momentum will give us a lot of clue about potential reversal and
Limitless MT4は、すべての初心者と経験豊富なトレーダーに適したユニバーサルインジケーターです。 すべての通貨ペア、暗号通貨、生の株式で動作します 無制限のMT4-構成済みで、追加の構成は不要 そして今、主なもの なぜ無制限のMT4なのか? 1再描画の完全な欠如 2トレーディングの最高のスペシャリストによる2年間のテスト 3正しい信号の精度が80%を超える 4ニュースリリース中の取引で好調 取引ルール 1買いシグナル-青い上向き矢印の出現 下向きの赤い矢印の外観を販売するシグナル シグナル後の次のローソク足で取引を開始するには2 3テイクプロフィット チャート上 М1-40ピップ М5-50ピップ М15-55-60ピップ 4ストップロスは利益をとる 5誤った信号をフィルタリングするために、 パラボリックSAR-トレンドとのトレードへの参入を除外する移動平均または同様のトレンドインジケーター。 
Vega indicator The indicator is created for M1. Rare and safe signals. Success! Notă Dacă indicatorul nu este afișat, adăugați indicatorul TMA+CG mladen NRP în folderul Indicatori. Îl puteți descărca de pe linkul https://forex-station.com/app.php/attach/file/3311524 Dar lăsați-l să fie la prima descărcare. Apoi atașați indicatorul Vega la diagramă. IMPORTANT! Verificați mai întâi indicatorul sau expertul pe un cont DEMO, înainte de a-l cumpăra! Analizați-l bine! Închiriați-l
Indicator fantastic Bună ziua! Indicatorul fantastic funcționează cel mai bine pe M5, M15, M1. Rezultatele sunt fantastice. Pe perioade mai lungi de timp, semnalele sunt corecte, dar sunt rare. Marcatorul nu revopsește. Recomand un TPmin. = 5, 10 sâmburi pentru M5. Acest indicator are potențialul de a declanșa tranzacții mult mai lungi. Experimentează-l! Noroc! Note If the indicator is not displayed, add the TMA+CG mladen NRP and Traders_Dynamic_Index III indicators to the Ind
Semnal H1 Studiați indicatorul de semnal H1. Rezultate foarte bune. Este creat pentru gama H1. Succes! Note If the indicator is not displayed, add the Drake Delay Stochastic and TMA+CG mladen NRP indicators to the Indicators folder. You can download TMA+CG mladen NRP from the link https://forex-station.com/app.php/attach/file/3311524 And the Drake Delay Stochastic indicator, from the link https://forex-station.com/app.php/attach/file/3322414 But let them be on the first download.
トレンドトレーディング は、タイミングのプルバックとブレイクアウトにより、市場で起こっているトレンドから可能な限り利益を得るように設計された指標です。確立されたトレンドの中で価格が何をしているかを分析することにより、取引の機会を見つけます。 [ インストールガイド | 更新ガイド | トラブルシューティング | よくある質問 | すべての製品 ] 自信を持って効率的に金融市場を取引する むち打ちにならずに確立されたトレンドから利益を得る 収益性の高いプルバック、ブレイクアウト、早期の逆転を認識する この指標は、独自の品質とパフォーマンスを分析します 複数時間枠のダッシュボードを実装します インジケーターは再描画されていません 電子メール/音声/視覚アラートを実装します 確立されたトレンドは多くの取引機会を提供しますが、ほとんどのトレンド指標はそれらを完全に無視しています。インジケーターの解釈はかなり簡単です: (1) トレンドの変化 (2) トレンドの方向への後退 (3) トレンドの方向へのブレイクアウト 赤いダッシュ は下降トレンド中の修正です 青いダッシュ は上昇ト
このインジケータは、手動および自動的な方法でチャートに描かれたハーモニックパターンを検出します。ユーザーマニュアルは、このリンクから参照できます: あなたのレビューを追加し、入手するために私たちに連絡してください。 この製品をmt4で試すための無料版があります。 GartleyおよびNenstarパターンを検出するために使用できます。 https://www.mql5.com/en/market/product/30181 完全なMT4バージョンを購入するには、次の場所から購入できます。 https://www.mql5.com/en/market/product/15212 注 インジケータにはコントロールパネルがあり、すべての(チャート&時間枠)設定が保存されます。チャート上でスペースをより多く確保するために、最小化することができ、他の分析ツールで作業する場合は、すべてのインジケータデータを非表示にするために閉じるボタンを押すことができます。 このインジケータを使用して設定を変更し、移動平均やボリンジャーバンドなどのインジケータを追加すると、編集のテンプレートが自動的に保存され、必
スイングトレーディング は、トレンドの方向のスイングと可能な反転スイングを検出するように設計された最初のインジケーターです。トレーディングの文献で広く説明されているベースラインスイングトレーディングアプローチを使用します。インディケータは、いくつかの価格と時間のベクトルを調査して、全体的なトレンドの方向を追跡し、市場が売られ過ぎまたは買われ過ぎて修正の準備ができている状況を検出します。 [ インストールガイド | 更新ガイド | トラブルシューティング | よくある質問 | すべての製品 ] むち打ちを起こさずに市場スイングの利益 インジケーターは常にトレンドの方向を表示します 色付きの価格帯は機会のベースラインを表します 色付きのダッシュは、可能な反転スイングを表します この指標は、独自の品質とパフォーマンスを分析します 複数時間枠のダッシュボードを実装します カスタマイズ可能なトレンドおよびスイング期間 電子メール/サウンド/プッシュアラートを実装します インジケータは再描画またはバックペインティングではありません Swing Tradingとは Swing Tradi
Currently Price 20% OFF ( for unlimited use )   BONUS  AUX VIP Club 2024 : Include  EA Airbag  and  Load Data History  to enhance the performance of this tool to its maximum potential  Click Here to Download Files   ( for users only )   Hello World! Introducing.. SMCpro VIP tool and Indicator for MetaTrader 4, designed to revolutionize your trading experience with the ICT Smart Money Concept. This system is meticulously crafted to empower traders with advanced insights and precision in
フルSTOインジケータ(3つのSTOインジケータのすべてのバージョンを含む:プレミアム、ゴールド、シルバー) - STABLE TRADE OPTIONは、自動バイナリーオプション取引のために設計されています。 注意深くお読みください! 重要 1つのターミナルで、異なる有効期限を持つ2つのテンプレートを作成します。18:01、18:02のテンプレートは有効期限が1~15分、22:00のテンプレートは有効期限が10~20分です。 勝率:過去5年間で71 資金管理: 預金から0.3 このバージョンのインジケータは、モスクワ時間18:01、18:02、22:00の取引にのみ設定され、有効期限は銀と金が1~15分、プレミアムバージョンは10~20分です。シグナルはローソク足の内側に表示され、すぐに取引を開始します。 インジケータは完全に設定されているので、自分で何かを変更する必要はありません。インストールして取引してください! 実際の口座でstoの全バージョンをチェックし、結果を確認するのに2年以上かかりました。長年のテストの結果、最適なパラメータが選択さ
作者のその他のプロダクト
現在20%OFF! 初心者やエキスパートトレーダーのためのベストソリューション! このダッシュボードソフトウェアは、28の通貨ペアで動作しています。それは私達の主要な指標(高度な通貨の強さ28と高度な通貨インパルス)の2に基づいています。それは全体の外国為替市場の大きい概観を与えます。それは、すべての(9)時間枠で28の外国為替ペアのための高度な通貨の強さの値、通貨の動きの速度と信号を示しています。チャート上で1つのインディケータを使用して市場全体を観察し、トレンドやスキャルピングの機会をピンポイントで見つけることができたら、あなたのトレードがどのように改善されるか想像してみてください。 このインディケータには、強い通貨と弱い通貨の識別、潜在的な取引の識別と確認がより簡単になるような機能が搭載されています。このインディケータは、通貨の強さや弱さが増加しているか減少しているか、また、すべての時間枠でどのように機能しているかをグラフィカルに表示します。 新機能として、現在の市場環境の変化に適応するダイナミックなマーケットフィボナッチレベルが追加され、すでに当社のAdvan
現在26%オフ 初心者やエキスパートトレーダーに最適なソリューション! このインジケーターは、独自の機能と新しい計算式を取り入れた、ユニークで高品質、かつ手頃な価格のトレーディングツールです。たった1枚のチャートで28の為替ペアの通貨強度を読み取ることができます。新しいトレンドやスキャルピングチャンスの引き金となるポイントを正確に特定することができるので、あなたのトレードがどのように改善されるか想像してみてください。 ユーザーマニュアルはこちら  https://www.mql5.com/en/blogs/post/697384 これが最初の1本、オリジナルだ! 価値のないクローンを買わないでください。 特別な サブウィンドウの矢印で強い通貨の勢いを表示 GAPがあなたのトレードを導く! 基準通貨や気配値が売られすぎ・買われすぎのゾーン(外相フィボナッチレベル)にあるとき、個別チャートのメインウィンドウに警告表示。 通貨がレンジの外側から反落した場合、プルバック/リバーサルのアラート。 クロスパターンの特別なアラート 複数の時間枠を選択可能で、トレンドを素早く
Advanced Supply Demand
Bernhard Schweigert
4.92 (313)
現在33%オフ 初心者にもエキスパートトレーダーにも最適なソリューション このインジケーターは独自の機能と新しい公式を多数内蔵しており、ユニークで高品質かつ手頃な取引ツールです。このアップデートでは、2つの時間枠ゾーンを表示できるようになります。より長いTFだけでなく、チャートTFとより長いTF(ネストゾーンを表示)の両方を表示できます。すべてのSupply Demandトレーダーの皆さんのお気に召すはずです。:) 重要情報の公開 Advanced Supply Demandの可能性を最大化するには、 https://www.mql5.com/ja/blogs/post/720245 にアクセスしてください。   エントリーまたはターゲットの正確なトリガーポイントを正確に特定できれば取引がどのように改善されるか想像してみてください。新しい基盤となるアルゴリズムに基づいて構築されているため、買い手と売り手の間の潜在的な不均衡をさらに簡単に特定できます。これは、最も強い需要と供給のゾーンと、過去のパフォーマンス(古いゾーンを表示)がグラフィカルに表現されるためです。これらの機能は、最適
現在31%オフ! 初心者やエキスパートトレーダーに最適なソリューション! このインジケータは、独自の機能と秘密の数式を組み込んだ、ユニークで高品質かつ手頃な価格のトレーディングツールです。たった1枚のチャートで28の通貨ペアのアラートを表示します。新しいトレンドやスキャルピングチャンスの引き金となるポイントを正確に把握することができるので、あなたのトレードがどのように改善されるか想像してみてください! 新しい基本的なアルゴリズムに基づいて構築されているため、潜在的な取引の特定と確認がより簡単になります。これは、通貨の強さや弱さが加速しているかどうかをグラフィカルに表示し、その加速のスピードを測定するためです。加速すると物事は明らかに速く進みますが、これはFX市場でも同じです。つまり、反対方向に加速している通貨をペアにすれば、利益を生む可能性のある取引を特定することができるのです。 通貨の勢いを示す縦の線と矢印は、あなたの取引の指針となるでしょう。 ダイナミックマーケットフィボナッチ23レベルはアラートトリガーとして使用され、市場の動きに適応します。もしインパルスが黄色
このインディケータは、当社の2つの製品 Advanced Currency IMPULSE with ALERT  +   Currency Strength Exotics . のスーパーコンビネーションです。 このインジケーターは全ての時間枠で作動し、8つの主要通貨と1つのシンボルの強弱のインパルスをグラフで表示します。 このインジケータは、金、エキゾチックペア、商品、インデックス、先物など、あらゆるシンボルの通貨強度の加速度を表示することに特化されています。金、銀、原油、DAX、US30、MXN、TRY、CNHなどの通貨強度の加速度(インパルスまたは速度)を表示するために、任意のシンボルを9行目に追加できる、この種の最初のものです。 新しいアルゴリズムに基づいて構築され、潜在的な取引の特定と確認がさらに容易になりました。これは、通貨の強さや弱さが加速しているかどうかをグラフィカルに表示し、その加速の速度を測定するためです。加速すると物事は明らかに速く進みますが、これはFX市場でも同じです。つまり、反対方向に加速している通貨をペアリングすれば、潜在的に利益を生む取
現在20%OFF! 初心者やエキスパートトレーダーに最適なソリューションです。 このインディケータは、エキゾチックペア・コモディティ・インデックス・先物など、あらゆるシンボルの通貨の強さを表示することに特化したインディケータです。金、銀、原油、DAX、US30、MXN、TRY、CNHなどの通貨の強さを表示するために、9行目にどのシンボルでも追加することができます。独自の機能を多数搭載し、新しい計算式を採用したため、ユニークで高品質、かつ手頃な価格のトレーディングツールとなっています。新しいトレンドやスキャルピングチャンスのトリガーポイントを正確に把握することができるため、あなたのトレードがどのように改善されるか想像してみてください。 ユーザーマニュアル:ここをクリック   https://www.mql5.com/en/blogs/post/708876 すべての時間枠に対応します。あなたはすぐにトレンドを見ることができるようになります! 新しいアルゴリズムに基づいて設計されているため、潜在的な取引の特定と確認がより簡単になります。これは、8つの主要通貨と1つのシンボ
初心者やエキスパートトレーダーに最適なソリューション! このインジケーターは、独自の機能と新しい計算式を取り入れた、ユニークで高品質、かつ手頃な価格のトレーディングツールです。たった1枚のチャートで28の為替ペアの通貨強度を読み取ることができます。新しいトレンドやスキャルピングチャンスの引き金となるポイントを正確に特定することができるので、あなたのトレードがどのように改善されるか想像してみてください。 ユーザーマニュアルはこちら  https://www.mql5.com/en/blogs/post/697384 これが最初の1本、オリジナルだ! 価値のないクローンを買わないでください。 特別な サブウィンドウの矢印で強い通貨の勢いを表示 GAPがあなたのトレードを導く! 基準通貨や気配値が売られすぎ・買われすぎのゾーン(外相フィボナッチレベル)にあるとき、個別チャートのメインウィンドウに警告表示。 通貨がレンジの外側から反落した場合、プルバック/リバーサルのアラート。 クロスパターンの特別なアラート 複数の時間枠を選択可能で、トレンドを素早く確認できます。通貨強
初心者やエキスパートトレーダーに最適なソリューション! このインジケータは、独自の機能と秘密の数式を組み込んだ、ユニークで高品質かつ手頃な価格のトレーディングツールです。たった1枚のチャートで28の通貨ペアのアラートを表示します。新しいトレンドやスキャルピングチャンスの引き金となるポイントを正確に把握することができるので、あなたのトレードがどのように改善されるか想像してみてください! 新しい基本的なアルゴリズムに基づいて構築されているため、潜在的な取引の特定と確認がより簡単になります。これは、通貨の強さや弱さが加速しているかどうかをグラフィカルに表示し、その加速のスピードを測定するためです。加速すると物事は明らかに速く進みますが、これはFX市場でも同じです。つまり、反対方向に加速している通貨をペアにすれば、利益を生む可能性のある取引を特定することができるのです。 通貨の勢いを示す縦の線と矢印は、あなたの取引の指針となるでしょう。 ダイナミックマーケットフィボナッチ23レベルはアラートトリガーとして使用され、市場の動きに適応します。もしインパルスが黄色のトリガーラインに当た
現在20%OFF! 初心者やエキスパートトレーダーに最適なソリューションです。 このインジケータは、新しいフォーミュラとともに多くの独自の機能を組み込んでいるため、手頃な価格のトレーディングツールとなっています。 アドバンスド・アキュムレーテッド・カレンシー・ボリューム・インディケーターは、主要28通貨ペアに特化し、すべての時間枠で機能します。1つのチャート上でAUD, CAD, CHF, EUR, GBP, JPY, NZD, USDのすべての通貨ボリューム(C-Volume)を抽出する新しい計算式です。これは、トレードにおいて大きなアドバンテージとなります。ボリュームトレーダーはその使い方を知っているはずです。もしあなたが初心者なら、極端な値を読む方法を学び、あなたの取引の武器に加えましょう。 C-Volumeを銃としてではなく、盾として考えてください。 メインチャートに警告サインが表示され、間違った取引に入ることを警告してくれます。 これは、一般的に使用されているペアの単純なVolumeではありません。外国為替市場をスキャンし、各通貨の出来高を抽出し、C
My Trades in Pips
Bernhard Schweigert
4.71 (24)
見逃せないトレーディングツールです。このインジケータは、チャート上のすべてのトレード/ディールを、そのシンボルが付いている状態で表示します。利益または損失が何ピップスかを表示します。選択により、より良い分析のためにサブウインドウを通して垂直線を印刷します。 プロバージョンはこちらです。マイトレード履歴PRO https://www.mql5.com/en/market/product/50206 また、入金通貨と合計pipsのトレードの合計結果についての情報も追加されます。 当日のトレードのみ、または指定された数のバー内のトレードのみを表示するよう選択できます。 マジックナンバーを指定したトレードを表示することができます。0を指定すると、すべての取引が表示されます。マジックナンバーを指定すると、そのEAの取引のみが表示されます。マウスオーバーすると、注文番号、コメント、マジックナンバーが表示されます。 このインジケータは、主に私の他の通貨強度の専門インジケータの1つと一緒に使用されます。 https://www.mql5.com/en/blogs/post/679
FREE
現在26%OFF! このインディケータは、当社のメインインディケータ( Advanced Currency Strength 28   &  Advanced Currency IMPULSE with ALERT )の両方のスーパーコンビネーションです。28の外国為替ペアのTICK-UNITSとアラートシグナルの通貨強度の値を示しています。11種類のTick-Unitが使用可能です。1、2、3、4、5、6、10、12、15、20、30秒の11種類です。サブウィンドウのTick-Unitバーは、秒単位のタイマーに1ティック以上含まれる場合に表示され、左側にシフトされます。 たった1枚のチャートで、28のFXペアをスキャルピングできます。スキャルピングのチャンスとなるトリガーポイントを正確に把握することで、スキャルピングが上達することを想像してみてください。 1分足よりも短い期間で動作する市場初の通貨強度インジケーターです! このインジケータは、素早いインとアウトを行い、小さなピップを切り取ることを望む高速スキャルパーのためのものです。 ユーザーマニュアル: ここをクリ
現在20%オフ! 初心者やエキスパートトレーダーのためのベストソリューション! トレードを見直すことは、成功するトレーダーへの第一歩です。 成功するトレーダーは、定期的に自分の取引パフォーマンスを見直す習慣があります。 このツールは、まさにそれを行うのに役立ちます。 このツールであなたの取引を追跡することで、レビュープロセスが最も効果的になります。 手動取引またはEAの取引を分析します。 3つの一般的なビューを使用してください。ボタンをクリックするだけで切り替えることができます。 クローズド・トレード オープントレード クローズ+オープントレード すべての取引は、各シンボルごとに表示されます。他のシンボルに移動するには、シンボル名のボタンをクリックします。 新規にオープンした取引とクローズした取引にはAlertを使用します。オープントレードを監視するのに非常に便利です。EA、シグナル、または手動で開始されるかもしれません。 利益またはPIPsの結果を切り替えるには、ボタンをクリックするだけです。 利益 PIPs 次に、3つの分析タイ
フィルタ:
MarcoEA
138
MarcoEA 2023.06.09 22:50 
 

hello, I bought two of your indicators. Sup and Dem and Dashboard of Sup and Demand. What are the bonuses?

Bernhard Schweigert
81152
開発者からの返信 Bernhard Schweigert 2023.06.25 12:01
Thank you for purchasing our dashboard. As a bonus, we invite you to join our exclusive community of traders by registering at www.CurrencyStrength28.com/forum . In our forum, you'll have access to valuable resources and discussions on successful trading strategies. The best part? It's completely free for our clients. Don't miss out on this opportunity to enhance your trading skills and connect with like-minded traders. If you have any further questions or need assistance, feel free to reach out. Happy trading!
Gabor Bocsak
2345
Gabor Bocsak 2023.05.23 18:42 
 

I really like the indicators! Actually i use 4 of them and they work really well together! I had a lot of questions as i use a bit different strategy.but i got all the help! Thank you!

Bernhard Schweigert
81152
開発者からの返信 Bernhard Schweigert 2023.06.09 15:01
Thank you, Gabor Bocsak, for your positive feedback. We truly appreciate it. We are glad to hear that you are enjoying the indicators and that they are working well in conjunction with your strategy. Our team is always ready to assist you and answer any questions you may have. We are committed to providing top-notch support and ensuring your success. 💖
Tyrena Booker
96
Tyrena Booker 2023.02.01 19:59 
 

The indicator is phenomenal!!! This indicator help me to know when pullbacks are happening.I enjoy the enhance features of this indicator because you can add any symbols see the whole market within seconds. I use this indicator with Currency Strength Exotics on the chart and let just say you will be counting PIPS. Bernhard will help with your question and answer each one in punctual time. I highly recommend this indicator to anyone. I appreciated your help Bernhard!!!

Bernhard Schweigert
81152
開発者からの返信 Bernhard Schweigert 2023.02.02 12:38
I appreciate your review with the phenomenal note.💖
batukbhairava
206
batukbhairava 2022.08.10 19:13 
 

Similar to CS28 Dashboard this indicator is a great dashboard which provides the Supply & Demand zones of all 28 pairs in a single window. My only issue with this indicator is that I couldn't resize the windows properly. May be Bernhard could look into this in the next update can design a template which can be resized properly. Also adding & removing currency requires manually typing the currency pairs in the settings. Is it possible if we can use the "Check Box" from the list instead? That will save lot of time As usual great work from Bernhard Thanks and Happy trading to all.. :-)

Bernhard Schweigert
81152
開発者からの返信 Bernhard Schweigert 2022.12.30 16:05
Thanks for sharing your great feedback. 🙏💖
New update: 2 buttons have been added to move the dashboard right/left or up/down. There may be symbols outside the visible chart if there are many symbols used. A click on the button will move the diagram by a number of rows or columns. Hope it helps.
najis080
134
najis080 2021.12.08 19:38 
 

Makes trading in zone much easier. I love this indicator.

Bernhard Schweigert
81152
開発者からの返信 Bernhard Schweigert 2022.02.02 09:07
Thanks for the review! 👍
Darryl Brown
223
Darryl Brown 2021.09.27 07:28 
 

I rented the indicator over the weekend and I plan on using this indicator along with cs28 and impulse for binary options trading. My first day so far I made 3k from $400 (5 wins 0 loss trades total) by following his rules of all 3 indicators. His system is by far superior and worth the money spent IMO. This indicator lets you know that all entries are not good entries. I love your other indicators Bernhard but this is by far my favorite one.

Bernhard Schweigert
81152
開発者からの返信 Bernhard Schweigert 2021.12.06 13:30
Thank you very much for your excellent review, friend! Wish you more success in your trading. 🙏👍
sudiang
222
sudiang 2021.09.06 15:00 
 

Personally, I like the stand alone version better. But this dashboard help me alot not to open many chart and stay all the time infront of laptop to monitor the opportunity. Just use it with the main trend and TF > 30, and it give low RR and many potential setup.

Bernhard Schweigert
81152
開発者からの返信 Bernhard Schweigert 2021.09.07 20:44
Thanks for the feedback! 🙏👍
George Palcau
21
George Palcau 2021.03.15 21:09 
 

Supply and demand zones are dissapearing all the time and it is confusing when it broke that resistance, i did not knew that from that begining and i can't use this indicator in my trading. When i contacted the seller about refund he recommended to buy another indicator that could go better with this one. Signals and alarms are also not triggering often. Overall bad experience and i did not received any refund.

Bernhard Schweigert
81152
開発者からの返信 Bernhard Schweigert 2021.03.16 13:52
It is the design of the dashboard to give a quick overview of the market. If you want to see broken zones, you need to use Advanced Supply Demand indicator version. The whole mql5 website does not support refunds. You can try the free demo before buying to know how it works. Besides, you rent only 1 month, which is only intended for a test.
Zachary David Cox
914
Zachary David Cox 2021.02.28 14:38 
 

I've used a couple of this authors products and have had success so I decided to try this one. My experience with the other products made setup and understanding very easy. It is a very powerful indicator!

Bernhard Schweigert
81152
開発者からの返信 Bernhard Schweigert 2022.10.01 17:21
Thanks for the honest review! 👍
Zafer Cakar
201
Zafer Cakar 2021.02.24 21:04 
 

Very strong indicator , incredible.

elthandoriancox
62
elthandoriancox 2020.09.18 14:11 
 

This indicator makes visually easy to determine where the buyers and sellers are in the market, thereby allowing you to see where the market will turn and or go too, impressive Bernhard !!!

a.hanson
221
a.hanson 2020.09.12 12:36 
 

I only have this indicator for 3 weeks but already I find it very useful in determining where to get out of a trade. Very good indicator, I am still getting used to it Bernhard's support is great like with all his other indicators, keep up the good job work.Thanks

Mark Taylor
2011
Mark Taylor 2020.08.27 11:30 
 

I have a few SD indicators and this one is by far the best, easy to read at a quick glance.

teapeak
75
teapeak 2020.08.05 13:21 
 

Best SD indicator I ever saw in Forex for Mt4. Hat off. Thank you.

SENMAO ZHANG
652
SENMAO ZHANG 2020.07.15 07:46 
 

This is the best support pressure indicator I've ever used, and it's my fifth Bernhard product.

stev18
136
stev18 2020.07.10 15:42 
 

I have been using some of the indicators from Bernhard. The quality of his products is very commendable. This indicator is a great tool. It plots accurate supply and demand zones on the chart and also displays them on a dashboard. With the dashboard, one can easily spot zones of interest, that can be traded with high probability of success. It also displays a lot of information that will help the trader make better trading decisions. I find it very useful. Thank you Bernhard and keep up the good work.

Oliver Henry
593
Oliver Henry 2020.06.16 13:01 
 

As a long time user of Bernhard's stand alone Supply and demand indicator I know just how accurate this indicator is. Being able to receive alerts for multiple pairs and monitor from a single dashboard is next level trading! Using this in conjunction with his other indicators makes for some very reliable signals. Many thanks

prestonmay3
215
prestonmay3 2020.02.22 20:19 
 

I have been using s/d as trade entry and exit now with a lot of success . The problem is that I spent most of my day looking for trades and charting . Instead of charting all 28 pairs , I use this to send me alerts , then I do technical analysis . Most free ones will only tell you when price enters a zone and not when it breaks and exit. I like this so much that I will purchase the Advance Standalone version and the Exotic ACS system. I have wasted 2000 on systems and indicators in the past year - This system paid for itself within the first week. The developer is an A plus guy also. Always answers questions in a fast manner .

valera123
172
valera123 2019.11.05 20:58 
 

Very good and high-quality product!

daniela maria lazzi
514
daniela maria lazzi 2019.10.16 12:41 
 

Incredibile.SUPER-Genio l'ideatore di un indicatore simile.Grazie

12
レビューに返信
バージョン 3.9 2024.07.08
We are thrilled to announce the release of version 3.9 of our top-rated Supply and Demand Dashboard, packed with powerful new features to enhance your trading experience!

New Features and Enhancements:

Added a Quick Access Button: I've added a convenient button that allows you to quickly open a chart with the symbol and timeframe of the latest signal. This new button is prominently displayed at the top of the sub-window for easy access.

Improved Chart Integration: For seamless chart management, we recommend opening the signal in a target chart. Simply go to the "Other Settings 1" in the input list and set "Charts open in new window" to true. Once the target chart is open, re-add the dashboard with your customized settings, but setting the symbol list to 0 and "Popup Alerts" to false.

Happy trading and kill the market!
バージョン 3.8 2024.06.25
Best-Rated Supply and Demand Dashboard in the Market! Now Featuring Enhanced Detection for Gold and Indices!

**Update Now to the Latest Version!**

We are excited to introduce the latest update for our highly acclaimed Supply and Demand DASHBOARD PRO. This new version brings several significant enhancements designed to improve your trading experience:

**Compatibility Improvements:** Optimized for the latest Metatrader version, ensuring seamless functionality and better performance.

**Advanced Zone Detection:** Improved detection of nested supply and demand zones, providing more accurate and reliable data for better trading decisions.

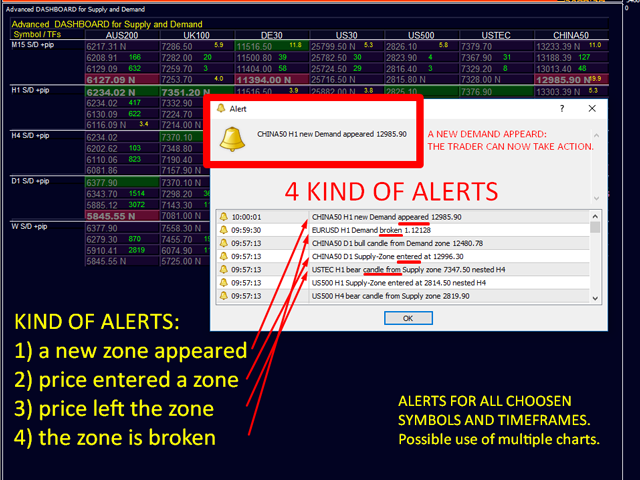
**Enhanced Alerts:** Four special alerts are now included:
- A new zone appeared.
- Price entered a zone.
- Price left the zone.
- The zone is broken.

**Graphic Dashboard:** Now includes an extra arrow to move the table if needed for better visualization and customization.

Don't miss out on these enhancements! Keeping your indicators up to date ensures you benefit from the latest features and improvements. Updating is free, simple, and guarantees you always have the best tools at your disposal.

Thank you for your continued support and trust in our products.

**Get the Latest Version Now!**

---

For more details and to download the update, visit:
https://www.CurrencyStrength28.com
バージョン 3.7 2024.04.25
Best rated Supply and Demand Dashboard in the Market.
Important improvements.
Please update.
バージョン 3.6 2024.02.21
Various improvements for new Metatrader version.
バージョン 3.5 2023.12.26
Unlock Your Trading Potential with the Latest Upgrade!

Seize the opportunity for a trading revolution! Elevate your strategies with the latest enhancements to the Supply and Demand DASHBOARD PRO. Upgrade now and trade with newfound confidence. Don't miss out on these essential improvements—your journey to successful trading begins here.
バージョン 3.4 2023.10.25
We've just released an exciting update for our indicator, packed with enhancements that take your trading to the next level.

Upgrading your indicator is a smart move. It ensures you're leveraging the latest features, giving you a competitive edge in the market. Don't miss out!

Should you have questions or need help with the update, our team is here for you. Reach out anytime; we're committed to your success.

www.CurrencyStrength28.com
バージョン 3.3 2023.08.24
Upgrade to Version 3.3 for Enhanced Trading Insights

+ We're thrilled to introduce Version 3.3, featuring the industry's highest-rated Supply and Demand DASHBOARD PRO. Elevate your trading strategy with this powerful tool, designed to help you identify critical price reversal areas.

+ What's New in Version 3.3:
- Seamlessly compatible with the latest Metatrader version.
- Empowered by advanced algorithmic enhancements, offering unparalleled accuracy in Supply and Demand multi-timeframe analysis.

+ Don't miss out on these exciting updates. Keep your indicators up to date effortlessly and at no cost. By staying current with our latest version, you're ensuring that your trading arsenal remains at the cutting edge of the market.

+ Upgrade to Version 3.3 now and access the best-rated Supply and Demand DASHBOARD PRO available. With the new Price Label feature, trading on higher timeframes becomes even more insightful. Join the community of savvy traders who are enhancing their strategies with our free, top-notch tools.
バージョン 3.2 2023.06.25
We are thrilled to announce the highly anticipated release of Version 3.2 of our Supply and Demand Dashboard PRO – the top-rated tool for traders like you. With its advanced capabilities, this powerful indicator will revolutionize your trading strategy by identifying critical price reversal areas, giving you a significant edge in the market.

Discover the latest enhancements we have made to ensure seamless compatibility with the newest Metatrader version. By upgrading to Version 3.2, not only do you gain access to cutting-edge features, but you also stay ahead of the competition. And the best part? These updates are completely free, so you can maximize your trading potential without any additional cost.

Upgrade now to Version 3.2 and experience firsthand the unparalleled benefits of our top-rated Supply and Demand Dashboard PRO. Take control of your trading journey, make informed decisions, and elevate your profitability. Don't miss out on this opportunity to improve your trading strategy – all for free.
バージョン 3.1 2023.04.23
We're excited to announce the release of Version 3.1, featuring the best-rated Supply and Demand Zone Dashboard on the market. This powerful tool helps you spot key areas of price reversal, giving you an edge in your trading strategy.

Our team has made various improvements to ensure compatibility with the latest Metatrader version, so you can take advantage of new features and stay ahead of the competition. Plus, keeping your indicators up to date is completely free and ensures that you're always using the most advanced tools available.

Upgrade now to Version 3.1 and experience the benefits of our best-rated Supply and Demand Zone Dashboard. Stay ahead of the competition and improve your trading strategy with the latest updates, all for free.
バージョン 3.0 2023.02.20
Please update to Version 3.0 of the Supply and Demand Zone Dashboard Indicator, the best rated indicator of its kind in the market, with various improvements.

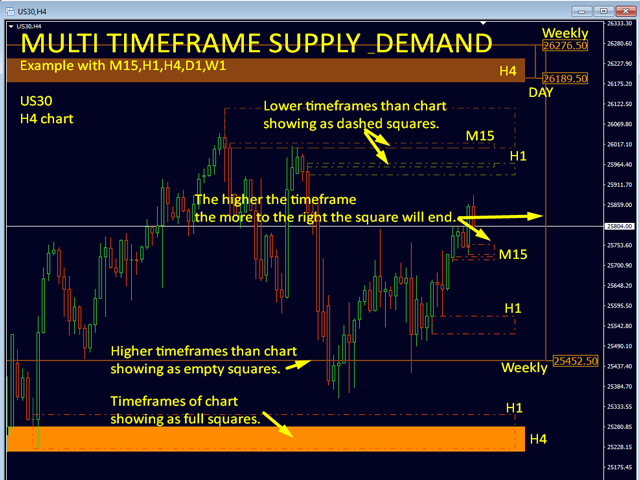
Some traders have reported that the zones in smaller time frames can be overlapped by the full rectangle of the current time frame. We have found a solution to this issue.

Now, you can choose to display the current time frame zone as an empty rectangle with a thicker border, so that the zones in smaller time frames are still visible.

There are two new input parameters available:

Full Rectangles Current Chart TF (default = true)
Rectangle Width Current TF (if not full 1-5) (default = 5)
We have not changed the previous display, so if you want to use the new function, you need to set the "Full Rectangles Current Chart TF" parameter to "false".
バージョン 2.9 2022.12.31
This is a small adjustment to yesterday's version with the new buttons.
This allows a practical navigation through the dashboard.
バージョン 2.8 2022.12.30
Added more improvements.
Updating is recommended.

2 buttons have been added to move the dashboard right/left or up/down. There may be symbols outside the visible chart if there are many symbols used. A click on the button will move the diagram by a number of rows or columns.

New input added:
+ Scroll number of rows list (1-10)
バージョン 2.7 2022.12.19
Various improvements.
Please update.
バージョン 2.6 2022.10.23
Various improvements.
Please update.
バージョン 2.5 2022.08.20
A useful feature has been added at the request of a trader.
It is possible for a trader to only have preferences for only buying or selling an instrument. Choose the alarms you want to set. The graph and alert for "entering a zone" and "new zone appearing" remain unaffected.

==== General Alert Settings ====
New input:
+ Traders preference alerts buy-sell-both

There was an issue with M1-alerts that has been fixed.

Please update.
バージョン 2.4 2022.07.02
Various improvements for new Metatrader version.
バージョン 2.3 2021.09.19
IMPORTANT UPDATE !!!

Due to new Metatrader versions, we need a corrective input to draw objects in a subwindow. If you use MT4 build 1341+, add the subwindow number (1 for the first subwindow, 2 for the second...). 0 means automatic.

New input at the end of the list:

+ Force objects to subwindow number (0=auto)
バージョン 2.2 2021.06.02
Various improvements.
バージョン 2.1 2021.04.25
Various improvements.
バージョン 2.0 2020.10.22
MAJOR UPDATE 2020
==================

Added optional: Supply and Demand zones with ENGULFING BARS pattern at the beginning of the zone.
Use reversal candle color for bar 1 or bar 2 (the one before). Use either one or both.
Use a true engulfing pattern for the above-mentioned bars. (Must choose above.)

By default the use is false. To use the function you must set the new inputs = true (The selection is copied to all timeframes).

New inputs:
==== Candle pattern
+ use reversal candle color bar 1
+ use reversal candle color bar 2 (both or either)
+ use true engulfing pattern (choose above)

MODIFICATION FOR ZONE SIZE
It was added optionally: Including a wick for the width of the supply and demand zones.
New input:
+ Include wick 1 for the zone size

By default, the function is not used. To use the function, you must set the new input = true (The selection is copied to all timeframes).
Since the zones will be wider, some zones could be filtered. You may want to use lower XY factors.
バージョン 1.9 2020.10.16
Various improvements.
バージョン 1.8 2020.06.23
Various improvements.
Optimized signal export to EAs.
バージョン 1.7 2020.05.21
New graphical feature added. We organize different time frames. Now you can display all time frame names on the right side of each square.

New input:
+ display all TF names right
バージョン 1.6 2020.01.16
Various improvements.
バージョン 1.5 2019.05.30
A new filter for alerts has been added to do alerts only if the zone is new or untouched. (Excluding break alert.)

New input:
+ alert only new zones (excluding breaks) (default = false)
To activate the filter set above input to true.
If false, the info will anyway be included into the alerts.
Example Alert: EURUSD H4 Demand-Zone (untested) entered at 1.11333 nested D1

バージョン 1.4 2019.04.23
Added a description on chart for higher S/D zones to know better the timeframe.
And diverse other improvements.
バージョン 1.3 2019.04.08
Made some changes to minimum Zone Drop to be align with Advanced Supply Demand indicator.
バージョン 1.2 2019.04.07
Re-activated the function for pivot and yesterdays high-low-open lines.
バージョン 1.1 2019.04.06
Added a message print on screen for last alert with time of alert.
You can choose if the time shows broker time or your PC time.
New input
+ Last Signal time is Local or broker time

Added an option to show less digital points.
New input
+ show prices with less digits (0-2) (0=all digits)