Trade by levels
- インディケータ
- Dmitriy Tyunin
- バージョン: 2.3
- アップデート済み: 19 7月 2019
The Trade by levels indicator is designed to automatically determine the formation of a model for entering the market on the chart of the selected instrument.
Definitions:
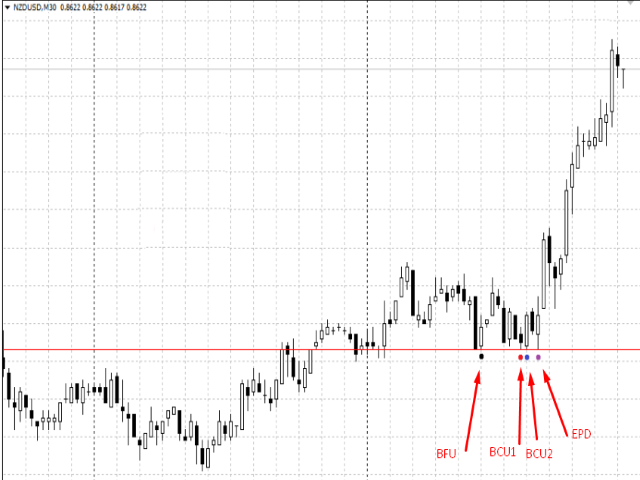
⦁ BFl is the bar that formed the level.
⦁ BCL1 and BCL2 bars, confirming the level.
The graphical model:
⦁ levels high\low the bars BFL and BCL1 must match the accuracy to the point
⦁ there can be any number of bars between BFL and BCL1.
⦁ between BCL1 and BCL2 intermediate bars should not be.
⦁ the value of a hi / lo bar BCL2 may be different from the level values (BFL and BCL1) the size of the backlash. Backlash no more than 2-3 points.
⦁ in General, the model is formed by 3 bars: 1 bar – forms a level. 2 bar-confirms the level. 3 bar also needs to confirm the level, 4 bar is the entrance.
Model trading rules:
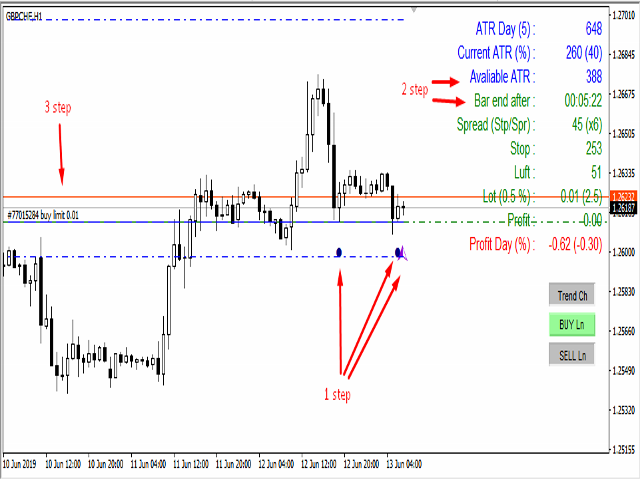
- Trading is carried out according to the trend of limit orders. Traded only the rebound from the levels.
- You can trade against the trend in the following cases:
⦁ if the current price of the instrument is near the level.⦁ if the Issuer has passed at least 75% of its ATR.
- 30 seconds before the closing of the BCL2 limit order is set with an indentation above/below the level of the backlash size (2-3 points).
- Stop is calculated as % of the current price, 0.2 - 0.5 is recommended%
- If the order is not opened, and the price has passed 2 actual stops from the price of the pending order – the order is canceled.
- Tool: any.
- Timeframes:
- D1-to determine the trend, the ATR value for the last 5 days.
- H1-to enter a trade on the model signal.
Indicator parameters:
- ATR Period (day) is the number of days for the ATR calculation
- ATR in pips/point - displays the value of the ATR in pips.paragraphs
- Ratio for TP/SL - take Profit to stop Loss ratio
- Risk for calculate Lot, (% of Margin) - risk Percentage of free margin for lot calculation
- StopLoss in % from - stop Loss size as % of the current price
- Gap for level on BCL2, (% of StopLoss) - the amount of “play” for a bar БСУ2, in % of the stop loss
- Number of bars for calculate trend - number of bars to calculate trend
- Text color1 - color of the label data
- Text color2 - color of the label data
- Text color3 - color of the label data
- Stop&Take lines color (BUY orders) - color of Stop order lines for buy orders
- Stop&Take lines color (SELL orders) - color of Stop order lines for SELL orders
- Stop&Take line style - type of stop order lines
- Digits in Profit% after comma - number of digits after the decimal point in the Profit value
- Font size for text - data display font size
- Vertical shift for button - vertical shift of buttons
- Horizontal shift for button - horizontal shift of buttons
- Horizontal shift for "name" text - horizontal shift of the data designation column
- Horizontal shift for "data" text - horizontal shift of the data column
- Color for status button "OFF" - color of the buttons in the “OFF " state”
- Color for status button "ON" - color of the buttons in the “ON " state”
- On/Off popup Alert - enable/disable popup message
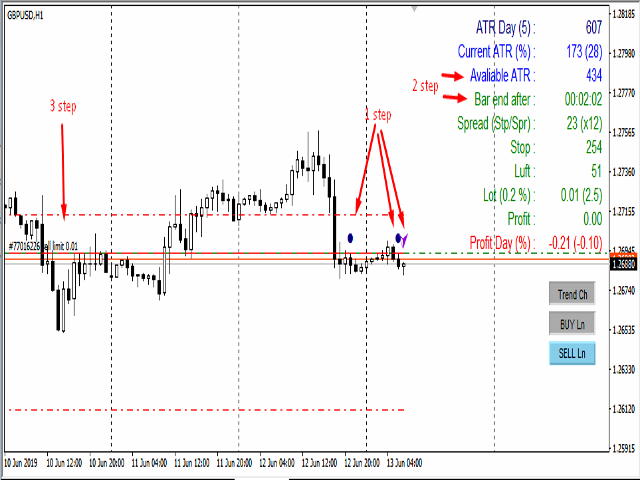
Add features:
- Output the value of ATR in pips\pips
- Monitor the current ATR value if > 80% is red
- Control the Spread/Stop Loss ratio if < 5 - red
- If the chart period is < 30 min, the values of StopLoss and Luft are reduced by 10 times
- After the lot size in brackets the size of the loss when triggered StopLoss
- The function of displaying the levels of Stop Orders
- Buttons Trend Ch, Buy, Sell - on\off display the corresponding lines on the chart


looks fine