Identify Trend
- インディケータ
- Aleksey Ivanov
- バージョン: 3.20
- アップデート済み: 10 8月 2021
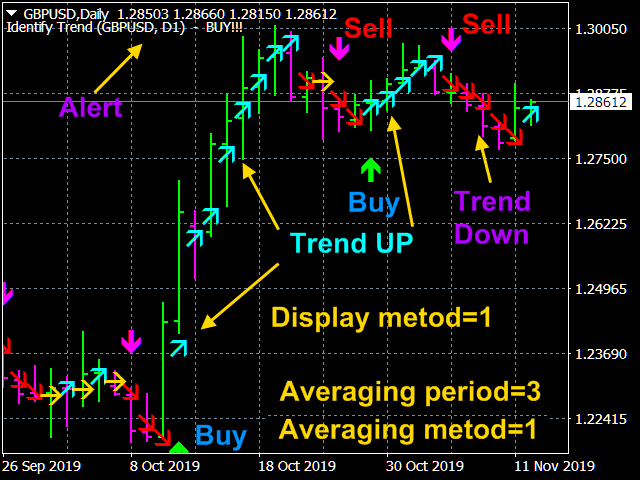
トレンドの識別インジケータを使用すると、非常に正確に、そして最も重要なこととして、わずかな遅延で、(1)真のトレンドの動きの開始、および(2)フラットを識別できます。このような指標は、スキャルパー戦略による取引と長期取引戦略の使用の両方に使用できます。インディケーター操作アルゴリズムは、最後のスクリーンショットで詳しく説明されています。
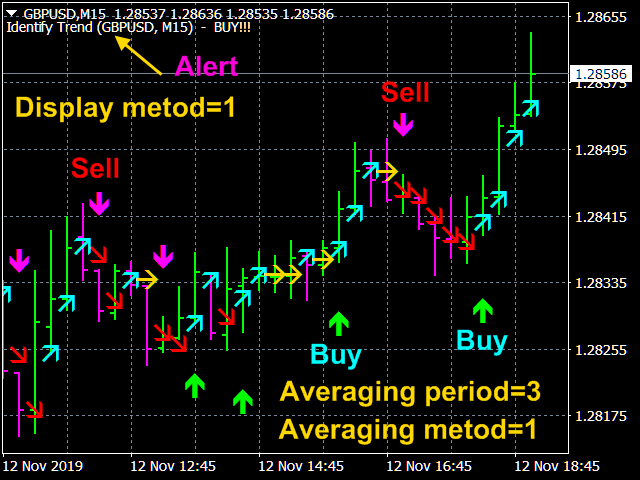
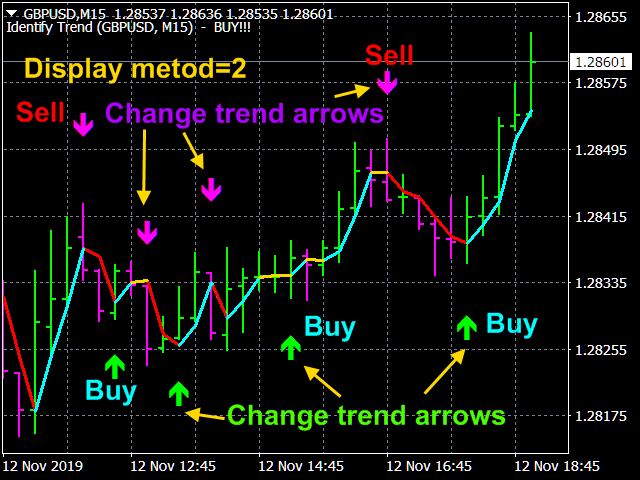
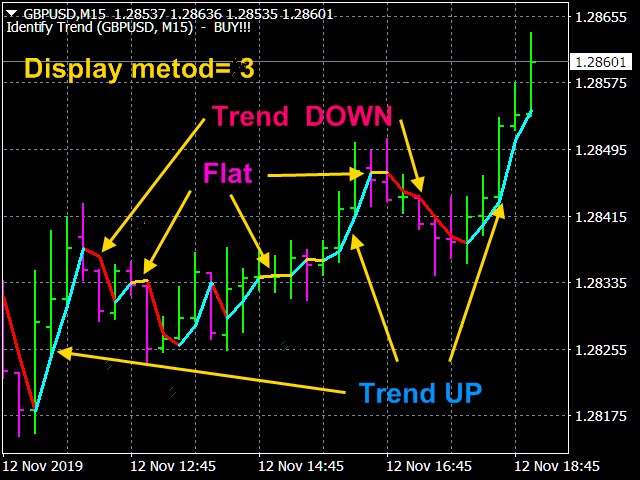
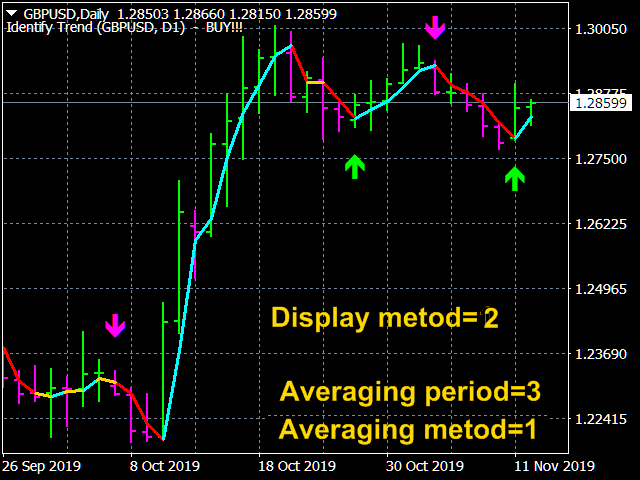
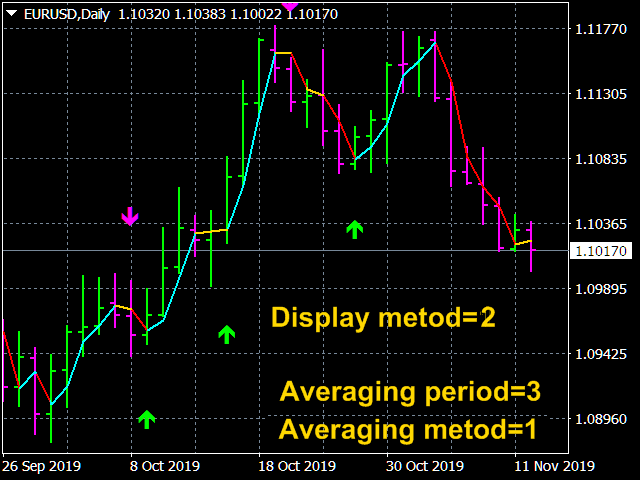
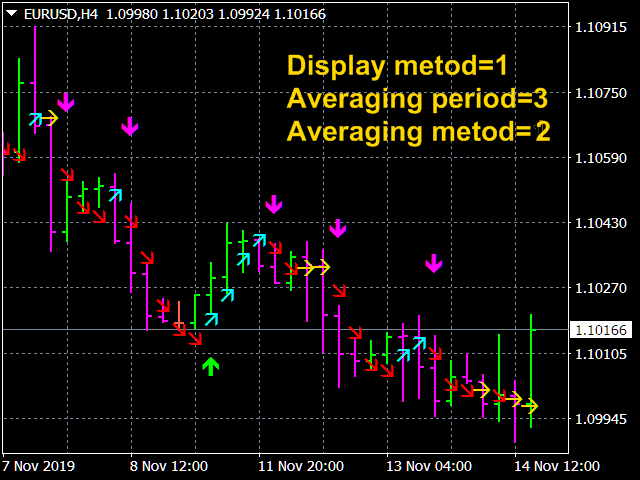
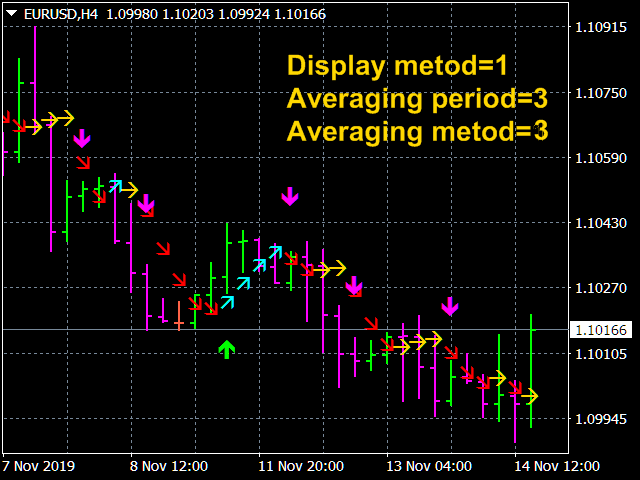
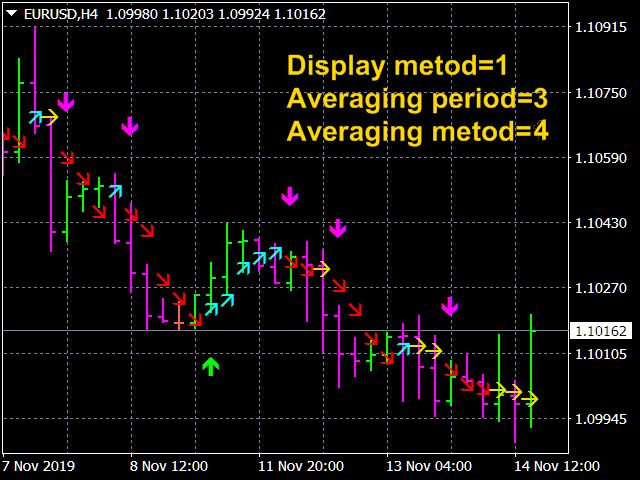
指標の読みは視覚的で非常に単純で、コメントを必要としません。インディケータの青い線は上昇トレンドを表し、金色の線はフラット、そして赤い線は下降トレンドです。したがって、赤または金の線が青に置き換えられた場合はBuyのエントリポイント、青または金の線が赤に置き換えられた場合はSell - のエントリポイントです。
このインディケータにはあらゆる種類の警告があります。(トレンド方向の)インジケーターの表示が最後の2つのバーに一致すると、アラートがアクティブになります。
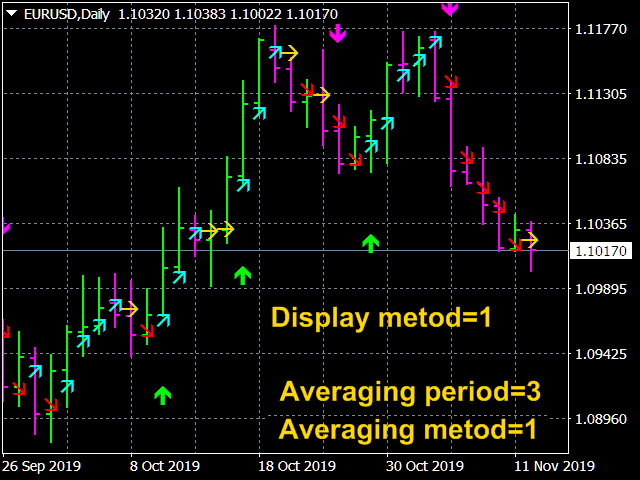
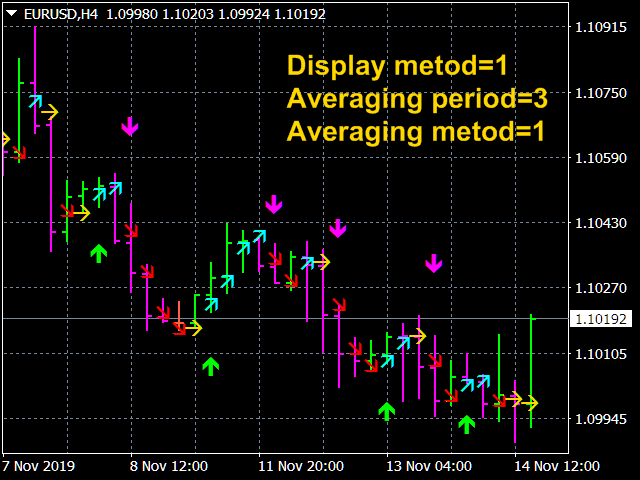
価格の動きの方向が変化する可能性のある瞬間も矢印で示されています。
インジケーター設定 .
- Price type -価格の種類。値: Close price, Open price (デフォルトで), High price, Low price, Median price ((high + low)/2), Typical price ((high + low + close)/3), Weighted price ((high + low + 2*close)/4).
- The averaging method - 平均化方法. 値: XC=XF - XS + SMMA, XF=<x/SMMA>*SMMA, XS=<x*SMMA>/SMMA, XM=<Max({x})+Min({x})>/2 (デフォルトで), SMAWL, EMAWL, SSMAWL, LWMAWL.
- The averaging period - 平均化期間 値任意の整数(3 デフォルトで).
- The display method - 情報を表示する方法。値:Show only arrows (デフォルトで), Show lines and arrows, Show only lines.
- Line (arrows) thickness. 線または矢印の太さ。任意の整数 (2デフォルトで).
- Trend DOWN line color=Red - 下降トレンドを示す線または矢印の色。
- Trend UP line color=Aqua - 上昇トレンドを示す線または矢印の色。
- FLAT line color=Gold - フラットラインの色(矢印)。
- Trend DOWN arrow color=Magenta - 矢印は下降トレンドの始まりを示しています。
- Trend UP arrow color=Lime - 矢印は上昇トレンドの始まりを示しています。
- The Signal method - 取引シグナルアラートの種類. 値: No, Send alert, Print (in expert), Comment (in chart), Sound + Print, Sound + Comment, Sound, Push + Comment, Push, Mail + Comment, Mail.


I find this indicator very helpful especially since changing parameters to Lines and Arrows. Have also turned on alerts, so great that there is the ability to change the viewing of the indicator. Thanks for your free indicator