DBS Cluster Search
- インディケータ
- Dmitriy Burlachenko
- バージョン: 2.51
- アクティベーション: 5
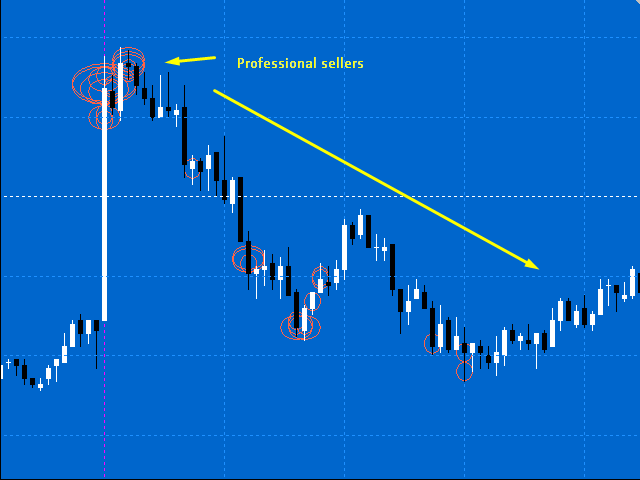
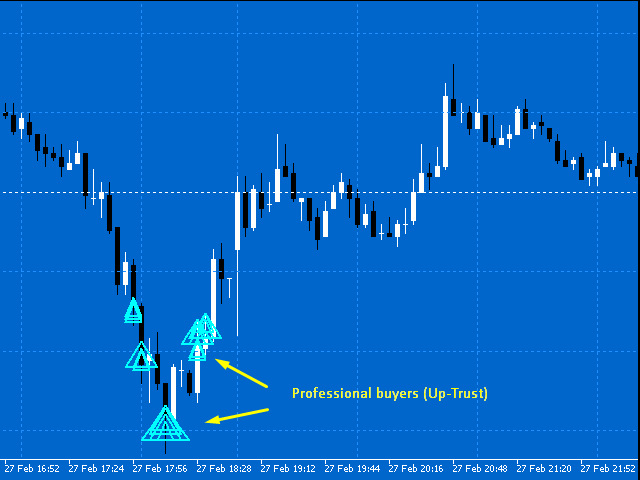
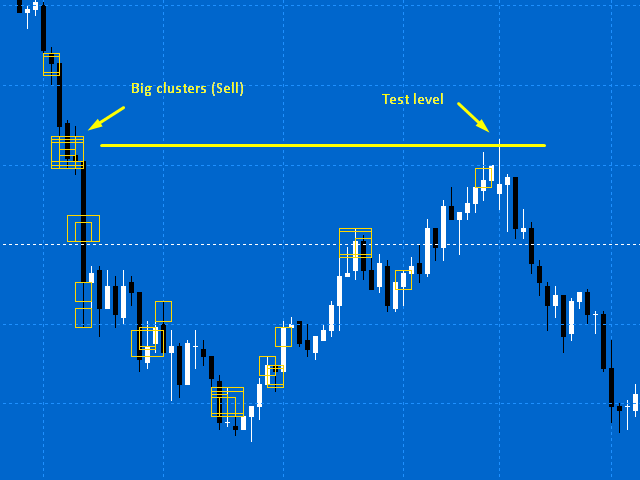
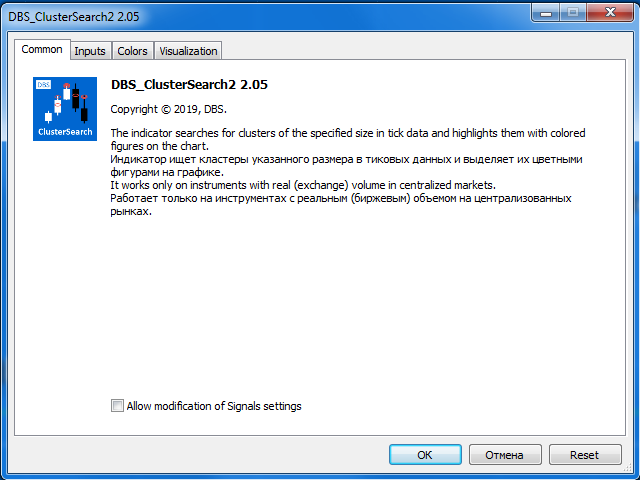
The DBS Cluster Search indicator searches for clusters of the specified size in tick data and highlights them with colored figures on the chart. These levels (areas) in the future are often the starting point of a strong price movement. The indicator can, when calculating, combine clusters at several adjacent price levels, which gives greater value and weight in the forecast.
The indicator is calculated from the tick history, therefore, to speed up the calculations and reduce the load on the system, the number of bars for calculation is specified in the parameters.
Input parameters:
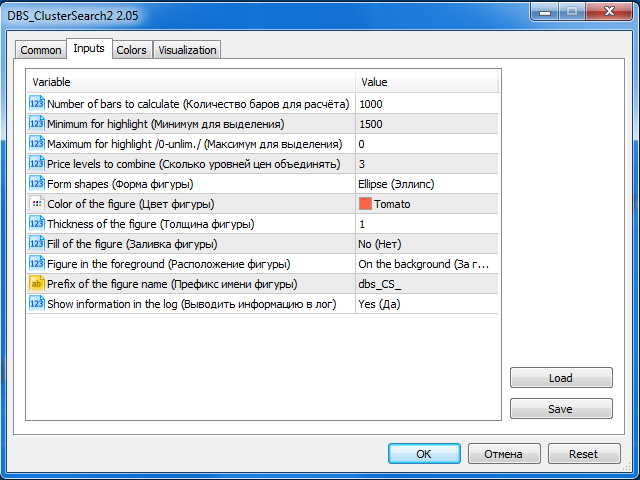
- Number of bars to calculate - The number of bars to calculate the indicator.
- Minimum for highlight - Minimum cluster size for selection.
- Maximum for highlight (0-unlim.) - Maximum cluster size for selection (0 - no limit).
- Price levels to combine - How many price levels combine to cluster. Combining 2x-3x neighboring price levels gives greater predictive value.
- Form shapes - You can select "Ellipse", "Rectangle" and "Triangle."
- Color of the figure - The color of the figure.
- Thickness of the figure - The thickness of the outline of the figure.
- Fill of the figure - Fill the shape (No/Yes). When superimposing several shapes on each other, due to the algorithms for drawing graphical objects in MT, the display is not entirely correct.
- Figure in the foreground - The location of the figure in the foreground chart or on the background on chart.
- Show information in the log - Show or not extended information in the log. (No/Yes).
It is possible to place several indicators on one chart (for example, to highlight several ranges of clusters with different colors or types of shapes).
