Price deviation from MA
- インディケータ
- Illia Zhavarankau
- バージョン: 1.1
- アップデート済み: 9 8月 2019
- アクティベーション: 5
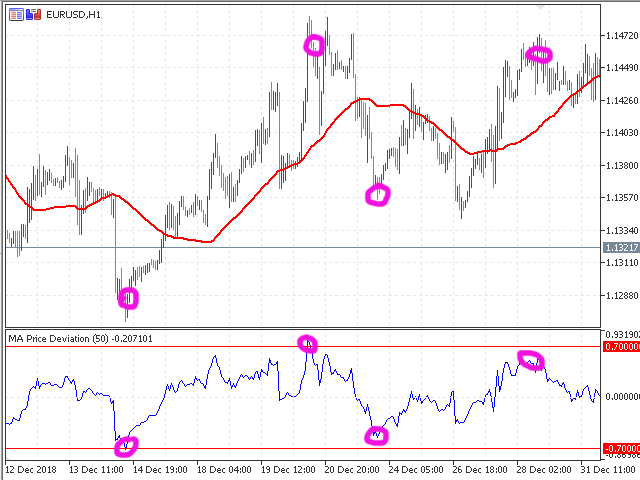
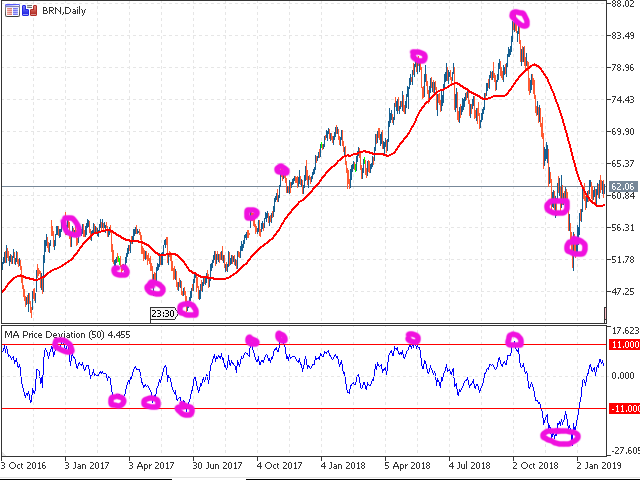
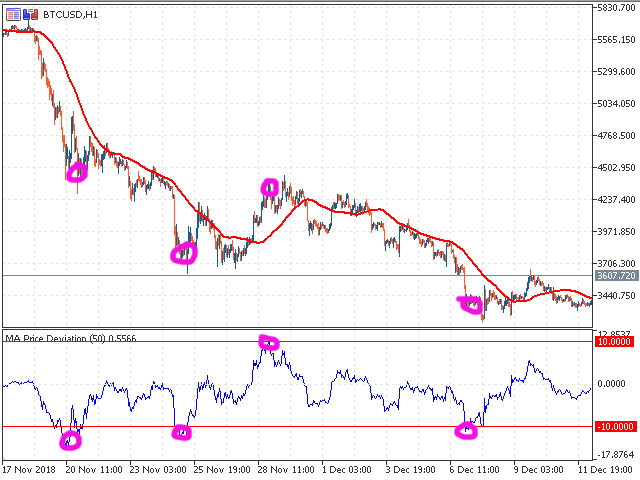
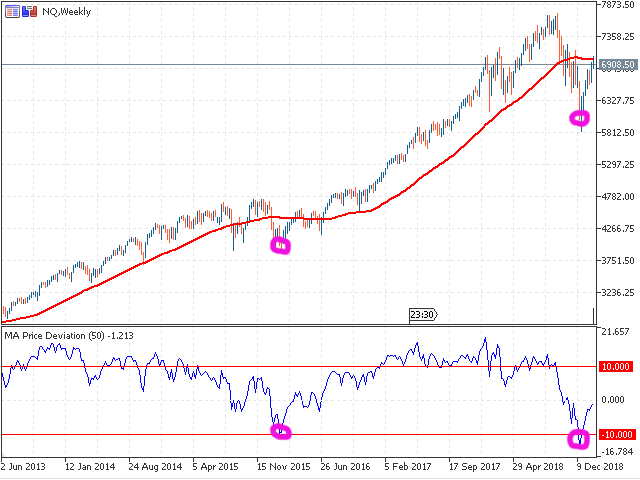
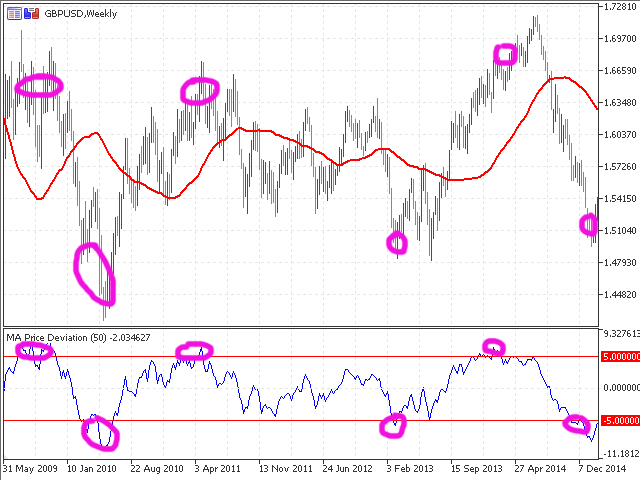
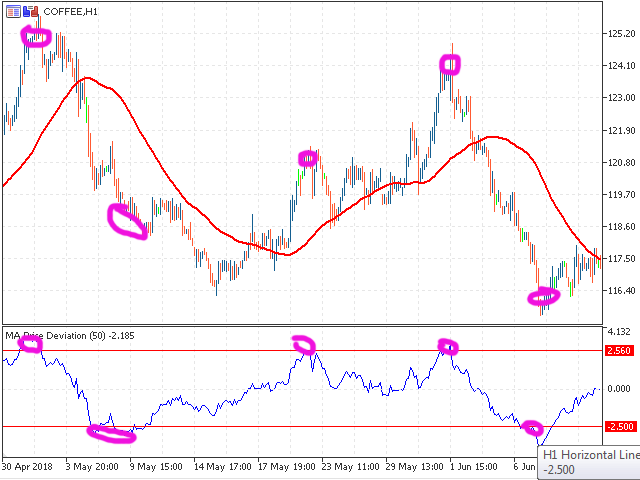
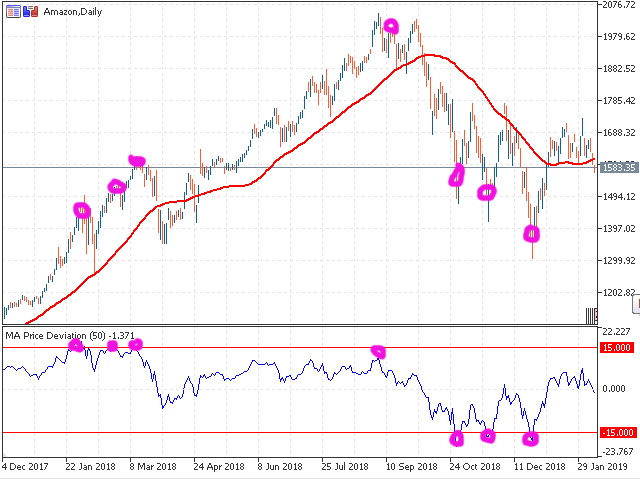
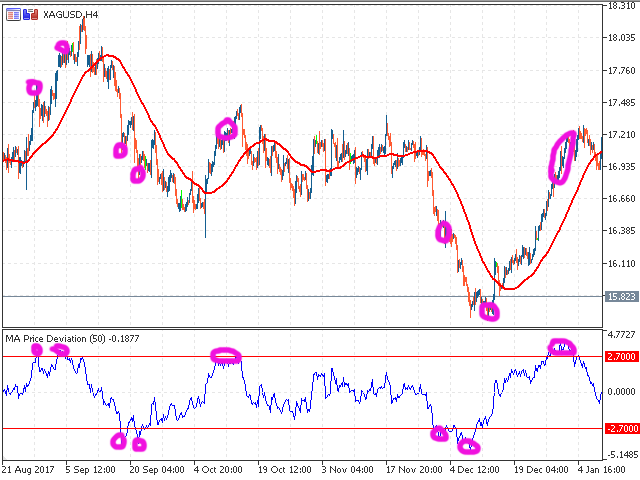
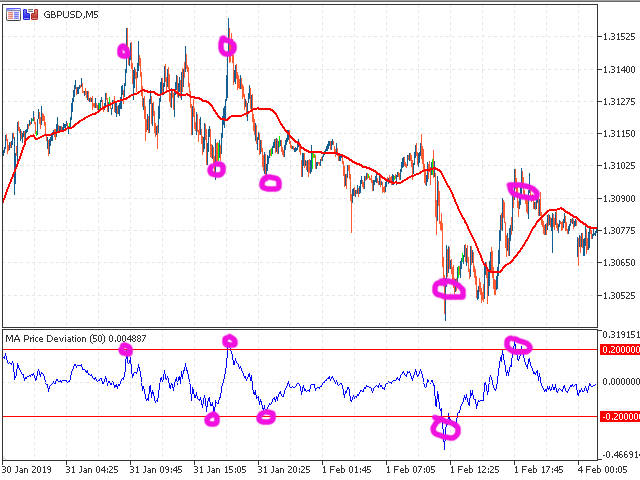
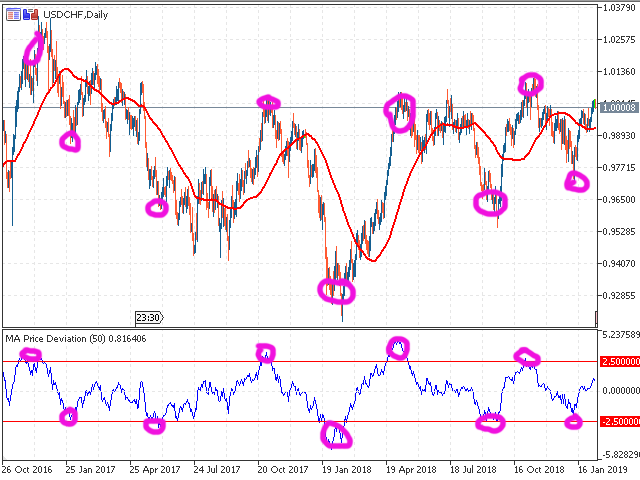
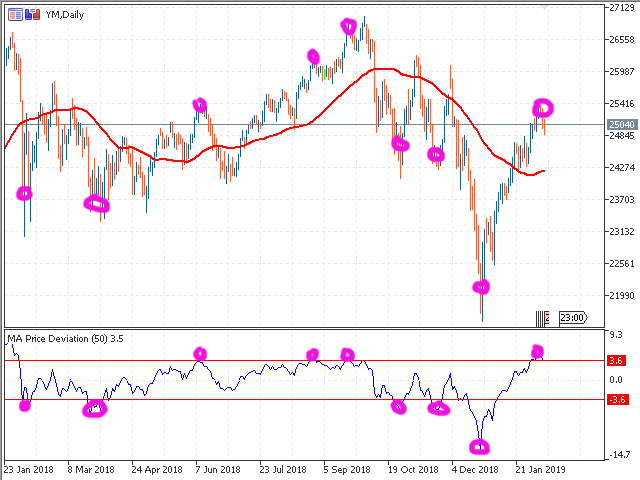
MAからの価格偏差
別ウィンドウの区分には、移動平均の指定値(移動平均)からの価格偏差(%)の値が表示されます。
ポジションの確定と新規ポジションのオープンの両方に使用できます。
入力パラメータ
移動平均を計算するための平均化期間。
平均化方法。 ENUM_MA_METHOD値のいずれかになります。
MODE_SMA - 単純平均
MODE_EMA - 指数平均
MODE_SMMA - 平滑化された平均化
MODE_LWMA - 線形加重平均
中古価格です。 ENUM_APPLIED_PRICE価格定数のいずれかになります。
PRICE_CLOSE - 終値
PRICE_OPEN - 始値
PRICE_HIGH - その期間の最大価格。
PRICE_LOW - 期間の最小価格
PRICE_MEDIAN - 中央値価格(高値+安値)/ 2
PRICE_TYPICAL - 典型的な価格、(高+安+終値)/ 3;
PRICE_WEIGHTED - 加重平均価格、(最高+最低+終値+終値)/ 4。