• 概要
  • レビュー (2)
  • コメント (3)
  • 最新情報

Trend dashboard

1

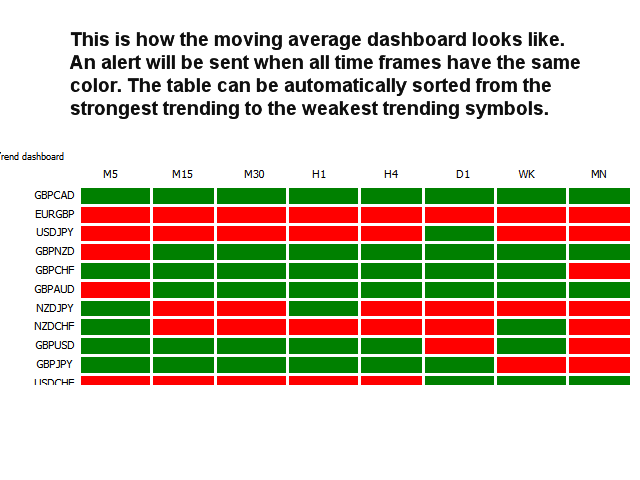
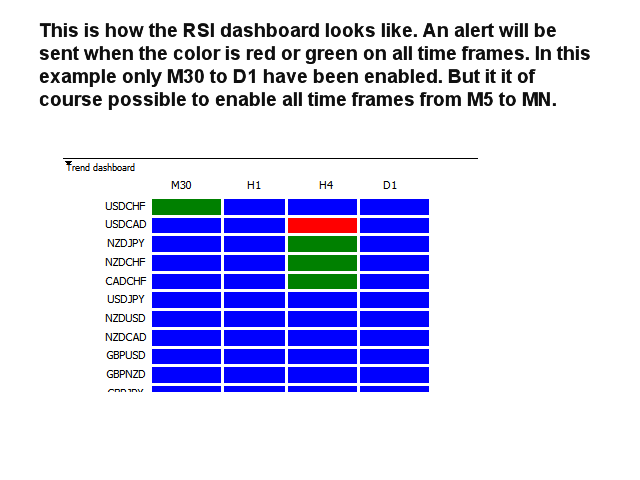
このマルチタイムフレームとマルチシンボルトレンドインジケーターは、強いトレンドまたはトレンド反転が識別されたときにアラートを送信します。移動平均(シングルまたはダブル(MAクロスオーバー))、RSI、ボリンジャーバンド、ADX、コンポジットインデックス、パラボリックSAR、素晴らしい(AO)、MACD(シグナルライン)、  ストキャスティクスのクロスオーバーまたは船体の移動平均。 M5からMNまでのすべての時間枠で使用できます。ダッシュボードの色は、強気の場合は緑、弱気の場合は赤、ニュートラルの場合は青です(指標値が範囲外です)。

このインジケーターを独自のルールや手法と組み合わせると、独自の強力なシステムを作成(または強化)できます。

特徴

  • インディケータは、エキスパートアドバイザーが自動取引に使用できるグローバル変数にシグナルを書き込むことができます。たとえば、 この製品
  • 使用する時間枠を選択することができます。
  • ダッシュボード内でトレンド強度ランクソートを継続的に実行します。ただし、特定のシンボルを見つけやすくするために、この並べ替えを無効にすることは可能です。シンボルは、シンボルパラメータに入力されたのと同じ順序で、またはマーケットウォッチウィンドウに表示される順序で表示されます。
  • 長方形の内側をクリックすると、問題のシンボルと時間枠を含む新しいチャートが開きます。

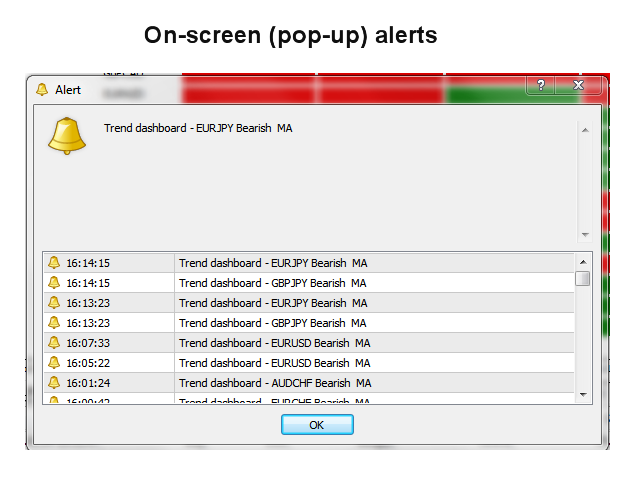
インジケーターを1つのチャートに配置するだけで十分であり、選択した任意のシンボルからアラートを受け取ります。すべてのアラートタイプがサポートされています。

入力パラメータ

ここで入力パラメータの説明と説明を見つけてください。

このインジケーターはストラテジーテスターではサポートされていないことに注意してください。また、チャート上で線や矢印を描いたり、アドバイスを売買したりすることもありません。

インジケーターは、ダッシュボードに干渉する可能性のある他のインジケーターやエキスパートアドバイザーがいない、クリーンな(空の)チャートであるM5チャートに配置する必要があります。ダッシュボードはインジケーターウィンドウに読み込まれ、チャート全体をカバーするように展開できます。


おすすめのプロダクト
I recommend you to read the   product's blog  (manual) from start to end so that it is clear from the beginning what the indicactor offers. This multi time frame and multi symbol indicator sends an alert when one or more trend reversal candle patterns have been identified on several time frames. It can be used with all time frames from M5 to MN. It is possible to enable moving average or RSI trend filter to filter out only the strongest setups. Combined with your own rules and techniques, this
I recommend you to read the   product's blog  (manual) from start to end so that it is clear from the beginning what the indicactor offers. This multi time frame and multi symbol supply and demand zone dashboard indicator sends alerts when the price has reached a supply/demand zone. It is also possible to use it to be alerted about regular double tops/bottoms instead of zones. It can be used with all time frames from M1 to MN. It is possible to use RSI, divergence (MACD, OsMA, RSI or Awesome) a
Signal Eskiya, in addition to channel lines, reflects entry signals in the form of arrows. Trading strategies using the channel indicator belong to the classic methods of technical analysis, are easy to execute, and therefore available even to beginners. Price ranges work equally well on any trading assets and timeframes, they can be used both independently and with additional confirmation from oscillators and market volumes. American traders say: “Trend is your friend”, which means “Trend is
Trend Divergence Indicator: Your Essential Tool for Market Analysis The Trend Divergence Indicator is a powerful tool designed to assist traders in identifying market trends and pinpointing entry points with precision. By leveraging price divergence, this indicator enhances your trading strategy, offering reliable insights and filtering unnecessary signals. Key Features and Benefits of the Trend Divergence Indicator Accurate Trend Analysis: The Trend Divergence Indicator uses price divergence t
The Transition Trend indicator shows the points of potential market reversal. The indicator's smart algorithm detects the trend, filters out market noise and generates entry signals and exit levels. Simple, visual and efficient trend detection. Uses just one parameter for settings. The indicator does not redraw and does not lag. You can set up message alerts as sound or email. Works on all currency pairs and all timeframes. Ready-made trading system.
I recommend you to read the   product's blog  (manual) from start to end so that it is clear from the beginning what the indicactor offers. This multi time frame and multi symbol indicator scans for pin bars. Combined with your own rules and techniques, this indicator will allow you to create (or enhance) your own powerful system. Features Can monitor all symbols visible in your Market Watch window at the same time. Apply the indicator to just one chart and instantly monitor the entire market.
OBTE = Order Block Type I OBTI Indicator MT4 is the most accurate and customizable indicator on the market. It was developed to facilitate the analysis of operations based on candlestick patterns and supply-demand zones. These zones are possible movement reversal points. For this indicator is generated by the order block of smart money concept. Input parameters: 1. Multiple timeframes : M1 M5 M15 M30 H1 H4 D1 W1 MN1 2. Default input: H1 H4 D1 W1 MN1 3. Notifications / Send Emails / Notificatio
I  recommend you to read the   product's blog  (manual) from start to end so that it is clear from the beginning what the indicator offers. This multi time frame and multi symbol indicator scans for engulfing and tweezer formations. The indicator can also be used in single chart mode. Combined with your own rules and techniques, this indicator will allow you to create (or enhance) your own powerful system. Features Can monitor all symbols visible in your Market Watch window at the same time. Ap
The presented indicator clearly and very accurately displays the current trend, its beginning and end. The indicator is also used to identify support/resistance levels. The operating principle of the indicator is based on another popular and time-tested indicator - Bollinger Bands. The indicator allows you to send notifications to a mobile terminal and email. Customizable parameters: Bollinger Bands Period; Bollinger Bands Deviation; Offset Factor; Alerts - displays a dialog box containing inf
Introducing the Donchian Channels indicator for MQL4, a powerful technical analysis tool designed to boost your trading success. This indicator consists of four lines that represent the upper and lower boundaries of price movement over a specified period. With the Donchian Channels indicator, you can easily identify potential breakouts and reversals in the market. The upper line shows the highest high of the specified period, while the lower line represents the lowest low. The space between thes
This product shows you a different view of the market by examining the performance of volume and continuous patterns in the market, then by calculating the behavior of traders and market patterns, calculates the probability of the next movement of the market by calculations. Function. How to receive the signal: If the candlestick is currently a bullish candlestick, according to a market scan, if the next bullish candlestick is below 5%, you can open a free trade by hitting the wisdom areas.
The indicator allows you to instantly determine the current trend by color and FIBO levels. Higher Timeframe the panel shows the current trend of higher periods, helping to determine the strength of the trend Trade according to the trend when changing the color of candles or trade against the trend when the price hit the extreme levels of the   FIBO Trend PRO  indicator     Advantages of the FIBO Trend PRO Indicator never repaint and does not change their values Very easy to use and intuitive
Binary Indicator Trading
Sukunthakan Ngernbamrung
3 (1)
. Simple Trading System Update !!! Follow this link to see our Strategy !!!   (With auto trade indicator) Description This is an indicator Free Version and showing only history signals, Not real time. Binary Deal Trading Indicator is an indicator on MT4 for Binary Option Trading. It forecasts the overbought / oversold level, Reversal and Fractal point. This indicator will help you to decide a reversal price on any time frame (Recommend M1, M5 and M15). The expiry time is 5-15 minutes after re
FREE
このマルチシンボルおよびマルチタイムフレームインジケーターは、次のローソク足パターンをスキャンします(パターンの説明についてはスクリーンショットを参照してください)。 3人の白人兵士(逆転>継続パターン) 3つの黒いカラス(反転>継続パターン) 強気と弱気のスリーラインストライク(反転パターン) インジケーター設定の厳密なオプションが有効になっている場合、パターンはより高い時間枠ではあまり頻繁に表示されません。しかし、そうする場合、それは非常に確率の高い設定です。 Thomas Bulkowski(国際的に有名な作家であり、ローソク足パターンの第一人者)によると、3ラインストライクはローソク足パターンの中で最高の全体的なパフォーマンスランクを持っています。このインジケーターを独自のルールや手法と組み合わせると、独自の強力なシステムを作成(または強化)できます。 特徴 マーケットウォッチウィンドウに表示されているすべてのシンボルを同時に監視できます。インジケーターを1つのチャートに適用し、市場全体を即座に監視します。 M1からMNまでのすべての時間枠を監視でき、パターンが識別されたときに
United Rsi
Kenneth Parling
3.5 (2)
Introduction United Rsi is an expert everyone should have in their arsenal, simple and easy to handle. From the name, you will surely understand that the expert works with the Relative Strength Index indicator, which constitutes a signal for trading in overbought and oversold price zones. Orders are placed with the usual take profit and stop loss. The characteristic features of the expert Presets ready to use on eurusd M5 No dangerous trading methods are used Works after optimization on the mo
FREE
The Effect indicator shows the points of potential market reversal. Simple, visual and efficient trend detection. Ready-made trading system. The intelligent algorithm of the indicator determines the trend with good probability. Uses just one parameter for settings. The indicator does not redraw and does not lag. Works on all currency pairs and all timeframes. You should remember that using a combination of forecasting tools, it is advisable to choose 2-3 indicators for trading. Otherwise, the
Pivot Points is used by traders to objectively determine potential support and resistance levels. Pivots can be extremely useful in Forex since many currency pairs usually fluctuate between these levels. Most of the time, price ranges between R1 and S1. Pivot points can be used by range, breakout, and trend traders. Range-bound Forex traders will enter a buy order near identified levels of support and a sell order when the pair nears resistance. But there are more one method to determine Pivot p
The Wamek Support and Resistant (WSR) Indicator is a remarkable tool that stands out in the world of technical analysis. It sets itself apart by cleverly combining price action and leading indicators to delineate support and resistance levels with a high degree of accuracy. Its unique feature is its adaptability; users can fine-tune the indicator by adjusting input parameters, enabling them to create customized support and resistance levels that suit their trading strategies. Notably, one of WSR
Dynamic Price Volatility Indicator (DPVI) The Dynamic Price Volatility Indicator (DPVI) is designed to provide traders with valuable insights into market volatility and potential price movements. It combines elements of volatility analysis and trend identification to assist traders in making informed trading decisions. Features: Dynamic Volatility Bands: utilizes a proprietary algorithm to calculate dynamic volatility bands that adjust in real-time based on market conditions. These bands act
FREE
Description of Using the Dynamic HL Breakouts Indicator The Dynamic HL Breakouts indicator is a technical tool designed for trading trend-following assets. Its main purpose is to help traders identify key entry and exit points during strong trending periods of an asset. Components of the Dynamic HL Breakouts Indicator Highs and Lows This indicator calculates and displays the High and Low values for a specified period (e.g., the past 20 days) to create a price movement range for the asset. These
Considering the main theories of Forex (Dow Theory, support lines, chart patterns, and Fibonacci retracements), It tells you the price range where whales (large investors) are likely to appear. You can trade at the price points that professionals also aim for. You no longer have to warry about where to aim next. We are live-streaming the actual operation of the system. Please check for yourself if it is usable. Please check it out for yourself. https://www.youtube.com/@ganesha_forex We do no
XFibo Auto Fibonacci
Welinton Dos Reis Goncalves
Use with disciplined risk management. Fibonacci entry system based on the golden zone 38.2 - 61.8 where the entry is confirmed at 23.6 with indications of Take Profit 3:1. Automatically plotted Fibonacci contains retracement and expansion Fibonacci in a single indicator. Up to 77% win rate with this system. FTMO challenge pass with 0.50% risk and 1.50% R:R.
Moving pivot Average Fibonacci The  indicator compares the selected period with its counterpart from the previous period. The indicator determines the moving Fibonacci levels for the day or any time interval to assess the price movement range from the time average. The indicator helps predict the expected high or low for the day based on historical time data. The pivot line can be considered an average trend line and use it in a variety of trading strategies. If you have any question about t
According to the law of nature which states that everything is a vibration, I have built this measurement model and which detects the best frequencies in the movement of the price, so just adjust the frequency in the input parameter of the candlestick watcher how are they arranged on the level lines (support/resistance). Lists of good frequencies   :   236, 369,417,528, 618,741,963,1236,1484.   You can also search for the frequency that suits your asset! just use the parameter:   frequency
Market Structure Break Out for MT4をご紹介します – あなたのプロフェッショナルなMSBおよび不破のゾーンインジケータ  mql5コミュニティの  Koala Trading Solution Channel  に参加して、Koalaのすべての製品に関する最新情報を入手しましょう。参加リンクはこちら: https://www.mql5.com/en/channels/koalatradingsolution Market Structure Break Out: 市場の波に対する純粋な分析の方法 このインジケータは市場の構造と動きの波を描画し、最適なMSBまたは市場構造のブレイクアウトを見つけるために設計されています。市場が動き、最近の構造を破ると、そのブレイクアウトの要因がどれくらい重要かを判断し、特定の要因よりも大きい場合、そのブレイクアウトは確認されたものと見なすことができます。このツールでは4つの重要なケースがあります:  市場構造の波  確認された構造のブレイクアウト、および  未破壊のサプライとデマンドゾーン。 再タッチおよび再確認
I recommend you to read the   product's blog  (manual) from start to end so that it is clear from the beginning what the indicactor offers. This multi time frame and multi symbol indicator can identify the following 5 crosses: when a fast moving average crosses a slow moving average line. when price has reached a single moving average (closed above/below or just bounced). when a triple moving average formation has appeared (all 3 MA:s in consecutive alignment). when the MACD main line crosses t
TRENDIEST TREND LINE   ️️️️️ Do you want to become a constantly profitable 5-star forex trader? ️️️️️ Trendiest Trend Line is a one of a kind trend line indicator, Trend lines work until the market reverses or consolidates. Easily stay out of the chop and stay in the long trends! Key Features of Trendiest Trend Line Stay in strong trends longer with confidence Clearly shows you when the market is ranging to save you money Entry signals help you get in at a good price 100% reliable
Chart Projection
Lorentzos Roussos
4.64 (61)
チャート投影インジケーター チャンネルに参加し 、レビューを書き、YouTube でチャンネル登録し 、動画を高く評価してください。ありがとう チャートの予測は、組み込みのジグザグテクニカルインジケーターを使用して将来の価格アクションを予測する小さなインジケーターとして始まりました(古いアルゴリズムはコメントで見つけることができます) アイデアは単純で、 過去の価格行動は未来に変換されませんが、過度に具体的、または過度に一般的でない場合は、何が起こる可能性があるかについてのガイドラインを抽出できます。 チャート投影の「論文」はこれです: トレーダーはチャートを見て決定を下すので、アルゴリズムはチャートも見ることができます。指標値を読み取らない、価格を読み取らないが、チャートを見る 何かを探すことは、繰り返しのなじみのあるパターンを見つけることです。そして、そのなじみのあるパターンを見つけるためには、それを保存する必要があります。 ジグザグはそれだけでは不十分であり、それを実行し、チャートの視覚的側面に関するデータを保持する新しいアルゴリズムが必要でした。したがって、光学ア
FREE
Evolution Marvel EURCHF Expert Advisor uses independent strategies, including trading on short-term and long-term trends! Trades on the eurchf m5 currency pair by default! Rent for a month is a little. The system sometimes stands still in terms of profitability and if you conduct a test, you can see it. At the time of loading Evolution Marvel EURCHF to the market, the EA was updated and will now make more transactions than initially on the signal! The EA opens a maximum of 3 positions in one
The indicator draws lines based on the price Highs and Lows, as well as slant trend lines. Break through the trend line, High or Low usually indicates trend change (or continuation). Once the price moves through a line, and the candlestick closes, the indicator draws an appropriate arrow (also, you can enable alerts). This indicator is easy to use, but nevertheless, there are many trading strategies, which are based on a breakthrough of the trend lines. The number of candlesticks used to determi
このプロダクトを購入した人は以下も購入しています
Gann Made Easy は、ミスター・ギャンの理論を使用した取引の最良の原則に基づいた、プロフェッショナルで使いやすい外国為替取引システムです。 W・D・ガン。このインジケーターは、ストップロスとテイクプロフィットレベルを含む正確な買いと売りのシグナルを提供します。 PUSH通知を利用して外出先でも取引可能です。 購入後はご連絡ください!私の取引のヒントと素晴らしいボーナスインジケーターを無料で共有します! おそらく、ギャンの取引手法についてはすでに何度も聞いたことがあるでしょう。通常、ギャンの理論は初心者のトレーダーだけでなく、すでにある程度の取引経験がある人にとっても非常に複雑なものです。なぜなら、ギャンの取引手法は理論的にはそれほど簡単に適用できるものではないからです。私はその知識を磨き、最良の原則を私の外国為替インジケーターに組み込むために数年を費やしました。 このインジケーターは非常に簡単に適用できます。必要なのは、それをチャートに添付し、簡単な取引推奨事項に従うだけです。このインジケーターは常に市場分析の仕事を行い、取引の機会を探します。適切なエントリーポイントを検出
Gold Stuff
Vasiliy Strukov
4.9 (270)
Gold Stuff は、金専用に設計されたトレンド指標であり、あらゆる金融商品にも使用できます。 インジケーターは再描画せず、遅れません。 推奨時間枠 H1. それインディケータでフルオートExpert Advisor EA Gold Stuffが動作します。 あなたは私のプロフィールでそれを見つけることができます. 設定と個人的なボーナスを得るために、購入後すぐに私に連絡してください! トレンド スキャナーの強力なサポートを利用して、無料のインジケーターを入手し、プライバシーを守ります。あーみー!   設定 矢印を描く - オンオフ。 チャートに矢印を描く。 アラート - 可聴アラートのオンオフ。 メール通知 - オンオフ。 電子メール通知。 プチ通知 - オンオフ。 プッシュ通知。 次に、色域を調整します。 Gold Stuff は、金専用に設計されたトレンド指標であり、あらゆる金融商品にも使用できます。 インジケーターは再描画せず、遅れません。 推奨時間枠 H1. それインディケータでフルオートExpert Advisor EA Gold Stuff
Trend Punch
Mohamed Hassan
4.91 (23)
This indicator is unstoppable when combined with our other indicator called  Support & Resistance . After purchase, send us a message and you will get it   for  FREE as a BONUS! Introducing Trend Punch , the revolutionary forex trend indicator that will transform the way you trade! Trend Punch is uniquely designed to provide precise buy and sell arrows during strong market trends, making your trading decisions clearer and more confident. Whether you're trading major currency pairs or exotic sym
製品を購入する前に、以下の情報をお読みください。 Apollo Pips PLUS SP はユニークな製品です。これは、私の新しい「アポロ ピップス」インジケーターと、私のすべての取引インジケーターにアクセスできる「スーパー パック」ボーナスを手に入れたい人のためのものです。 Apollo Pips PLUS SP 製品を購入すると、実際には私の Apollo Pips インジケーターのまったく新しいバージョンを購入することになります。このバージョンのインジケーターには改良されたアルゴリズムと使いやすいパラメーターがあり、あらゆる市場およびあらゆる取引スタイルでインジケーターを使用する機会が得られます。 この製品の購入者は、私のスーパーボーナスとして、他のすべてのインジケーターにも無料でアクセスできます!私のすべての取引ツールにアクセスしたい場合は、この製品が最適です!:) しかし、これがすべてではありません!:) この製品のすべての購入者は、私の新しいインジケーターを無料で入手する資格もあります!:)新しい取引インジケーターを利用できるようになりました。私の特権のある「スーパー パッ
An exclusive indicator that utilizes an innovative algorithm to swiftly and accurately determine the market trend. The indicator automatically calculates opening, closing, and profit levels, providing detailed trading statistics. With these features, you can choose the most appropriate trading instrument for the current market conditions. Additionally, you can easily integrate your own arrow indicators into Scalper Inside Pro to quickly evaluate their statistics and profitability. Scalper Inside
Please contact me after purchase to immediately get your PDF strategy + documentation for Trend Pulse !  Official release price of $89  (2 /50 copies left). Next price is $199 . Introducing Trend Pulse , a unique and robust indicator capable of detecting bullish, bearish, and even ranging trends! Trend Pulse uses a special algorithm to filter out market noise with real precision. If the current symbol is moving sideways, Trend Pulse will send you a ranging signal, letting you know that it'
mql5と Telegramの モーニング・ブリーフィングで、詳細とスクリーンショットを含む毎日のマーケット・アップデートをご覧 ください! FX Power MT4 NGは 、長年の人気を誇る通貨強度計FX Powerの次世代モデルです。 この次世代ストレングスメーターは何を提供するのでしょうか?初代FXパワーの魅力すべて プラス GOLD/XAUの強さ分析 より正確な計算結果 個別に設定可能な分析期間 カスタマイズ可能な計算上限値により、さらに優れたパフォーマンスを実現 もっと見たい人のための特別なマルチインスタンス設定 すべてのチャートでお好みの色を無限に設定可能 数え切れないほどの通知オプションにより、重要なことを見逃すことはありません。 Windows 11とmacOSのスタイルで角を丸くした新しいデザイン 魔法のように動くインジケーターパネル FXパワーの主な機能 すべての主要通貨の強さの完全な履歴 すべての時間枠における通貨の強さの履歴 すべてのブローカーとチャートで同一の計算結果 100%信頼できるリアルタイム計算 -> リペイントなし ドロップダウン・リストから
TPSpro TREND PRO は 、市場を自動的に分析し、トレンドとその各変化に関する情報を提供し、再描画せずに取引に参加するためのシグナルを提供するトレンド指標です。 インディケータは各ローソク足を使用し、個別に分析します。さまざまなインパルス(アップまたはダウンインパルス)を指します。通貨、仮想通貨、金属、株、指数の取引への正確なエントリーポイント! バージョンMT5                   インジケーターの完全な説明   インジケーター -   RFI LEVELS と併用することをお勧めします。 主な機能: レンダリングなしで正確な入力信号! シグナルが表示された場合、それは関連性を維持します。これは、シグナルを提供してからそれを変更する可能性があり、入金時の資金の損失につながる可能性があるリドローインジケーターとの重要な違いです。より高い確率と精度で市場に参入できるようになりました。矢印が表示された後、ターゲットに達する (利益確定) か反転シグナルが表示されるまで、ローソク足を色付けする機能もあります。 STOP LOSS / TAKE PROFIT
まず第一に、この取引インジケーターは再描画されず、再描画されず、遅延しないことを強調する価値があります。これにより、手動取引とロボット取引の両方に理想的なものになります。 ユーザーマニュアル:設定、入力、戦略。 アトミックアナリストは、価格の強さとモメンタムを利用して市場でより良いエッジを見つけるためのPA価格アクションインジケーターです。ノイズや誤ったシグナルを除去し、取引ポテンシャルを高めるための高度なフィルターを備えています。複雑なインジケーターの複数のレイヤーを使用して、アトミックアナリストはチャートをスキャンし、複雑な数学的計算をシンプルなシグナルと色に変換します。これにより、どのような初心者トレーダーでも理解して使用し、一貫した取引の決定を行うことができます。 「アトミックアナリスト」は、新規および経験豊富なトレーダー向けにカスタマイズされた包括的な取引ソリューションです。プレミアムインジケーターとトップノッチの機能を1つの取引戦略に組み合わせ、すべてのタイプのトレーダーにとって汎用性のある選択肢にします。 デイリートレーディングとスキャルピング戦略:高
Trend Screener
STE S.S.COMPANY
4.82 (92)
トレンドインジケーター、1つのツールに組み込まれたすべての重要なトレンド機能を備えたトレンドトレーディングとフィルタリングのための画期的なユニークなソリューション! これは、すべてのシンボル/商品(外国為替、商品、暗号通貨、インデックス、株式)で使用できる100%再描画されていないマルチタイムフレームおよびマルチ通貨インジケーターです。 トレンドスクリーナーは、チャート内のドットで矢印トレンドシグナルを提供するインジケーターに続く効率的なインジケーターです。 トレンド分析インジケーターで使用できる機能: 1.トレンドスキャナー。 2.最大利益分析を備えたトレンドライン。 3.トレンド通貨強度メーター。 4.アラート付きのトレンド反転ドット。 5.アラート付きの強いトレンドドット。 6.トレンド矢印 毎日の分析例、毎日のシグナルパフォーマンス...など、トレンドスクリーナーインジケーターを使用して、ここで見つけることができます: ここをクリックしてください 期間限定オファー:トレンドスクリーナーインジケーターは、50ドルと生涯でのみご利用いただけます。 (元の価格125 $) MQ
Gold Channel is a volatility-based indicator, developed with a specific timing algorithm for the XAUUSD pair, which consists of finding possible corrections in the market. This indicator shows two outer lines, an inner line (retracement line) and an arrow sign, where the theory of the channel is to help identify overbought and oversold conditions in the market. The market price will generally fall between the boundaries of the channel. If prices touch or move outside the channel it is a tra
通貨強さウィザードは、取引を成功させるためのオールインワン ソリューションを提供する非常に強力な指標です。このインジケーターは、複数の時間枠のすべての通貨のデータを使用して、このまたはその外国為替ペアのパワーを計算します。このデータは、使いやすい通貨インデックスと通貨パワーラインの形式で表され、特定の通貨のパワーを確認するために使用できます。 必要なのは、取引したいチャートにインジケーターを接続することだけです。インジケーターは、取引する通貨の実際の強さを示します。このインジケーターは、トレンドに合わせて取引するときに有利に利用できる売買高の圧力の極値も示します。このインジケーターには、フィボナッチに基づく可能なターゲットも表示されます。 このインジケーターは、PUSH 通知を含むあらゆるタイプのアラートを提供します。 購入後ご連絡下さい。私の取引のヒントをあなたと共有し、素晴らしいボーナスインジケーターを無料で提供します! 幸せで有益な取引をお祈りします。
現在20%OFF! 初心者やエキスパートトレーダーのためのベストソリューション! このダッシュボードソフトウェアは、28の通貨ペアで動作しています。それは私達の主要な指標(高度な通貨の強さ28と高度な通貨インパルス)の2に基づいています。それは全体の外国為替市場の大きい概観を与えます。それは、すべての(9)時間枠で28の外国為替ペアのための高度な通貨の強さの値、通貨の動きの速度と信号を示しています。チャート上で1つのインディケータを使用して市場全体を観察し、トレンドやスキャルピングの機会をピンポイントで見つけることができたら、あなたのトレードがどのように改善されるか想像してみてください。 このインディケータには、強い通貨と弱い通貨の識別、潜在的な取引の識別と確認がより簡単になるような機能が搭載されています。このインディケータは、通貨の強さや弱さが増加しているか減少しているか、また、すべての時間枠でどのように機能しているかをグラフィカルに表示します。 新機能として、現在の市場環境の変化に適応するダイナミックなマーケットフィボナッチレベルが追加され、すでに当社のAdvan
- Real price is 80$ - 40% Discount ( It is 49$ now ) Contact me for instruction, any questions! Introduction The breakout and retest strategy is traded support and resistance levels. it involves price breaking through a previous level.  The break and retest strategy is designed to help traders do two main things, the first is to avoid false breakouts. Many false breakouts start with a candlestick that breaks out of a level but ends with an immediate candlestick that brings the price back into t
PZ Day Trading
PZ TRADING SLU
3.67 (3)
このインディケータは、価格アクション分析とドンチャンチャネルのみを使用して、ジグザグ方式で価格の反転を検出します。再描画やバックペインティングを一切行わずに、短期取引向けに特別に設計されています。それは彼らの操作のタイミングを増やすことを目指している賢明なトレーダーにとって素晴らしいツールです。 [ インストールガイド | 更新ガイド | トラブルシューティング | よくある質問 | すべての製品 ] 驚くほど簡単に取引できます すべての時間枠で価値を提供します 自己分析統計を実装します 電子メール/音声/視覚アラートを実装します 可変長のブレイクアウトと混雑ゾーンに基づいて、インディケータは価格アクションのみを使用して取引を選択し、市場が非常に高速に行っていることに反応します。 過去のシグナルの潜在的な利益が表示されます この指標は、独自の品質とパフォーマンスを分析します 負けブレイクアウトは強調表示され、説明されます インジケータは、非バックペインティングおよび非再ペイントです この指標は、日中のトレーダーが単一の価格反転を見逃さないようにするのに役立ちます。ただし、す
Clear Breakout
Martin Alejandro Bamonte
5 (1)
「Breakout Buy-Sell」インジケーターは、異なる市場セッション(東京、ロンドン、ニューヨーク)での価格ブレイクアウトに基づいて、潜在的な売買機会を識別し、強調するために設計されています。このインジケーターは、トレーダーが買いゾーンと売りゾーン、および利益確定(TP)とストップロス(SL)レベルを明確に視覚化するのに役立ちます。 使用戦略 インジケーターは以下のように使用できます: 初期設定 :市場セッションを選択し、GMTオフセットを調整します。 市場の視覚化 :各セッションの開始時に描かれるブレイクアウトボックスを観察します。これらのボックスは期間の高値と安値を示します。 売買シグナル :ボックスの高値を超えた場合は買いシグナルと見なされます。安値を下回った場合は売りシグナルと見なされます。 リスク管理 :TP1、TP2、TP3、およびSLレベルを使用してポジションを管理します。TPレベルは異なる利益目標のために設計されており、SLは不利な動きに対する保護を保証します。 応用戦略 このインジケーターを最大限に活用するために、以下の戦略が推奨されます: ロンドンセッション
現在26%オフ 初心者やエキスパートトレーダーに最適なソリューション! このインジケーターは、独自の機能と新しい計算式を取り入れた、ユニークで高品質、かつ手頃な価格のトレーディングツールです。たった1枚のチャートで28の為替ペアの通貨強度を読み取ることができます。新しいトレンドやスキャルピングチャンスの引き金となるポイントを正確に特定することができるので、あなたのトレードがどのように改善されるか想像してみてください。 ユーザーマニュアルはこちら  https://www.mql5.com/en/blogs/post/697384 これが最初の1本、オリジナルだ! 価値のないクローンを買わないでください。 特別な サブウィンドウの矢印で強い通貨の勢いを表示 GAPがあなたのトレードを導く! 基準通貨や気配値が売られすぎ・買われすぎのゾーン(外相フィボナッチレベル)にあるとき、個別チャートのメインウィンドウに警告表示。 通貨がレンジの外側から反落した場合、プルバック/リバーサルのアラート。 クロスパターンの特別なアラート 複数の時間枠を選択可能で、トレンドを素早く
PRO Renko Systemは、特別にRENKOチャートを取引するために設計された高精度の取引システムです。 これは、様々な取引商品に適用することができる普遍的なシステムです。 システムは効果的に正確な逆転信号へのアクセスを与えるいわゆる市場の騒音を中和する。 表示器は非常に使いやすく、信号の生成に責任がある1つの変数だけがあります。 あなたは簡単にお好みの任意の取引ツールとレンコバーのサイズにツールを適応させることができます。 私はいつもあなたが私のソフトウェアで収益性の高い取引を支援するために余分なサポートを提供する準備ができています! 私はあなたに幸せで収益性の高い取引をしたいです! ご購入後にご連絡ください! 私はあなたに私のレンコチャートジェネレータを送信します。 私はまた、私の個人的な推奨事項やシステムの他のモジュールを無料で共有します!
まず第一に、この取引ツールはノンリペイント、ノンリドロー、ノンラグの指標であり、プロの取引に理想的ですことを強調する価値があります。 オンラインコース、ユーザーマニュアル、デモ。 スマートプライスアクションコンセプトインジケーターは、新米から経験豊富なトレーダーまで、非常 に強力なツールです。Inner Circle Trader AnalysisやSmart Money Concepts Trading Strategiesなど、20以上の有用な指標を1つに組み合わせています。このインジケーターはスマートマネーコンセプトに焦点を当て、大手機関の取引方法を提供し、彼らの動きを予測するのに役立ちます。 特に、流動性分析に優れており、機関がどのように取引しているかを理解しやすくしています。市場のトレンドを予測し、価格の動きを慎重に分析するのに優れています。機関の戦略とトレードを合わせることで、市場の動向についてより正確な予測ができます。このインジケーターは多目的であり、市場構造を分析し、重要な注文ブロックを特定し、さまざまなパターンを認識するのに優れています。 このインジケー
現在31%オフ! 初心者やエキスパートトレーダーに最適なソリューション! このインジケータは、独自の機能と秘密の数式を組み込んだ、ユニークで高品質かつ手頃な価格のトレーディングツールです。たった1枚のチャートで28の通貨ペアのアラートを表示します。新しいトレンドやスキャルピングチャンスの引き金となるポイントを正確に把握することができるので、あなたのトレードがどのように改善されるか想像してみてください! 新しい基本的なアルゴリズムに基づいて構築されているため、潜在的な取引の特定と確認がより簡単になります。これは、通貨の強さや弱さが加速しているかどうかをグラフィカルに表示し、その加速のスピードを測定するためです。加速すると物事は明らかに速く進みますが、これはFX市場でも同じです。つまり、反対方向に加速している通貨をペアにすれば、利益を生む可能性のある取引を特定することができるのです。 通貨の勢いを示す縦の線と矢印は、あなたの取引の指針となるでしょう。 ダイナミックマーケットフィボナッチ23レベルはアラートトリガーとして使用され、市場の動きに適応します。もしインパルスが黄色
IX Powerは 、FX Powerの無敵の精度をついにFX以外のシンボルにも提供します。 お気に入りの指数、株式、コモディティ、ETF、さらには暗号通貨の短期、中期、長期のトレンドの強さを正確に判断します。 お使いの端末が提供する すべてを分析する ことができます。ぜひお試しいただき、取引 タイミングが大幅に改善 されることをご体験ください。 IXパワーの主な特徴 100%正確で再描画されない計算結果 - ターミナルで利用可能なすべての取引シンボルに対して 予め設定され、さらに個別に設定可能な強度分析期間のドロップダウン選択 Eメール、メッセージ、モバイル通知による無数の通知オプション EAリクエストのためのアクセス可能なバッファ カスタマイズ可能な計算制限により、さらに優れたパフォーマンスを実現 もっと見たい人のための特別なマルチインスタンス設定 すべてのチャートでお好みの色を無限に設定可能 Windows 11とmacOSのスタイルで角を丸くした新しいパネルデザイン サブ・ウィンドウとメイン・チャートの間をシームレスに移動する、魔法のように動く
Advanced Supply Demand
Bernhard Schweigert
4.9 (314)
現在33%オフ 初心者にもエキスパートトレーダーにも最適なソリューション このインジケーターは独自の機能と新しい公式を多数内蔵しており、ユニークで高品質かつ手頃な取引ツールです。このアップデートでは、2つの時間枠ゾーンを表示できるようになります。より長いTFだけでなく、チャートTFとより長いTF(ネストゾーンを表示)の両方を表示できます。すべてのSupply Demandトレーダーの皆さんのお気に召すはずです。:) 重要情報の公開 Advanced Supply Demandの可能性を最大化するには、 https://www.mql5.com/ja/blogs/post/720245 にアクセスしてください。   エントリーまたはターゲットの正確なトリガーポイントを正確に特定できれば取引がどのように改善されるか想像してみてください。新しい基盤となるアルゴリズムに基づいて構築されているため、買い手と売り手の間の潜在的な不均衡をさらに簡単に特定できます。これは、最も強い需要と供給のゾーンと、過去のパフォーマンス(古いゾーンを表示)がグラフィカルに表現されるためです。これらの機能は、最適
NAM Order Blocks
NAM TECH GROUP, CORP.
5 (1)
MT4マルチタイムフレームオーダーブロック検出インジケーター。 特徴 -チャートコントロールパネルで完全にカスタマイズ可能で、完全な相互作用を提供します。 -必要な場所でコントロールパネルを表示および非表示にします。 -複数の時間枠でOBを検出します。 -表示するOBの数量を選択します。 -さまざまなOBユーザーインターフェイス。 -OBのさまざまなフィルター。 -OB近接アラート。 -ADRの高線と低線。 -通知サービス(画面アラート|プッシュ通知)。 概要 注文ブロックは、金融機関や銀行からの注文収集を示す市場行動です。著名な金融機関と中央銀行が外国為替市場を牽引しています。したがって、トレーダーは市場で何をしているのかを知る必要があります。市場が注文ブロックを構築するとき、それは投資決定のほとんどが行われる範囲のように動きます。 注文の構築が完了すると、市場は上向きと下向きの両方に向かって急激に動きます。注文ブロック取引戦略の重要な用語は、機関投資家が行っていることを含むことです。それらは主要な価格ドライバーであるため、機関投
Enigmera
Ivan Stefanov
5 (4)
エニグメラ:市場の中核 https://www.enigmera.com はじめに このインディケータと取引システムは、金融市場に対する驚くべきアプローチです。ENIGMERAは、フラクタルサイクルを使用して、サポートとレジスタンスレベルを正確に計算します。本格的な蓄積局面を示し、方向性と目標を示します。 トレンド中でも調整中でも機能するシステムです。 どのように作動するのか? ENIGMERAは、支持線・抵抗線、目標線、乖離線の3つのラインで構成されています。このシステムは、過去のデータを現在と未来に外挿する典型的な市場指標とは異なり、現在の完全な画像を提供します。支持線上にある場合、それは本当の支持を意味し、抵抗線上にある場合、それは本当の抵抗を意味する。ある水準が破られた場合、それはトレンドの変化を意味する。再描画はしない。 市場は常に進化しているため、ENIGMERAはその評価ツールを適応させ、定期的に戦略を修正しています。  これにより、すべてのシナリオが徹底的に評価されることが保証されます。この市場指標の独自性は、その能力を見れば明らかです。  ENIGM
トレンドトレーディング は、タイミングのプルバックとブレイクアウトにより、市場で起こっているトレンドから可能な限り利益を得るように設計された指標です。確立されたトレンドの中で価格が何をしているかを分析することにより、取引の機会を見つけます。 [ インストールガイド | 更新ガイド | トラブルシューティング | よくある質問 | すべての製品 ] 自信を持って効率的に金融市場を取引する むち打ちにならずに確立されたトレンドから利益を得る 収益性の高いプルバック、ブレイクアウト、早期の逆転を認識する この指標は、独自の品質とパフォーマンスを分析します 複数時間枠のダッシュボードを実装します インジケーターは再描画されていません 電子メール/音声/視覚アラートを実装します 確立されたトレンドは多くの取引機会を提供しますが、ほとんどのトレンド指標はそれらを完全に無視しています。インジケーターの解釈はかなり簡単です: (1) トレンドの変化 (2) トレンドの方向への後退 (3) トレンドの方向へのブレイクアウト 赤いダッシュ は下降トレンド中の修正です 青いダッシュ は上昇ト
最初のパルスレベルを反転 (RFI)     指示する     ロシア     -        utilizar con   el indicador の ESP 推奨事項 -   TPSpro トレンド プロフェッショナル版 -   MT5のバージョン 最も重要なことは、将来においても最も重要なことです。 機能のプリンシパル: ゾーンのほとんどは、ベンダーとコンプラドールによってアクティブ化されます。 状況を直感的に把握できるよう、初期の衝動を修正します。 LOGIC AI: MUESTRA zonas (círculos) parabuscar puntos de entrada cuando se activa una plantilla 視覚的に優れた視覚効果があり、最も重要な機能がすべて揃っていることに注意してください。 優れたニベレス/ゾーンの視覚化 (modo MTF) 世界で最も人気のある場所/ゾーンです。これを使用するのに最適な方法です (   TPSproTREND PRO   )。 アルゴリズム プロフェッショナル セパラド パソ ア パソ パラ オペラ それは
Scalper Vault は、スキャルピングを成功させるために必要なすべてを提供するプロフェッショナルなスキャルピング システムです。このインジケーターは、外国為替およびバイナリー オプションのトレーダーが使用できる完全な取引システムです。推奨される時間枠は M5 です。 システムは、トレンドの方向に正確な矢印シグナルを提供します。また、トップとボトムのシグナルとギャン マーケット レベルも提供します。 インジケーターは、プッシュ通知を含むすべてのタイプのアラートを提供します。 インジケータの購入後にご連絡ください。私の個人的な取引の推奨事項と素晴らしいボーナス指標を無料で共有します! 幸せで有益な取引をお祈りします!
M1 Arrow
Oleg Rodin
4.73 (15)
市場の2つの基本原則に基づく日中戦略。 このアルゴリズムは、追加のフィルターを使用したボリュームと価格の波の分析に基づいています。インディケータのインテリジェントアルゴリズムは、2つの市場要因が1つに結合した場合にのみシグナルを出します。インディケータは、より高い時間枠のデータを使用して、M1チャート上の特定の範囲の波を計算します。そして波を確認するために、インジケーターはボリュームによる分析を使用します。 このインディケータはレディトレーディングシステムです。トレーダーが必要とするのは、信号に従うことだけです。また、インジケーターはあなた自身の取引システムの基礎になることができます。取引はミニッツチャートでのみ行われます。 インジケーターがMTFの原則を使用しているという事実にもかかわらず、インジケーターのアルゴリズムは可能な限り安定しています。 購入後、必ず私に書いてください!私の取引設定と推奨事項をあなたと共有します!
Order Block Hunter
Noha Mohamed Fathy Younes Badr
5 (2)
Order block hunter indicator is the best indicator for  hunt the order blocks that area where there has been a large concentration of limit orders waiting to be executed Order blocks are identified on a chart by observing previous price action and looking for areas where the price experienced significant movement or sudden changes in direction .This indicator does that for you by using very complicated codes and helps you to take the best areas To buy and sell because it make marks at the best a
`All in One Chart Patterns` チャートパターンはトレーダーの間で議論の的となっています。信頼できるシグナルだと考える人もいれば、そうでないと考える人もいます。当社の「Chart Patterns All-in-One」インジケーターは、これらのパターンを表示し、自分自身で理論を検証できるようにします。これらのパターンの収益性は、インジケーターの有効性を反映するものではなく、むしろパターン自体の評価です。「Chart Patterns All-in-One」インジケーターは、これらのパターンを視覚化するための優れたツールであり、取引戦略における有効性について自分自身で結論を下すことができます。 このインジケーターは、複数のチャートパターンを1つの統合ツールに組み合わせて、MetaTrader 4 (MT4) で使用します。チャートから直接各パターンをオンまたはオフに切り替える機能を提供し、カスタマイズ可能で効率的な分析を可能にします。以下は、インジケーターとその中に含まれるパターンの詳細な説明です。 #### 含まれるパターン: 1. **パターン
作者のその他のプロダクト
を読むことをお勧めします     製品のブログ (マニュアル) 最初から最後まで     EA が提供するものは最初から明らかです。 このエキスパートアドバイザー (EA) の主な戦略は、3 つの移動平均 (MA) が連続して整列し、互いに一定の距離にある場合に取引を行うことです (たとえば、一部の機関投資家が使用するあまり知られていない戦略に使用できます)。 、これには D1 時間枠の MA 10、20、および 30 が含まれます)。 EA は、H1 以降の時間枠で最適に機能します。トリプル MA 戦略 (使用される MA: に関係なく) は、長期的な戦略と見なす必要があります。悪い月が続くかもしれません。したがって、この EA は、頻繁な取引と短期的な一定の利益を求めるトレーダー向けではありません。デフォルト設定は EURUSD H1 用に最適化されています (2015.01.01 から 2022.12.29 までのバックテスト、224 回の取引、つまり週平均 0.52 回の取引)。   ここで 信号を監視します (D1 時間枠に異なる設定を使用)。 また、2 MA:s の通常の
このマルチタイムフレームとマルチシンボルインジケーターは、次の5つのクロスを識別できます。 動きの速い平均が動きの遅い平均線と交差するとき。 価格が単一の移動平均に達したとき(上/下で閉じているか、ちょうど跳ね返った)。 三重移動平均フォーメーションが出現したとき(3つのMAすべてが連続して整列) MACDメインラインがシグナルラインと交差するとき。 信号線がMACDzero(0)線と交差するとき。 このインジケーターを独自のルールや手法と組み合わせると、独自の強力なシステムを作成(または強化)できます。 特徴 マーケットウォッチウィンドウに表示されている選択したシンボルを同時に監視できます。インジケーターを1つのチャートに適用し、市場全体を即座に監視します。 M1からMNまでのすべての時間枠を監視でき、クロスオーバーが識別されたときにリアルタイムのアラートを送信します。すべてのアラートタイプがサポートされています。 追加のトレンドフィルターとしてRSIを使用できます。 インジケータには、インタラクティブパネルが含まれています。アイテムをクリックすると、問題のシンボルと時間枠で新しいチ
The indicator identifies when a divergence occurs between price and an indicator or oscillator. It identifies both regular and hidden divergences. Combined with your own rules and techniques, this indicator will allow you to create (or enhance) your own powerful system. Features Can detect divergences for the following oscillators/indicators:   MACD, OsMA, Stochastics, RSI, CCI, RVI, Awesome, ADX, ATR, OBV, Composite index, MFI and Momentum. Only one oscillator/indicator can be selected. Draws
FREE
This multi indicator/oscillator (hereafter indicator), multi time frame and multi symbol indicator identifies when a divergence occurs between price and one, two or three indicators. It identifies both regular/classical (trend reversal) and hidden (trend continuation) divergences. It has RSI and MA trend filter options which makes it possible to filter out only the strongest setups. Combined with your own rules and techniques, this indicator will allow you to create (or enhance) your own powerfu
This multi time frame and multi symbol indicator identifies fractals patterns. As a bonus it can also scan for Parabolic SAR (pSAR) trend changes. Combined with your own rules and techniques, this indicator will allow you to create (or enhance) your own powerful system. Features Can monitor all symbols visible in your Market Watch window at the same time. Apply the indicator to just one chart and instantly monitor the entire market. Can monitor every time frame, from M1 to MN, and sends you a
このマルチタイムフレームとマルチシンボルインジケーターは、ダブルトップ/ボトム、ヘッド&ショルダー、ペナント/トライアングル、フラグパターンを識別します。ネックライン/トライアングル/旗竿のブレイクアウトが発生した場合にのみアラートを設定することもできます(ネックラインブレイクアウト=上下および頭と肩の確認された信号)。     インジケーターはシングルチャートモードでも使用できます。このオプションの詳細については、製品の     ブログ 。独自のルールとテクニックを組み合わせることで、このインジケーターを使用して、独自の強力なシステムを作成(または強化)できます。 特徴 マーケットウォッチウィンドウに表示されているすべてのシンボルを同時に監視できます。インジケーターを1つのチャートに適用し、市場全体を即座に監視します。 M1からMNまでのすべての時間枠を監視でき、パターンが識別されたとき、またはブレイクアウト時にリアルタイムのアラートを送信します。すべてのMetatraderネイティブアラートタイプがサポートされています。 RSIをトレンドフィルターとして使用して、潜在的な反転を
EA が何を提供するのかを最初から明確にするために、   製品のブログ (マニュアル) を最初から最後まで読むことをお勧めします。 このエキスパートアドバイザーは、価格とオシレーター/インジケーターの間に乖離が発生する時期を特定します。これは、通常/古典的な (トレンド反転) ダイバージェンスと隠れた (トレンド継続) ダイバージェンスの両方を識別します。需要/供給ゾーン、RSI、ボリンジャー、ストキャスティクス、移動平均 (通常の MA およびハル MA)、ADX、およびボリューム フィルター オプションがあり、最も強力なセットアップのみを除外することができます。デフォルト設定は EURUSD H1 に最適化されています (以下のスクリーンショットを参照してください)。 EA には、1 つのチャートから複数のシンボルを取引する可能性があります。このオプションは 4 つの異なる方法で使用できます。 [気配値表示] ウィンドウに表示されているすべてのシンボル 入力パラメータで指定される記号 ダイアログボックスで選択したプリセットファイルのシンボル 事前定義されたフォルダー内のプリセッ
インディケータは、価格とオシレーター/インディケーターの間に発散が発生したときを識別します。これは、通常の分岐と隠れた分岐の両方を識別します。最強のセットアップのみをフィルターで除外できるRSIフィルターオプションがあります。インディケータは、巻き込みフォーメーション、ドンチアンチャネルブレイクアウト、または移動平均を超える価格を待つオプションも提供します (スクリーンショット#3を参照)     貿易機会を知らせる前に発散を確認する。独自のルールとテクニックを組み合わせることで、このインジケーターを使用して、独自の強力なシステムを作成(または強化)できます。 特徴 の終わりに     製品のブログ   インジケーターからトレードシグナルを取得するためにiCustom()関数を使用しているサンプルエキスパートアドバイザー(EA)のソースコードをダウンロードすることができます。 EAは完全に機能しますが、主な目的は、コードを使用して、独自に開発したEAに貼り付けることです。 限られた時間で   ただし、プログラミングサポートを提供することはできません。 謝罪いたします 次のオシレータ
I recommend you to read the   product's blog  (manual) from start to end so that it is clear from the beginning what the indicactor offers. This multi time frame and multi symbol divergence dashboard indicator sends an alert when one or two different divergences have been identified. It can be used with all time frames from M1 to MN. Maximum 9 time frames can be shown in the dashboard at the same time. It is possible to enable moving average, RSI or Bollinger bands trend filter to filter out on
Please if possible consider the  paid version  which I will continue to develop (there will be no future updates for this free version). This Expert Advisor identifies when a divergence occurs between price and an oscillator/indicator. It identifies both regular/classical (trend reversal) and hidden (trend continuation) divergences. It has RSI, bollinger, stochastics, moving average and ADX filter options which makes it possible to filter out only the strongest setups. The default settings ar
FREE
I recommend you to read the   product's blog  (manual) from start to end so that it is clear from the beginning what the indicactor offers. This multi time frame and multi symbol supply and demand zone dashboard indicator sends alerts when the price has reached a supply/demand zone. It is also possible to use it to be alerted about regular double tops/bottoms instead of zones. It can be used with all time frames from M1 to MN. It is possible to use RSI, divergence (MACD, OsMA, RSI or Awesome) a
I recommend you to read the   product's blog  (manual) from start to end so that it is clear from the beginning what the indicactor offers. This multi time frame and multi symbol divergence dashboard indicator sends an alert when one or two different divergences have been identified. It can be used with all time frames from M1 to MN. It is possible to enable moving average or RSI trend filter to filter out only the strongest setups. Combined with your own rules and techniques, this indicator wi
This indicator can send alerts when a Heiken Ashi Smoothed color change occurs. Combined with your own rules and techniques, this indicator will allow you to create (or enhance) your own powerful system. Features Can send all types of alerts. Option to delay the alert one or more bars in order to confirm the color (trend) change. Input parameters Candle shift for alert: Default is 1. Setting it to 0 will alert you on color change on the current candle. This should be regarded as a pending (uncon
FREE
This indicator can send alerts when a Heiken Ashi Smoothed color change occurs. Combined with your own rules and techniques, this indicator will allow you to create (or enhance) your own powerful system. Features Can send all types of alerts. Option to delay the alert one bar in order to confirm the color (trend) change. Input parameters Wait for candle close: 'true' or 'false'. Setting it to 'true' will delay the alert to the opening of the bar following the bar where the color change occurred.
FREE
The indicator identifies when a divergence occurs between price and an indicator or oscillator. It identifies bullish and bearish hidden or regular (classical) divergences. Combined with your own rules and techniques, this indicator will allow you to create (or enhance) your own powerful system. Features Can detect divergences for the following indicators/oscillators: MACD, OsMA (Moving average of Oscillator), Stochastics, RSI, CCI, RVI, Awesome (AO), ADX, ATR, OBV, MFI, Momentum and   Composi
FREE
I recommend you to read the  product's blog  (manual) from start to end so that it is clear from the beginning what the EA offers. This Expert Advisor (EA) is designed to trade on a rapid price movement following a news event. The EA trades multiple symbols from one single chart which must be a EURUSD H1 chart. It it advisable to remove all symbols you don't trade from the Market Watch to reduce the overall data demand. The 'Auto settings' input parameter value True must only be used you have s
I recommend you to read the   product's blog  (manual) from start to end so that it is clear from the beginning what the indicactor offers. This multi time frame and multi symbol indicator identifies double or triple top/bottom formations or a following neckline breakout (confirmed top/bottom). It offers RSI, pin bar, engulfing, tweezer, morning/evening star filters as well divergence filter options which makes it possible to filter out only the strongest setups. The indicator can also be used
I recommend you to read the  product's blog  (manual) from start to end so that it is clear from the beginning what the indicator offers. This multi time frame and multi symbol supply and demand zone dashboard indicator sends alerts when the price has reached a supply/demand zone. It is also possible to use it to be alerted about regular double tops/bottoms instead of zones. It can be used with all time frames from M1 to MN. Maximum 9 time frames can be shown in the dashboard at the same time. 
可能であれば購入をご検討ください   私が開発を続ける MT5 バージョン (この MT4 バージョンの今後の更新はありません)。こちらもお読みになることをお勧めします     製品のブログ (マニュアル) を最初から最後まで参照して、EA が提供するものを最初から明確にします。 このエキスパートアドバイザー (EA) の主な戦略は、3 つの移動平均 (MA) が連続して整列し、互いに一定の距離にある場合に取引を行うことです (たとえば、一部の機関投資家が使用するあまり知られていない戦略に使用できます)。 、これには D1 時間枠の MA 10、20、および 30 が含まれます)。 EA は、H1 以降の時間枠で最適に機能します。トリプル MA 戦略 (使用される MA: に関係なく) は、長期的な戦略と見なす必要があります。悪い月が続くかもしれません。したがって、この EA は、頻繁な取引と短期的な一定の利益を求めるトレーダー向けではありません。デフォルト設定は EURUSD H1 用に最適化されています (2015.01.01 から 2022.03.31 までのバックテスト、22
This multi indicator/oscillator (hereafter indicator), multi time frame and multi symbol indicator identifies when a divergence occurs between price and one, two or three indicators. It identifies both regular/classical (trend reversal) and hidden (trend continuation) divergences. It has RSI and MA trend filter options which makes it possible to filter out only the strongest setups. Combined with your own rules and techniques, this indicator will allow you to create (or enhance) your own powerfu
このマルチタイムフレームとマルチシンボルインジケーターは、ピンバー、朝/夕方の星、巻き込み、ピンセット、スリーラインストライク、インサイドバー、ペナントとトライアングルをスキャンします。 インジケーターはシングルチャートモードでも使用できます。このオプションの詳細については、製品の     ブログ 。     独自のルールとテクニックを組み合わせることで、このインジケーターを使用して、独自の強力なシステムを作成(または強化)できます。 特徴 マーケットウォッチウィンドウに表示されているすべてのシンボルを同時に監視できます。インジケーターを1つのチャートに適用し、市場全体を即座に監視します。 M1からMNまでのすべての時間枠を監視し、パターンが識別されるとリアルタイムのアラート(ポップアップ、プッシュ、またはメール)を送信します。 RSIとボリンジャーバンドをピンバー、朝/夕方の星 、巻き込み、ピンセットの形成の フィルターとして使用して、潜在的な逆転を適切に特定できます。 主要なトレンドフィルターとして移動平均を使用し、ボラティリティフィルターとしてADXを使用できます。 インジケー
I recommend you to read the   product's blog  (manual) from start to end so that it is clear from the beginning what the indicactor offers. This multi time frame and multi symbol indicator identifies double or triple top/bottom formations or a following neckline breakout (confirmed top/bottom). It offers filters for RSI overbought/oversold, candle patterns (pin bar, engulfing, tweezer, morning/evening star, three line strike) and divergences (MACD, OsMA, Awesome (AO), RSI, CCI, Stochastic) whic
このマルチタイムフレームおよびマルチシンボルインジケーターは、ストキャスティクスシグナルラインがストキャスティクスメインラインと交差する時期を識別します。代替手段として、ストキャスティクスが買われ過ぎ/売られ過ぎの領域から(シグナルラインがメインラインを横切ることなく)離れるときに警告することもできます。ボーナスとして、ボリンジャーバンドやRSIの買われ過ぎ/売られ過ぎのクロスもスキャンできます。このインジケーターを独自のルールやテクニックと組み合わせることで、独自の強力なシステムを作成 (または強化) することができます。 特徴 相場監視ウィンドウに表示されているすべてのシンボルを同時に監視できます。インジケーターを 1 つのチャートに適用すると、市場全体を瞬時に監視できます。 M1 から MN までのすべてのタイムフレームを監視でき、クロスオーバーが特定されたときにリアルタイムのアラートを送信します。すべての Metatrader ネイティブ アラート タイプがサポートされています。 インジケーターには対話型パネルが含まれています。説明については、別のスクリーンショットを参照してく
Features This is an indicator that recognizes a special type of Inside Bar formation which is formed by a Master candle followed by 4 smaller candles (please see the strategy explanation below). Plots buy/sell stop lines on the chart as well as well as take profit and stop loss levels. The TP/SL levels are based on the Average True Range (ATR) indicator. Object colors are changeable. Sends you a real-time alert when a Master candle formation is identified - sound / pop-up / email / push notifica
I recommend you to read the   product's blog  (manual) from start to end so that   it is clear from the beginning what the indicator offers. This multi oscillator, multi time frame and multi symbol indicator identifies when a divergence occurs between price and an oscillator/indicator. It identifies both regular/classical (trend reversal) and hidden (trend continuation) divergences. It has moving average, RSI/Bollinger, ADX, pin bar and engulfing filter options which makes it possible to filter
This multi symbol indicator has been designed to automatically identify when price reaches major psychological levels. Also known as round numbers, whole numbers or key levels. As a bonus it can also scan for pivot point level on one selected time frame. Combined with your own rules and techniques, this indicator will allow you to create (or enhance) your own powerful system. Features Can write the signals to a file which can be used by an Expert Advisor for auto trading. Can monitor all symbol
This multi time frame and multi symbol indicator identifies high-probability breakout patterns. It does this by identifying strong, symmetrical pennants and triangles. This pattern DOES NOT appear very often on higher time frames. But when it does, it is a very high-probability setup. The indicator also includes an Inside bars scanner. It can for example be used to detect a special type of Inside bars formation which is formed by a Master candle (MC) followed by 4 inside candles (please see the
This indicator recognizes a special type of Inside Bar formation which is formed by a big Master candle followed by 4 smaller candles (please see the strategy explanation below). Features Plots buy/sell stop lines on the chart as well as well as take profit and stop loss levels. The TP/SL levels are based on the Average True Range (ATR) indicator. Object colors are changeable. Sends you a real-time alert when a Master candle formation is identified - sound / popup / email / push notification. On
フィルタ:
cvdestyfx
2702
cvdestyfx 2020.05.17 07:49 
 

ユーザーは評価に対して何もコメントを残しませんでした

Tim Eubanks
5762
Tim Eubanks 2019.08.25 20:28 
 

Useless~

レビューに返信
バージョン 1.8 2021.09.05
*** Please always make a backup of the existing indicator (the .ex4 file) before you make an update ***

- added support for Hull moving average
バージョン 1.7 2021.02.10
*** Please always make a backup of the existing indicator (the .ex4 file) before you make an update ***

- added an option to scan for stochastics crossovers
- changed the algorithm for the ADR point ranking. The +DI and -DI lines are now used as well in the calculation. Bullish if the main line is above the level value and at the same time the +DI line is above the -DI line. Bearish if the main line is above the level value and at the same time the -DI line is above the +DI line
- added a possibility to enable writing of of global variables when point ranking has been enabled. The global variables can be used by an Expert Advisor for automatical trading.
- added a possibilty to set the scan interval in seconds. This to allow to set a higher value for slower computers.
バージョン 1.5 2020.07.21
*** Please always make a backup of the existing indicator (the .ex4 file) before you make an update ***

- added the possibility to set rectangle colors
- added Awesome and MACD (signal line). Bullish of above the zero line and vice versa
バージョン 1.4 2019.04.12
- bug fix
バージョン 1.3 2019.04.11
- added Parabolic SAR and Composite index
バージョン 1.2 2019.04.06
- added Bollinger bands and ADX
バージョン 1.1 2019.03.26
- added the possibility to add a custom text to the end of the regular alert text
- added the possbility to be alerted based on a point system instead of the color count system
- added the possibility to be alerted based on xx time frames with same color
- added the possibility to use double MA logic (2 MA:s in consecutive alignment and price above/below them)
- added an option to use symbols from the Market Watch window instead of the symbols written in the Symbols parameter