• 概要
  • レビュー (6)
  • コメント (36)
  • 最新情報

Volume by Price MT5

5

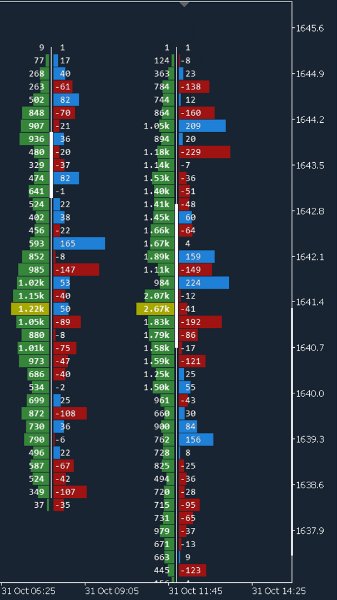
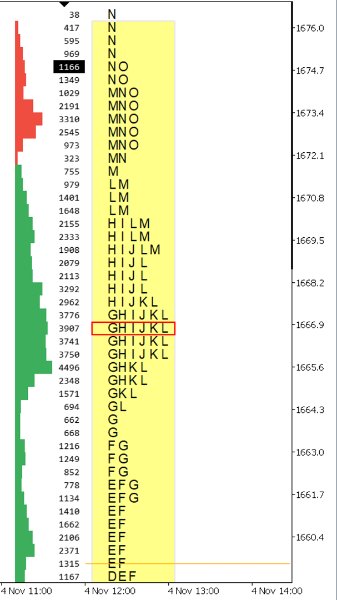
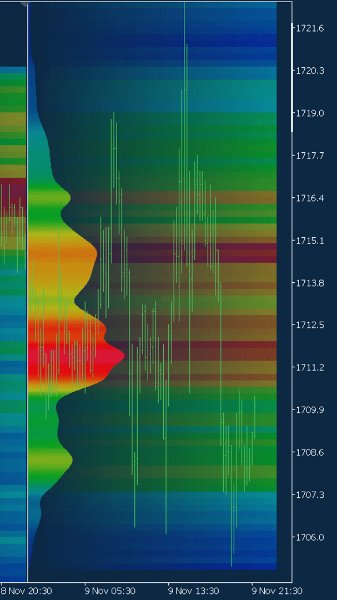
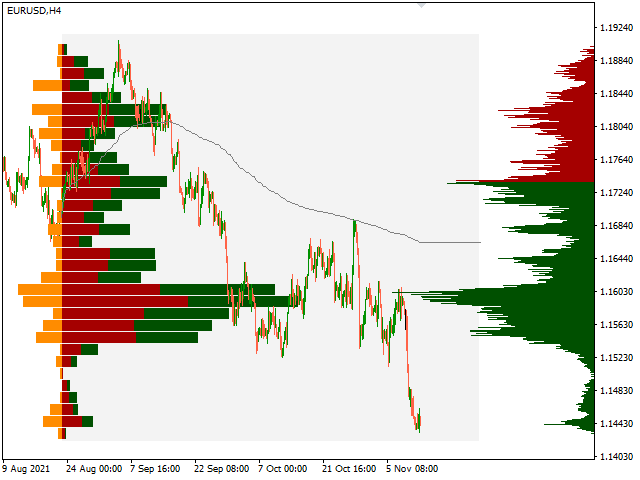
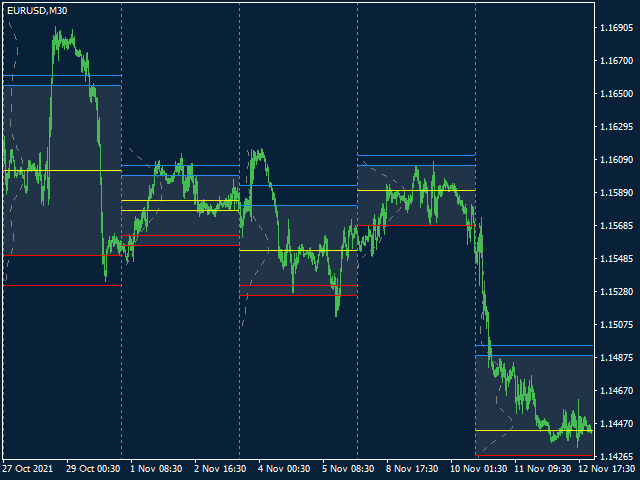
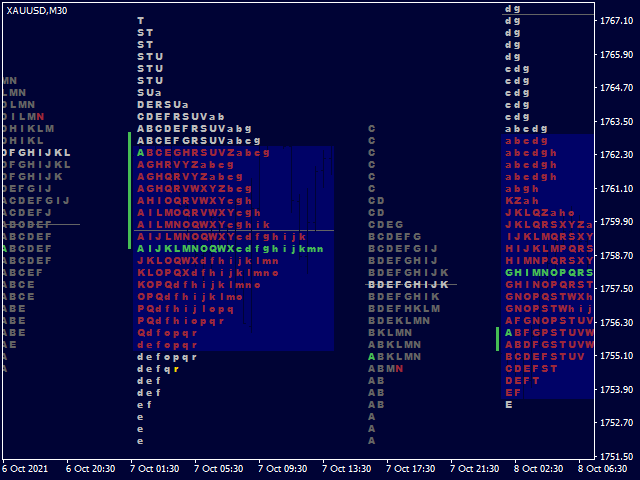
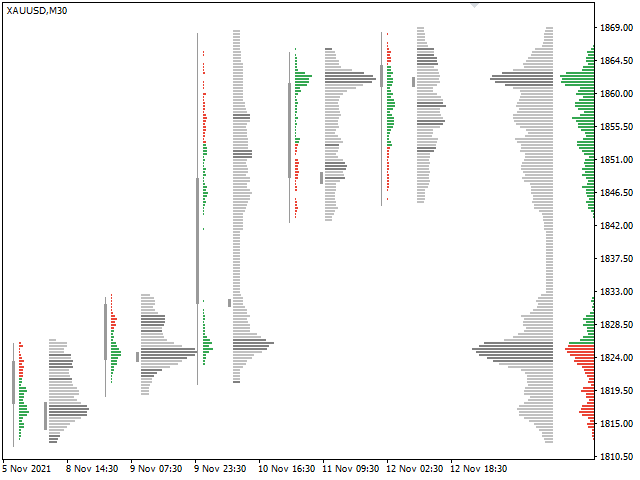
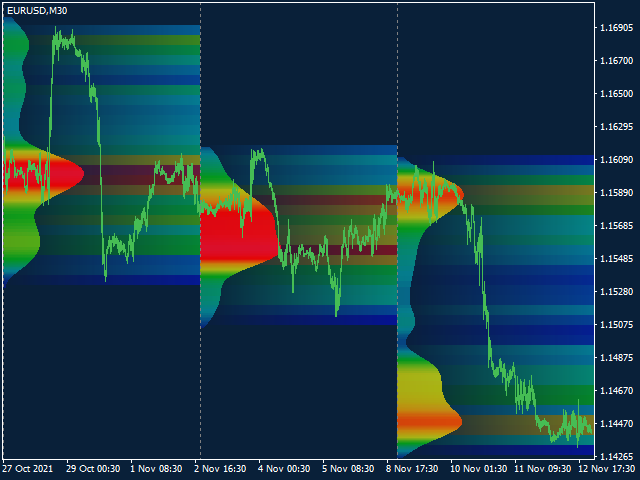
The Volume by Price Indicator for MetaTrader 5 features Volume Profile and Market Profile TPO (Time Price Opportunity). Volume and TPO histogram bar and line charts. Volume Footprint charts. TPO letter and block marker collapsed and split structure charts. Session filtering and grouping. Static, dynamic and flexible range segmentation and compositing methods with relative and absolute visualizations. Graphical layering, positioning and styling options to suit the user's analytic and aesthetic needs.

Volume Profile and Market Profile TPO Point of Control (VPOC and TPOC), Count, Balance, Imbalance, Value Area (VA) and High and Low Volume Nodes (HVN and LVN) with visualization and evaluation by multiple methods and a wide range of user-definable variables to apply with all disciplines and studies. Delta Volume Profile and Footprint charts with volume classification by price action or order type. Additionally includes Initial Balance (IB), Volume Weighted Average Price (VWAP), and Volume by Time histogram and bubble charts to perform Volume Spread Analysis (VSA) and Volume Price Analysis (VPA).

A suite of technical analysis data visualization tools to display the complex relations between volume, price and time in various easy to interpret forms. Types of charts include change over time, part-to-whole, correlation and distribution. Data Source API for data connector extensions and user file feeds to have full control over the scope and type of data beyond native brokerage provisioning. Tick volume, trade volume or open interest. Includes Order Book Time and Sales (T&S) and Depth Of Market (DOM) cross-platform terminal compatible MetaTrader 5 extension for Order Flow Analysis. Data Environment API for extension and developer programmatic access to dimensions and metrics. Includes Traces, Events, Notifications and Reports extensions, and code sample resources for automated algorithmic trading strategies.

High-level chart setups with drag and drop support for the casual user, and further in-depth and segmented by using advanced user features. For a quick start browse example compositions and download chart templates. For details on configuration options and methods see documentation.


Free demo limitations: Distribution with chart timeframe period price data. Range of 200 bars. Up to 5 segments.

レビュー 6
Tyler Sanchez
528
Tyler Sanchez 2022.10.15 16:59 
 

An incredible idicator

João Cavalcante
536
João Cavalcante 2019.05.18 21:00 
 

Very versatile volume and market profile indicator indeed. Glad to have found it. It is the only one available in metatrader market capable of creating profiles with data concatenated from multiple contract months. Delighted to finally see such a feature. Other platforms seem to struggle to get it done. Surprised the mt4 version features it as well. Takes a while to setup and requires some pre-knowledge but as any futures trader knows profiles are most accurate if data from consecutive contract months is aggregated and selected by highest trade activity. Some of the futures traders I know won't even look at a profile which isn't.

dbaumann
38
dbaumann 2019.04.30 01:36 
 

Best alternative to sierra chart for market and volume profiles.

おすすめのプロダクト
Was: $249  Now: $99   Market Profile defines a number of day types that can help the trader to determine market behaviour. A key feature is the Value Area, representing the range of price action where 70% of trading took place. Understanding the Value Area can give traders valuable insight into market direction and establish the higher odds trade. It is an excellent addition to any system you may be using. Inspired by Jim Dalton’s book “Mind Over Markets”, this indicator is designed to suit the
Noize Absorption Index - is the manual trading system that measures the difference of pressure between bears forces and bulls forces. Green line - is a noize free index that showing curent situation. Zero value of index shows totally choppy/flat market.Values above zero level shows how powerfull bullish wave is and values below zero measures bearish forces.Up arrow appears on bearish market when it's ready to reverse, dn arrow appears on weak bullish market, as a result of reverse expectation.
プレミアムレベルは、正しい予測の精度が80%を超える独自の指標です。 この指標は、最高のトレーディングスペシャリストによって2か月以上テストされています。 あなたが他のどこにも見つけられない作者の指標! スクリーンショットから、このツールの正確さを自分で確認できます。 1は、1キャンドルの有効期限を持つバイナリーオプションの取引に最適です。 2はすべての通貨ペア、株式、商品、暗号通貨で機能します 手順: 赤い矢印が表示されたらすぐにダウントレードを開き、青い矢印が表示されたら閉じます。青い矢印の後に開くこともできます。 試してテストしてください!推奨設定はデフォルトです! 日足チャートで最高の精度を示します! インディケータは、2600 Pipsの収益性に対して、約10Pipsという非常に小さなマージンを使用します。
Before installing the HeatMap indicator make sure you are using a broker that gives you access to the Depth of market (DOM) !! This indicator creates a heatmap on your chart allowing you to see the buy or sell limit orders easily and in real time. You have the possibility to change the setting and the colors of the HeatMap in order to adapt to all markets and all charts. Here is an example of a setting you can use with the NASDAQ100 on the AMPGlobal broker :  https://www.youtube.com/watch?v=x0
Basic Support and Resistance   インジケータは、テクニカル分析を強化するために必要なソリューションです。このインジケータを使用すると、チャートにサポートレベルとレジスタンスレベルを投影できます/ mt4バージョン 機能 フィボナッチレベルの統合: サポートと抵抗レベルとともにフィボナッチレベルを表示するオプションを使用すると、私たちの指標は市場行動と逆転領域の可能性についてさらに深い洞察を提供します。 パフォーマンスの最適化: 各バーの開口部のみで拡張ラインを更新するオプションを使用すると、インジケータは、サポートレベルと抵抗レベルの精度を犠牲にすることなく最適なパフォーマンスを保証します。 入力 メイン設定 Timeframe:  この入力を通じて、より高い時間枠のサポートラインとレジスタンスラインをチャート上に表示することを選択できます。 Support/Resistance Strength [Number of Bars]:   この入力を使用して、サポートと抵抗の強度を決定できます。数が高いほど、サポート/抵抗がより強くなります。
インディケータは現在のクオートを作成し、これを過去のものと比較して、これに基づいて価格変動予測を行います。インジケータには、目的の日付にすばやく移動するためのテキスト フィールドがあります。 オプション: シンボル - インジケーターが表示するシンボルの選択; SymbolPeriod - 指標がデータを取る期間の選択; IndicatorColor - インジケータの色; HorisontalShift - 指定されたバー数だけインディケータによって描画されたクオートのシフト; Inverse - true は引用符を逆にします。false - 元のビュー。 ChartVerticalShiftStep - チャートを垂直方向にシフトします (キーボードの上下矢印)。 次は日付を入力できるテキストフィールドの設定で、「Enter」を押すとすぐにジャンプできます。
Mine Farm
Maryna Kauzova
5 (1)
Mine Farm is one of the most classic and time-tested scalping strategies based on the breakdown of strong price levels. Mine Farm is the author's modification of the system for determining entry and exit points into the market... Mine Farm - is the combination of great potential with reliability and safety. Why Mine Farm?! - each order has a short dynamic Stop Loss - the advisor does not use any risky methods (averaging, martingale, grid, locking, etc.) - the advisor tries to get
The market is unfair if only because 10% of participants manage 90% of funds. An ordinary trader has slim changes to stand against these "vultures". This problem can be solved. You just need to be among these 10%, learn to predict their intentions and move with them. Volume is the only preemptive factor that faultlessly works on any timeframe and symbol. First, the volume appears and is accumulated, and only then the price moves. The price moves from one volume to another. Areas of volume accumu
Trading Utility for Forex Currency Pairs Only not for Gold  Functions Auto Lot Calculation based on Risk Auto stoploss  Auto TakeProfit Breakeven Auto Close Half % Close in percentage with respect to the PIPs Pending Orders BuyLimit Sell Limit with distances BuyStop Sell Stop    with distances Trading Informations Risk in percentage For Multiple trades Combine Takeprofit and Combine Stoplosses
Was: $299  Now: $99   Supply Demand uses previous price action to identify potential imbalances between buyers and sellers. The key is to identify the better odds zones, not just the untouched ones. Blahtech Supply Demand indicator delivers functionality previously unavailable on any trading platform. This 4-in-1 indicator not only highlights the higher probability zones using a multi-criteria strength engine, but also combines it with multi-timeframe trend analysis, previously confirmed swings
Market Profile MetaTrader System  — is a classic Market Profile implementation that can show the price density over time, outlining the most important price levels, value area, and control value of a given trading session. This indicator can be attached to timeframes between M1 and D1 and will show the Market Profile for daily, weekly, monthly, or even intraday sessions. Lower timeframes offer higher precision. Higher timeframes are recommended for better visibility. It is also possible to use a
The best time to trade Using this Indicator is when the time reach exactly hour,half,45 minutes,15 minutes and sometimes 5 minutes.. This indicators is helpful to those who trade boom and crash indecies.How to read this indicator first you'll see Blue allow and Red allow all these allows used to indicate or to detect the spike which will happen so the allow happens soon before the spike happen.This indicator works properly only in boom and crash trading thing which you have to consider when
サポート線と抵抗線のプロットにうんざりしていませんか? サポートレジスタンス は、非常に興味深いひねりを加えてチャート内のサポートとレジスタンスラインを自動検出およびプロットするマルチタイムフレームインジケーターです。価格レベルは時間とともにテストされ、その重要性が高まるにつれて、ラインは太くなり、暗くなります。 [ インストールガイド | 更新ガイド | トラブルシューティング | よくある質問 | すべての製品 ] 一晩でテクニカル分析を強化 チャートを閲覧せずに重要な価格レベルを検出 一目ですべての価格レベルの相対的な強さを認識する すべての取引で最大30時間のプロットラインを節約 インジケーターは、すべての価格レベルの年齢を表示します インジケーターは再描画されていません 過去および現在の価格レベルは近接によって崩壊し、現在の市場行動に合わせて調整されます。動作は、必ずしもピークではない場所に線が引かれます。 価格レベルは、時間とともに拒否されるにつれて、より暗く、より広くなります ノイズを避けるために、重要でない価格レベルは定期的にクリアされます カスタマイズ可能な時間枠の
Description: The Volume Profile displays detailed informations of historical trading activities at certain price levels (Market Profile). Locate the areas with the best prices in the market and get an advantage over other market participants. Features: Customizable Market Profile Shows the "fair" Value Area with 70% of all Volume Shows critical low volume zones Shows VPOC, VAL and VAH Points integrated resource management to reduce the load while working with multiple charts Works on all tim
Mean Reversion Supply Demand Indicator Mean Reversion Supply Demand is the indicator to detect the important supply demand zone in your chart. The concept of supply demand trading relies on the quantity mismatching between buying and selling volumes in the financial market. Typically, supply demand zone serves to predict the turning point. The wave pattern, for any supply demand zone to work as an successful trade, looks like the price must touch the base zone, move away and then return to zone
Market profile was developed by Peter Steidlmayer in the second half of last century. This is a very effective tool if you understand the nature and usage. It's not like common tools like EMA, RSI, MACD or Bollinger Bands. It operates independently of price, not based on price but its core is volume. The volume is normal, as the instrument is sung everywhere. But the special thing here is that the Market Profile represents the volume at each price level. 1. Price Histogram The Price Histogram
Market Profile helps the trader to identify the behavior if major market players and define zones of their interest. The key feature is the clear graphical display of the range of price action, in which 70% of the trades were performed. Understanding of the location of volume accumulation areas can help traders increase the probability of success. The tool can be used as an independent system as well as in combination with other indicators and trading systems. this indicator is designed to suit
Provided Trend is a complex signal formation indicator. As a result of the work of internal algorithms, you can see only three types of signals on your chart. The first is a buy signal, the second is a sell signal, and the third is a market exit signal. Options: CalcFlatSlow - The first parameter that controls the main function of splitting the price chart into waves. CalcFlatFast - The second parameter that controls the main function of splitting the price chart into waves. CalcFlatAvg - Par
Introducing "X Marks the Spot" – Your Ultimate MetaTrader 5 Indicator for Perfect Trades! Are you tired of the guesswork in trading? Ready to take your MetaTrader 5 experience to a whole new level? Look no further – "X Marks the Spot" is here to revolutionize your trading strategy! What is "X Marks the Spot"? "X Marks the Spot" is not just another indicator – it's your personal trading compass that works seamlessly on all timeframes . Whether you're a beginner or an experienced trader,
This indicator allows you to enjoy the two most popular products for analyzing request volumes and market deals at a favorable price: Actual Depth of Market Chart Actual Tick Footprint Volume Chart This product combines the power of both indicators and is provided as a single file. The functionality of Actual COMBO Depth of Market AND Tick Volume Chart is fully identical to the original indicators. You will enjoy the power of these two products combined into the single super-indicator! Below is
Key level wedge MT5
Presley Annais Tatenda Meck
The   Key level wedge MT5   indicator automatically draws rising wedge pattern and falling wedge pattern for you on the chart. This pattern is really good when used as a confirmation entry at key support & resistance, supply & demand and reversal zones. Advantages  The   Key level wedge MT5   block DOES NOT RE-PAINT, giving you confidence when a signal appears and also helps when looking back.  The   Key level wedge MT5   includes an on/off button on the chart to easily keep the charts cle
Price Breakout pattern Scanner is the automatic scanner for traders and investors. It can detect following patterns automatically from your chart. Head and Shoulder - Common tradable pattern. Reverse Head and Shoulder - This pattern is the reverse formation of the Head and Shoulder. Double Top - When the price hits resistance level twice and decline toward the support level, the trader can anticipate sudden bearish breakout through the support level. Double Bottom - The double bottom pattern is
Welcome to the Ultimate Harmonic Patterns recognition indicator that is focused to detect advanced patterns. The Gartley pattern, Bat pattern, and Cypher pattern  are popular technical analysis tools used by traders to identify potential reversal points in the market. Our Ultimate Harmonic Patterns recognition Indicator is a powerful tool that uses advanced algorithms to scan the markets and identify these patterns in real-time. With our Ultimate Harmonic Patterns recognition Indicator, you
トレンドトレーディング は、タイミングのプルバックとブレイクアウトにより、市場で起こっているトレンドから可能な限り利益を得るように設計された指標です。確立されたトレンドの中で価格が何をしているかを分析することにより、取引の機会を見つけます。 [ インストールガイド | 更新ガイド | トラブルシューティング | よくある質問 | すべての製品 ] 自信を持って効率的に金融市場を取引する むち打ちにならずに確立されたトレンドから利益を得る 収益性の高いプルバック、ブレイクアウト、早期の逆転を認識する この指標は、独自の品質とパフォーマンスを分析します 複数時間枠のダッシュボードを実装します インジケーターは再描画されていません 電子メール/音声/視覚アラートを実装します 確立されたトレンドは多くの取引機会を提供しますが、ほとんどのトレンド指標はそれらを完全に無視しています。インジケーターの解釈はかなり簡単です: (1) トレンドの変化 (2) トレンドの方向への後退 (3) トレンドの方向へのブレイクアウト 赤いダッシュ は下降トレンド中の修正です 青いダッシュ は上昇ト
MT4版  |  FAQ Owl Smart Levels Indicator は、 Bill Williams の高度なフラクタル、市場の正しい波構造を構築する Valable ZigZag、エントリの正確なレベルをマークする Fibonacci レベルなどの一般的な市場分析ツールを含む 1 つのインジケーター内の完全な取引システムです。 利益を得るために市場と場所に。 戦略の詳細な説明 インジケータを操作するための指示 顧問-取引助手 プライベートユーザーチャット ->購入後に私に書いて、私はプライベートチャットにあなたを追加し、あなたはそこにすべてのボーナスをダウンロードすることができます 力はシンプルさにあります! Owl Smart Levels 取引システムは非常に使いやすいので、専門家にも、市場を勉強し始めて自分で取引戦略を選択し始めたばかりの人にも適しています。 戦略と指標に秘密の数式や計算方法が隠されているわけではなく、すべての戦略指標は公開されています。 Owl Smart Levels を使用すると、取引を開始するためのシグナルをすばやく確認し、注文を出すため
AW Candle Patterns
AW Trading Software Limited
AWキャンドルパターンインジケーターは、強力なキャンドルパターンスキャナーと組み合わせた高度なトレンドインジケーターの組み合わせです。これは、最も信頼性の高い30のローソク足パターンを認識して強調表示するための便利なツールです。さらに、それは色付きのバーに基づく現在の傾向分析器です。     サイズ変更と配置が可能なプラグインマルチタイムフレームトレンドパネル。トレンドフィルタリングに応じてパターンの表示を調整する独自の機能。 利点: キャンドルパターンを簡単に識別 結果を再描画しません 内蔵のマルチタイムトレンドパネル 無効なパターンタイプ(1、2、3キャンドル) パターン表示時のトレンドフィルタリングの調整 MT4 version  表示されるパターンのリスト: ハンマーパターン ピンアップ/ピンダウン 弱気なハラミ/強気なハラミ 弱気のハラミクロス/強気のハラミクロス ピボットポイント反転アップ/ピボットポイント反転ダウン ダブルバーローとハイクローズ/ダブルバーローとロークローズ 終値反転アップ/終値反転ダウン ニュートラルバー/       2つのニュートラルバー ダブルイン
PULLBACK HUNTER What is every trader's cherished dream? To see without delay the places where the reversal will happen. This, of course, is from the category of magic, though... nothing is impossible. But for now I've prepared for you an indicator that marks in real time the end of corrections to the current movement or in short - catches pullbacks.What is the main point? Many people practice rebounds when the price moves in the direction of the open position. And they do them on the formation o
How to use Pair Trading Station Pair Trading Station is recommended for H1 time frame and you can use it for any currency pairs. To generate buy and sell signal, follow few steps below to apply Pair Trading Station to your MetaTrader terminal. When you load Pair Trading Station on your chart, Pair Trading station will assess available historical data in your MetaTrader platforms for each currency pair. On your chart, the amount of historical data available will be displayed for each currency pai
Your Trend Friend
Luigi Nunes Labigalini
5 (1)
The trend is your friend! Look at the color of the indicator and trade on that direction. It does not  repaint. After each candle is closed, that's the color of the trend. You can focus on shorter faster trends or major trends, just test what's most suitable for the symbol and timeframe you trade. Simply change the "Length" parameter and the indicator will automatically adapt. You can also change the color, thickness and style of the lines. Download and give it a try! There are big movements
Awesome Oscillator by Bill Williams with the ability to fine-tune and replace the averaging algorithms of the indicator, which significantly expands the possibilities of using this oscillator in algorithmic trading and brings it closer in its properties to such an indicator as the MACD. To reduce price noise, the final indicator is processed with an additional Smooth averaging. The indicator has the ability to give alerts, send mail messages and push signals when the direction of movement of th
このプロダクトを購入した人は以下も購入しています
まず第一に、この取引インジケーターは再描画されず、再描画されず、遅延しないことを強調する価値があります。これにより、手動取引とロボット取引の両方に理想的なものになります。 ユーザーマニュアル:設定、入力、戦略。 アトミックアナリストは、価格の強さとモメンタムを利用して市場でより良いエッジを見つけるためのPA価格アクションインジケーターです。ノイズや誤ったシグナルを除去し、取引ポテンシャルを高めるための高度なフィルターを備えています。複雑なインジケーターの複数のレイヤーを使用して、アトミックアナリストはチャートをスキャンし、複雑な数学的計算をシンプルなシグナルと色に変換します。これにより、どのような初心者トレーダーでも理解して使用し、一貫した取引の決定を行うことができます。 「アトミックアナリスト」は、新規および経験豊富なトレーダー向けにカスタマイズされた包括的な取引ソリューションです。プレミアムインジケーターとトップノッチの機能を1つの取引戦略に組み合わせ、すべてのタイプのトレーダーにとって汎用性のある選択肢にします。 デイリートレーディングとスキャルピング戦略:高速で正確な
Reversal First Impulse levels (RFI)      INSTRUCTIONS        RUS       -       ENG              R ecommended to use with an indicator   -   TREND PRO -  Version MT4                 A key element in trading is zones or levels from which decisions to buy or sell a trading instrument are made. Despite attempts by major players to conceal their presence in the market, they inevitably leave traces. Our task was to learn how to identify these traces and interpret them correctly. Main functions:: Di
Step into the realm of Forex trading with confidence and precision using XQ, a cutting-edge Forex indicator designed to elevate your trading game to unprecedented heights. Whether you're a seasoned trader or just stepping into the world of currency exchange, XQ Forex Indicator empowers you with the insights and signals needed to make informed trading decisions. The signal conditions are a combination of three indicators, and XQ Forex Indicator only display  medium and long-term trends . The ind
note: this indicator is for METATRADER4, if you want the version for METATRADER5 this is the link:  https://www.mql5.com/it/market/product/108106 TRENDMAESTRO ver 2.4 TRENDMAESTRO recognizes a new TREND in the bud, he never makes mistakes. The certainty of identifying a new TREND is priceless. DESCRIPTION TRENDMAESTRO identifies a new TREND in the bud, this indicator examines the volatility, volumes and momentum to identify the moment in which there is an explosion of one or more of these data a
クリスマスセール!40% OFF!1月1日に価格が$250に値上がり! GoldenGate Entriesをご紹介します:最先端のトレーディングソリューション! GoldenGate Entries(GGE)を使用して取引する革新的なアプローチを発見しましょう。GGEは、取引体験を向上させるために設計された先進的なインジケーターで、ユーザーに正確性と自信を持たせるための包括的な機能を提供します。 通貨ペア:Any(FX - 商品 - 株式 - 株式 - クリプト) タイムフレーム:15分からH1 主な特徴: 買いと売りの矢印の指示:常に情報を受け取るために、買いと売りの矢印の指示をポップアップアラートとともに受け取ります。 GoldenGate_Algo:GoldenGate_Algoを使用して市場の状況を把握し、市場が「売り過ぎ」または「買い過ぎ」かどうかを評価する強力なツールです。 現在のトレンド分析:視聴中のタイムフレームで現在のトレンドにアクセスして、取引を市場の主流方向に合わせることができます。 組み込みのピボットポイント:組み込まれた
WHY IS OUR FXACCCURATE LS MT5 THE PROFITABLE ? PROTECT YOUR CAPITAL WITH RISK MANAGEMENT Gives entry, stop and target levels from time to time. It finds Trading opportunities by analyzing what the price is doing during established trends. POWERFUL INDICATOR FOR A RELIABLE STRATEGIES We have made these indicators with a lot of years of hard work. It is made at a very advanced level. Established trends provide dozens of trading opportunities, but most trend indicators completely ignore them!
Currently Price  20% OFF  ( for unlimited use ) Indicator   USER MANUAL , trade setups, solving issues, etc :  Direct Download Here     (  for users only  ) Hello World! Introducing.. SMCpro tool and Indicator for  MetaTrader 5 , a cutting-edge feature designed to revolutionize your trading experience. With innovative ICT Smart Money Concept, you gain unparalleled insight into market dynamics, empowering you to make informed trading decisions like never before. SMC Indicator built on th
発見が困難で頻度が少ないため、分岐は最も信頼できる取引シナリオの1つです。このインジケーターは、お気に入りのオシレーターを使用して、通常の隠れた分岐点を自動的に見つけてスキャンします。 [ インストールガイド | 更新ガイド | トラブルシューティング | よくある質問 | すべての製品 ] 取引が簡単 通常の隠れた発散を見つけます 多くのよく知られている発振器をサポート ブレイクアウトに基づいて取引シグナルを実装します 適切なストップロスおよび利益レベルを表示します 設定可能なオシレーターパラメーター カスタマイズ可能な色とサイズ バー単位でサイズ別に分岐をフィルタリング パフォーマンス統計を実装します 電子メール/音声/視覚アラートを実装します 幅広い市場の見通しを提供するために、異なるオシレーターを使用して、干渉なしで同じチャートにインジケーターを何度もロードできます。このインジケーターは、次のオシレーターをサポートしています。 RSI CCI MACD オスマ 確率的 勢い 素晴らしい発振器 加速器発振器 ウィリアムズパーセントレンジ 相対活力指数 特に外国為替市
IVISTscalp5
Vadym Zhukovskyi
5 (5)
iVISTscalp5インジケーターをご紹介します。このインジケーターは、トレーディングにおいて独自でありながら効果的です。時間データに基づくこのインジケーターは、多年にわたる経験と金融市場の深い分析の結果です。iVISTscalp5インジケーターは、手動トレーディングにとって優れたツールです。便利さ、簡単さ、可視化 - すべての複雑さが内部に隠されています。私たちは、iVISTscalp5インジケーターの設定と使用を最大限に簡素化しました。このインジケーターは、MT5ターミナルにあるすべての金融商品に適しています。 稼働時間は、4時から20時(UTC+3)です。 iVISTscalp5インジケーターメニュー(スクリーンショット1を参照): History - 引用を計算する週数 dT_min - 時間間隔の選択(分) TFline - 水平ボリュームの作成(時間枠) BARSline - 水平ボリュームの作成(バー数) TFtrend1 - デイリーチャンネルの作成(時間枠) BARStrend1 - デイリーチャンネルの作成(バー数) TFtrend2 - 週次チャンネルの作成(時
Introducing the South African Sniper indicator created by a small group of traders with a few years trading trading the financial market profitably . This is a plug and play indicator that provides you with  BUY and SELL (SNIPER ENTRY) signals with TARGET and trail stops. The indicator Works with all MT5 trading instruments. The indicator uses previous  chart data as receipt to speculate on future market moves.  "The South African Sniper indicator community are very happy with the indicator an
"Piranha" - an autonomous trading system that determines overbought and oversold levels on the chart. Red and blue zones represent overbought and oversold levels respectively. Entry points are marked with arrows: a downward arrow in the red zone for "sell" and an upward arrow in the blue zone for "buy". The Take profit level is indicated by the green moving average. Key features: Adjusting the Take profit level as the green moving average changes position. Averaging ability when a new market e
Introducing the Power Trade Plus indicator designed by a small group of traders with a few years of experience trading the market profitably.  The Power Trade Plus is derived from the Power Trade indicator,  the indicator strive in powerful sniper entries and take profit levels,  with an algorithm that's can determine the markets volatility and Provides entries based on the current market volatility. This indicator is much more effective in stock ,currencies and indices.
このインディケータは、価格アクション分析とドンチャンチャネルのみを使用して、ジグザグ方式で価格の反転を検出します。再描画やバックペインティングを一切行わずに、短期取引向けに特別に設計されています。それは彼らの操作のタイミングを増やすことを目指している賢明なトレーダーにとって素晴らしいツールです。 [ インストールガイド | 更新ガイド | トラブルシューティング | よくある質問 | すべての製品 ] 驚くほど簡単に取引できます すべての時間枠で価値を提供します 自己分析統計を実装します 電子メール/音声/視覚アラートを実装します 可変長のブレイクアウトと混雑ゾーンに基づいて、インディケータは価格アクションのみを使用して取引を選択し、市場が非常に高速に行っていることに反応します。 過去のシグナルの潜在的な利益が表示されます この指標は、独自の品質とパフォーマンスを分析します 負けブレイクアウトは強調表示され、説明されます インジケータは、非バックペインティングおよび非再ペイントです この指標は、日中のトレーダーが単一の価格反転を見逃さないようにするのに役立ちます。ただし、す
3 Indicators in 1 indicator Strategy based on price action Made specifically for the best forex currency pairs Can be used in the best time frame of the market at a very reasonable price This indicator is basically 3 different indicatos . But we have combined these 3 indicators in 1 indicator so that you can use 3 indicators at the lowest price. All three strategies are based on price action. But based on different trends. Long term, medium term and short term Attributes : No repaintin
Professional Scalping Tool on Deriv Attention! The indicator will be sold in limited quantities!!! The previous 5 copies were sold for $250 The remaining 4 copies will be sold for $350 The next price is $500 Description: This trading indicator is designed for professional traders focused on scalping. Designed with the market in mind, it provides highly accurate spike trading signals. It works on the M1 timeframe and supports the following symbols: Boom 300 Index, Boom 500 Index, Boom 1000 I
これはほぼ間違いなく、MetaTraderプラットフォームで見つけることができる最も完全な調和価格形成自動認識インジケーターです。 19種類のパターンを検出し、フィボナッチプロジェクションをあなたと同じように真剣に受け止め、潜在的逆転ゾーン(PRZ)を表示し、適切なストップロスとテイクプロフィットレベルを見つけます。 [ インストールガイド | 更新ガイド | トラブルシューティング | よくある質問 | すべての製品 ] 19の異なる調和価格形成を検出します プライマリ、派生および補完フィボナッチ投影(PRZ)をプロットします 過去の価格行動を評価し、過去のすべてのパターンを表示します この指標は、独自の品質とパフォーマンスを分析します 適切なストップロスとテイクプロフィットのレベルを表示します ブレイクアウトを使用して適切な取引を通知します すべてのパターン比をグラフにプロットします 電子メール/音声/視覚アラートを実装します スコット・M・カーニーの本に着想を得て、この指標は最も純粋で急を要するトレーダーのニーズを満たすように設計されています。ただし、トレードを
MetaForecast M5
Vahidreza Heidar Gholami
5 (2)
MetaForecastは、価格データのハーモニクスに基づいて、どんな市場の未来を予測し視覚化します。市場が常に予測可能ではありませんが、価格にパターンがある場合、MetaForecastは可能な限り正確な未来を予測できます。他の類似製品と比較して、MetaForecastは市場のトレンドを分析することでより正確な結果を生成することができます。 入力パラメータ Past size (過去のサイズ) MetaForecastが将来の予測を生成するために使用するバーの数を指定します。モデルは選択したバー上に描かれた黄色の線で表されます。 Future size (将来のサイズ) 予測すべき将来のバーの数を指定します。予測された将来は、ピンクの線で表示され、その上に青い回帰線が描かれます。 Degree (程度) この入力は、MetaForecastが市場で行う分析のレベルを決定します。 Degree 説明  0 Degree 0の場合、価格の全てのピークや谷、そして詳細をカバーするために、「Past size」の入力に大きな値を使用することが推奨されています。  1 (推奨) Degr
Gannスクエアインジケーターは、W.D. Gannによって執筆された「市場予測のための数学的な式」の記事に基づく強力な市場分析ツールです。このツールは、解析に数学的な概念を応用し、Gann理論に基づいています。それは、144、90、52のスクエアや9のスクエアなど、Gannの関連テクニックの要素を取り入れています。さらに、の方法を組み込んでおり、9のスクエアとその関連性についてのチャネルやスターパターンに焦点を当てています。 ユーザーマニュアルと使用方法: このインジケーターを使用する前に、ユーザーマニュアルを読んで疑問点を解決するためにお問い合わせいただくことをお勧めします。ユーザーマニュアルの完全版は、当社のウェブサイトで入手できます。 MT5の完全版は購入できますし、MT4の無料版も試すことができます。両方のバージョンへのリンクを提供していますので、ご利用ください。 主な機能と機能: Gannスクエアインジケーターは、市場分析のための完全なツールセットを提供し、幾何学的な概念とGann理論に基づいて的確な判断を行う手助けをします。以下に主な機能を示します。 9のスクエアの分析:
スイングトレーディング は、トレンドの方向のスイングと可能な反転スイングを検出するように設計された最初のインジケーターです。トレーディングの文献で広く説明されているベースラインスイングトレーディングアプローチを使用します。インディケータは、いくつかの価格と時間のベクトルを調査して、全体的なトレンドの方向を追跡し、市場が売られ過ぎまたは買われ過ぎて修正の準備ができている状況を検出します。 [ インストールガイド | 更新ガイド | トラブルシューティング | よくある質問 | すべての製品 ] むち打ちを起こさずに市場スイングの利益 インジケーターは常にトレンドの方向を表示します 色付きの価格帯は機会のベースラインを表します 色付きのダッシュは、可能な反転スイングを表します この指標は、独自の品質とパフォーマンスを分析します 複数時間枠のダッシュボードを実装します カスタマイズ可能なトレンドおよびスイング期間 電子メール/サウンド/プッシュアラートを実装します インジケータは再描画またはバックペインティングではありません Swing Tradingとは Swing Tradi
The Volume Spread Analysis indicator is based on the original Volume Spread Analysis method. It was designed for quick and easy recognition of VSA patterns. Even though this indicator looks very simple, it is the most sophisticated tool we've ever made. It is a really powerful analytical tool that generates very reliable trading signals. Because it is very user-friendly and understandable, it is suitable for every type of trader, regardless of his experience. What is VSA? VSA - Volume Spread
このインジケーターは、実際の取引に最適なウェーブ自動分析インジケーターです。 バンドの標準化された定義は、もはや異なる人々の波ではなく、人為的な干渉の描画が排除されます。これは、アプローチの厳密な分析において重要な役割を果たします。         現在購入割引!   => Increase the choice of international style mode, (red fall green rise style) インデックスの内容: 1.1。     基本波: まず、価格変動過程で基本変動の変曲点を見つけましたが、もちろん、彼の注文はそれほど強くないので、次の計算の基礎になります。 2.2。     二次帯域 :基本波に基づいて、アルゴリズム分析を通じてより明白な二次帯域が得られ、二次帯域は波解析の基礎を提供します 3.3。     波: より明確な傾向とより明確で直感的な方向性があります。波が続くかどうかを分析するには、二次波帯の形状を調べ、二次波の組成を分析して、その後の予測を取得する必要があります。波。 4.4。     チャネル: チャネル計算で
VTrende Pro
Andrii Diachenko
5 (1)
VTrende Pro - MTF indicator for trend trading with a display panel for MT5 *** Videos can be translated into any language using subtitles (video language - Russian) Although the signals of the VTrende Pro indicator can be used as signals of a full-fledged trading system, it is recommended to use them in conjunction with the Bill Williams TS. VTrende Pro is an extended version of the VTrende indicator. Difference between Pro version and VTrende: - Time zones - Signal V - signal 1-2 waves
Introduction to X3 Chart Pattern Scanner X3 Cherart Pattern Scanner is the non-repainting and non-lagging indicator detecting X3 chart patterns including Harmonic pattern, Elliott Wave pattern, X3 patterns, and Japanese Candlestick patterns. Historical patterns match with signal patterns. Hence, you can readily develop the solid trading strategy in your chart. More importantly, this superb pattern scanner can detect the optimal pattern of its kind. In addition, you can switch on and off individu
ENG-GOLD Scalper It is an auxiliary indicator that identifies potential targets and determines the place of entry with a stop loss that works on Heiken Ashi candles  The green lines are usually the targets, the red lines are the stop loss, and the yellow lines are the entry location.  This file is recognized on small and medium frames, usually less than the watch frame I highly recommend using XAUUSD US100 US30 USOIL 
Good day! I present to you a trading technical indicator for Deriv broker synthetic indices. This indicator ONLY works with the following indices: Boom 300 Index Boom 500 Index Boom 1000 Index Crash 300 Index Crash 500 Index Crash 1000 Index The indicator was created to give signals to open medium-term trades in the direction of Spikes. But you can open trades in the opposite direction to Spikes, at your own risk. Trade only on M1. Other TFs do not guarantee the correct operation of the indic
RAD CRITICAL LEVES RAD indicator tracks “Relevant Volume” in real time, identifying accumulation and distribution processes, projecting them in the chart as SUPPORT or RESISTANCE zones. Natural   support   and resistance levels are generated by Volume Accumulation and Distribution processes. As these processes evolve, levels at which the relevant volume in the market place is positioned, become difficult areas to cross upwards or downwards. By using this information, traders can identify very s
Weis Wave with Alert MT5
Trade The Volume Waves Single Member P.C.
4.93 (15)
Rental/Lifetime Package Options and Privileges  * For optimum results the yearly or lifetime package is suggested due to live training ! Rent Monthly Six Months   Yearly/Lifetime Weis Wave with Speed with Alert+Speed Index x x x Manual  x x x Quick Set up Video x x x Blog x x x Lifetime Updates x x x Setup and Training Material x x Free Rectangle Break Alert Tool      x Discord Access Channel "The SI traders" x 2-hour live methodology training x How to trade with it:    http://
[ MT4 Version ] Only the next 10 units at current price! Final price: $299 Are you tired of spending months on demo or live accounts to test your trading strategies? The Backtesting Simulator is the ultimate tool designed to elevate your backtesting experience to new heights. Utilizing Metatrader historical symbol information, it offers an unparalleled simulation of real market conditions. Take control of your testing speed, test ideas quickly or at a slower pace, and witness remarkable improve
Elliot Waves Analyzer Pro calculates Elliot Waves to Help Identify Trend direction and Entry Levels. Mainly for Swing Trading Strategies. Usually one would open a Position in trend direction for Wave 3 or a Correction for Wave C . This Indicator draws Target Levels for the current and next wave. Most important Rules for Elliot Wave Analysis are verified by the Indicator.  The Pro version analyzes Multiple Timeframes and shows the Subwaves and Target-Levels.   For an Overview  " Elliot Waves Anal
NakaSide
Ricardo De Andrade Nakano
NakaSideをご紹介します - あなたの究極の市場機会指標! 利益の出る取引の機会を見逃すことにうんざりしていますか?取引を次のレベルに引き上げる準備はできていますか?もう探す必要はありません。NakaSideが登場し、取引方法を革命へと導きます! NakaSideは単なる一般的な指標ではありません。複雑な金融市場を自信を持ってかつ正確に航海するための秘密兵器です。高度なアルゴリズムと先進的なテクノロジーを駆使して、NakaSideは上昇トレンドと下降トレンドの両方でトレンドの変化を検出し、利益の出る機会を見つけるように設計されています。 NakaSideが上昇トレンドの変化を検出すると、鮮やかな緑色のドル記号が表示され、購入の機会があることを示します。逆に、トレンドが反転すると、目立つ赤いドル記号が表示され、売却の機会があることを示します。 しかし、ここでNakaSideが本当に際立つのは、トレンドの特定に留まらないところです。他の人が苦労する横ばい市場では、NakaSideが光を放ち、チャート全体に複数のドル記号を散りばめ、多数の潜在的なエントリーポイントを示
作者のその他のプロダクト
The Volume by Price Indicator for MetaTrader 4 features Volume Profile and Market Profile TPO (Time Price Opportunity). Volume and TPO histogram bar and line charts. Volume Footprint charts. TPO letter and block marker collapsed and split structure charts. Session filtering and grouping. Static, dynamic and flexible range segmentation and compositing methods with relative and absolute visualizations. Graphical layering, positioning and styling options to suit the user's analytic and aesthetic n
フィルタ:
Erik Jeske
131
Erik Jeske 2024.06.11 22:19 
 

Guter Indikator. Allerdings wird mit den meisten Brokern kein reales Volumen angezeigt und daher hilft er mir auch kaum.

Marlonsadler
49
Marlonsadler 2023.04.25 14:58 
 

Hi, i bought this indicator and found it brilliant, is it possible to combine the default view with the Market Profile TPO singles and split structure. I tried to split the default view but it dont look like the Market Profile TPO singles and split structure. i want the histogram with the split letters. is there a way i could send a picture so you can see what i mean?

Tyler Sanchez
528
Tyler Sanchez 2022.10.15 16:59 
 

An incredible idicator

Adeshola Adeyinka
682
Adeshola Adeyinka 2020.06.20 05:55 
 

Well I haven't been able to use it and all support channels are not working. So I can't give an honest review till I put it to use. When I have used it I will review and allocate star ratings.

João Cavalcante
536
João Cavalcante 2019.05.18 21:00 
 

Very versatile volume and market profile indicator indeed. Glad to have found it. It is the only one available in metatrader market capable of creating profiles with data concatenated from multiple contract months. Delighted to finally see such a feature. Other platforms seem to struggle to get it done. Surprised the mt4 version features it as well. Takes a while to setup and requires some pre-knowledge but as any futures trader knows profiles are most accurate if data from consecutive contract months is aggregated and selected by highest trade activity. Some of the futures traders I know won't even look at a profile which isn't.

dbaumann
38
dbaumann 2019.04.30 01:36 
 

Best alternative to sierra chart for market and volume profiles.

レビューに返信
バージョン 9.874 2024.06.28
• Support for new extensions and resources
バージョン 9.870 2024.06.28
• Improved functions for 'Interface Data Source'
バージョン 9.860 2024.06.23
• Improved functions for 'Interface Data Environment'
バージョン 9.850 2024.06.11
• Accessibility improvements
バージョン 9.840 2024.05.14
• Improved functions for 'Dataset Segment'
バージョン 9.824 2024.05.07
• Improved functions for 'Dataset Range'
バージョン 9.810 2024.05.06
• Support for new extensions and resources
バージョン 9.806 2024.05.06
• Stability and performance improvements
バージョン 9.802 2024.05.05
• Improved graphics
バージョン 9.762 2024.05.03
• Improved functions for 'Object Panel'
バージョン 9.756 2024.05.01
• Improved functions for 'Extension Volume by Time'
バージョン 9.752 2024.04.30
• Stability and performance improvements
バージョン 9.750 2024.04.30
• Improved functions for 'Interface Data Source'
バージョン 9.718 2024.04.29
• Support for new extensions and resources
バージョン 9.716 2024.04.29
• Accessibility improvements
バージョン 9.712 2024.04.29
• Improved graphics
バージョン 9.708 2024.04.28
• Improved functions for 'Dataset Segment'
バージョン 9.706 2024.04.28
• Improved functions for 'Object Position'
バージョン 9.702 2024.04.24
• Improved functions for 'Interface Data Source'
バージョン 9.698 2024.04.23
• Support for new extensions and resources
バージョン 9.612 2024.04.11
• Stability and performance improvements
バージョン 9.604 2024.04.09
• Improved functions for 'Dataset Segment Session'
バージョン 9.602 2024.04.08
• Improved graphics
バージョン 9.598 2024.04.06
• Stability and performance improvements
バージョン 9.540 2024.04.04
• Improved functions for 'Object Position'
バージョン 9.528 2024.04.01
• Improved functions for 'Dataset Segment'
バージョン 9.524 2024.03.29
• Accessibility improvements
バージョン 9.520 2024.03.29
• Improved graphics
バージョン 9.512 2024.03.27
• Improved graphics
バージョン 9.502 2024.03.27
• Improved functions for 'Dataset Segment'
バージョン 9.452 2024.03.25
• Improved functions for 'Object Position'
バージョン 9.450 2024.03.25
• Improved functions for 'Column'
バージョン 9.424 2024.03.21
• Performance improvements
バージョン 9.422 2024.03.20
• Support for new extensions and resources
バージョン 9.420 2024.03.20
• Accessibility improvements
バージョン 9.410 2024.03.20
• Improved functions for 'Extension Volume by Time'
バージョン 9.402 2024.03.20
• Stability and performance improvements
バージョン 9.398 2024.03.18
• Accessibility improvements
バージョン 9.396 2024.03.18
• Improved functions for 'Object Position'
バージョン 9.354 2024.03.05
• Improved graphics
バージョン 9.350 2024.02.14
• Improved functions for 'Interface Data Source'
バージョン 9.318 2024.02.13
• Support for new extensions and resources
バージョン 9.316 2024.02.13
• Improved functions for 'Dataset Segment Session'
バージョン 9.314 2024.02.11
• Improved graphics
バージョン 9.312 2024.02.06
• Performance improvements
バージョン 9.308 2024.02.06
• Accessibility improvements
バージョン 9.306 2024.02.06
• Improved graphics
バージョン 9.298 2024.01.22
• Stability and performance improvements
バージョン 9.244 2024.01.16
• Improved graphics
バージョン 9.242 2024.01.15
• Improved defaults for 'Dataset Segment'
バージョン 9.240 2024.01.15
• Improved functions for 'Dataset Segment'
バージョン 9.230 2024.01.12
• Accessibility improvements
バージョン 9.220 2024.01.11
• Support for new extensions and resources
バージョン 9.218 2024.01.11
• Improved functions for 'Interface Data Source'
バージョン 9.216 2024.01.10
• Improved functions for 'Interface Data Environment'
バージョン 9.214 2024.01.08
• Stability and performance improvements
バージョン 9.212 2024.01.08
• Stability and performance improvements
バージョン 9.210 2024.01.07
• Stability and performance improvements
バージョン 9.208 2024.01.07
• Accessibility improvements
バージョン 9.206 2024.01.06
• Improved graphics
バージョン 9.205 2024.01.06
• Improved functions for 'Dataset Segment'
バージョン 9.134 2023.12.31
• Improved functions for 'Column'
バージョン 9.132 2023.12.30
• Improved graphics
バージョン 9.126 2023.12.29
• Support for new resources
バージョン 9.124 2023.12.29
• Improved graphics
バージョン 9.122 2023.12.28
• Accessibility improvements
バージョン 9.120 2023.12.28
• Accessibility improvements
バージョン 9.118 2023.12.27
• Accessibility improvements
バージョン 9.116 2023.12.27
• Improved functions for 'Interface Data Environment'
バージョン 9.114 2023.12.26
• Stability and performance improvements
バージョン 9.112 2023.12.25
• Stability and performance improvements
バージョン 9.108 2023.12.25
• Improved presets for 'Panel'
バージョン 9.106 2023.12.24
• Improved functions for 'Interface Data Source'
バージョン 9.104 2023.12.23
• Support for new extensions and resources
バージョン 9.102 2023.12.23
• Improved functions for 'Main'
• Improved functions for 'Column'
• Stability and performance improvements
バージョン 8.906 2023.12.19
• Improved functions for 'Object Position'
バージョン 8.904 2023.12.18
• Improved functions for 'Dataset Segment'
バージョン 8.902 2023.12.17
• Improved functions for 'Dataset'
• Stability and performance improvements
バージョン 8.710 2023.12.12
• Support for new extensions
バージョン 8.704 2023.12.12
• Improved presets for 'Panel'
• Improved functions for 'Interface Data Environment'
バージョン 8.702 2023.12.10
• Stability and performance improvements
バージョン 8.692 2023.11.30
• Improved functions for 'Main'
バージョン 8.614 2023.11.27
• Improved graphics
バージョン 8.610 2023.11.25
• Accessibility improvements
バージョン 8.608 2023.11.25
• Accessibility improvements
バージョン 8.604 2023.11.24
• Stability and performance improvements
バージョン 8.602 2023.11.24
• Improved functions for 'Style Column'
バージョン 8.598 2023.11.23
• Accessibility improvements
• Improved functions for 'Object Position'
バージョン 8.542 2023.11.20
• Accessibility improvements
バージョン 8.524 2023.11.10
• Accessibility improvements
バージョン 8.520 2023.11.09
• Support for new extensions and resources
• Improved functions for 'Panel'
バージョン 8.518 2023.11.08
• Stability and performance improvements
バージョン 8.516 2023.11.08
• Improved graphics
• Improved functions for 'Style Column'
• Improved functions for 'Interface Data Environment'
バージョン 8.502 2023.06.15
• Improved functions for 'Style Main Line'
バージョン 8.498 2023.06.13
• Improved functions for 'Style Panel'
バージョン 8.496 2023.06.12
• Improved functions for 'Style Main Line'
バージョン 8.316 2023.06.08
• Improved graphics
バージョン 8.314 2023.06.05
• Stability and performance improvements
バージョン 8.312 2023.06.01
• Accessibility improvements
バージョン 8.310 2023.06.01
• Performance improvements
バージョン 8.204 2023.05.24
• Improved functions for 'Object Position'
• Improved functions for 'Dataset Segment'
バージョン 8.198 2023.05.22
• Improved graphics
バージョン 8.102 2023.05.01
• Improved functions for 'Interface Data Environment'
バージョン 8.0 2023.05.01
• Improved defaults
バージョン 7.998 2023.05.01
• Improved graphics
バージョン 7.996 2023.05.01
• Accessibility improvements
バージョン 7.994 2023.04.28
• Accessibility improvements
バージョン 7.993 2023.04.28
• Support for new extensions and resources
• Accessibility improvements
バージョン 7.991 2023.04.04
• Improved graphics
バージョン 7.987 2023.04.01
• Improved graphics
バージョン 7.985 2023.03.29
• Improved graphics
バージョン 7.975 2023.03.27
• Stability and performance improvements
バージョン 7.973 2022.11.15
• Support for new extensions
バージョン 7.972 2022.11.15
• Accessibility improvements
バージョン 7.970 2022.11.13
• Stability and performance improvements
バージョン 7.968 2022.11.11
• Stability and performance improvements
バージョン 7.962 2022.11.07
• Stability and performance improvements
バージョン 7.946 2022.11.03
• Stability and performance improvements
バージョン 7.942 2022.10.28
• Improved presets for 'Panel'
バージョン 7.941 2022.10.28
• Support for new resources
バージョン 7.940 2022.10.28
• Improved functions for 'Interface Data Source'
バージョン 7.931 2022.10.26
• Support for new extensions
バージョン 7.927 2022.10.25
• Accessibility improvements
バージョン 7.926 2022.10.25
• Improved resources
バージョン 7.924 2022.10.24
• Stability and performance improvements
バージョン 7.920 2022.10.21
• Stability and performance improvements
バージョン 7.918 2022.10.19
• Improved functions for 'Interface Data Source'
バージョン 7.914 2022.10.17
• Improved functions for 'Style Main Histogram'
バージョン 7.912 2022.10.17
• Support for new resources
バージョン 7.910 2022.10.17
• Improved functions for 'Style Column'
バージョン 7.902 2022.10.17
• Improved functions for 'Object Position'
バージョン 7.896 2022.10.10
• Support for new extensions
バージョン 7.895 2022.10.10
• Stability and performance improvements
バージョン 7.893 2022.10.06
• Improved resources
バージョン 7.892 2022.10.06
• Improved graphics
バージョン 7.891 2022.10.02
• Support for new resources
バージョン 7.890 2022.10.02
• Improved functions for 'Dataset Segment'
• Improved functions for 'Interface On-Chart Controls'
バージョン 7.850 2022.09.26
• Improved functions for 'Dataset'
バージョン 7.810 2022.09.24
• Stability and performance improvements
バージョン 7.808 2022.09.23
• Improved resources
バージョン 7.807 2022.09.22
• Improved graphics
バージョン 7.805 2022.09.20
• Performance improvements
バージョン 7.802 2022.09.15
• Support for new extensions
バージョン 7.799 2022.09.13
• Support for new resources
バージョン 7.798 2022.09.12
• Improved functions for 'Dataset'
バージョン 7.795 2022.09.10
• Improved functions for 'Interface Data Source'
バージョン 7.793 2022.09.04
• Improved functions for 'Interface Data Environment'
バージョン 7.792 2022.09.04
• Improved graphics
バージョン 7.791 2022.09.04
• Support for new resources
バージョン 7.790 2022.09.03
• Stability and performance improvements
バージョン 7.786 2022.08.29
• Improved resources
バージョン 7.785 2022.08.29
• Accessibility improvements
バージョン 7.765 2022.08.10
• Improved functions for 'Dataset'
バージョン 7.764 2022.08.10
• Improved functions for 'Interface Data Environment'
バージョン 7.762 2022.08.08
• Support for new resources
バージョン 7.761 2022.08.07
• Improved graphics
バージョン 7.760 2022.08.07
• Support for new resources
バージョン 7.759 2022.08.07
• Stability and performance improvements
バージョン 7.756 2022.08.05
• Stability and performance improvements
バージョン 7.754 2022.07.31
• Accessibility improvements
バージョン 7.752 2022.07.29
• Improved presets for 'Column'
バージョン 7.750 2022.07.27
• Improved functions for 'Dataset'
バージョン 7.740 2022.07.25
• Stability and performance improvements
バージョン 7.739 2022.07.24
• Improved functions for 'Interface Data Environment'
• Improved presets for 'Panel'
バージョン 7.712 2022.07.11
• Support for new resources
バージョン 7.711 2022.07.10
• Performance improvements
バージョン 7.709 2022.07.06
• Improved functions for 'Dataset'
バージョン 7.654 2022.06.28
• Improved functions for 'Panel'
バージョン 7.653 2022.06.27
• Stability and performance improvements
バージョン 7.652 2022.06.27
• Stability and performance improvements
バージョン 7.651 2022.06.27
• Support for new resources
バージョン 7.650 2022.06.26
• Improved functions for 'Dataset Segment'
バージョン 7.601 2022.06.20
• Improved graphics
バージョン 7.600 2022.06.20
• Accessibility improvements
バージョン 7.590 2022.06.15
• Performance improvements
バージョン 7.560 2022.05.23
• Accessibility improvements
バージョン 7.550 2022.05.23
• Accessibility improvements
バージョン 7.540 2022.05.15
• Accessibility improvements
バージョン 7.530 2022.05.14
• Accessibility improvements
バージョン 7.520 2022.04.18
• New 'TPO' parameter for 'Evaluation Column'
• Improved functions for 'Interface Data Environment'
バージョン 7.509 2022.04.06
• Accessibility improvements
バージョン 7.508 2022.04.04
• Support for new resources
バージョン 7.507 2022.04.03
• Accessibility improvements
バージョン 7.506 2022.03.08
• Accessibility improvements
バージョン 7.504 2022.03.04
• Improved functions for 'Style Indication'
バージョン 7.502 2022.03.03
• Performance improvements
バージョン 7.501 2022.03.03
• Stability and performance improvements
バージョン 7.499 2022.03.02
• Improved functions for 'Text'
バージョン 7.498 2022.03.02
• New 'Size' parameters for 'Style Main' and 'Style Column'
バージョン 7.495 2022.03.01
• Improved presets for 'Column'
バージョン 7.490 2022.02.27
• New 'Volume' and 'Price Level' parameters for 'Evaluation'
• Improved functions for 'Style Main'
• Improved presets for 'Dataset'
バージョン 7.410 2022.02.25
• Improved functions for 'Style Column'
• Fix for multi timeframe data load issue on platform restart
バージョン 7.405 2022.02.22
• New 'Actual Price Level' preset for 'Panel'
バージョン 7.400 2022.02.22
• New 'Price Level Grid' parameter for 'Dataset'
バージョン 7.370 2022.01.06
• Support for new resources
• Improved graphics
バージョン 7.360 2021.12.11
• New 'Area' option for 'Indication Column'
• New 'Volume' parameter for 'Evaluation Column'
バージョン 7.350 2021.12.09
• Support for new resources
• Improved 'Market Profile (TPO) - Histogram' option for 'Main'
バージョン 7.340 2021.12.06
• New 'History' parameter for 'Dataset'
• New 'Padding' parameter for 'Style Column'
• Accessibility improvements
バージョン 7.310 2021.12.02
• Support for new resources
• Improved functions for 'Main'
バージョン 7.300 2021.11.30
• New 'Direction' parameter for 'Main'
• New 'Market Profile (TPO) - Histogram' option for 'Main'
• New 'Ray' and 'Color' parameters for 'Style Highlight Line' and 'Style Highlight Background Fill'
• New 'Line' options for 'Highlight Main'
• New 'Label' parameters for 'Style Highlight Line'
• Fix for templates issue
• New 'Anchor' parameter options for 'Panel'
• Improved defaults for 'Evaluation HVN/LVN'
バージョン 7.190 2021.11.24
• Stability and performance improvements
バージョン 7.103 2021.11.22
• Accessibility improvements
バージョン 7.0 2021.11.19
several improvements
バージョン 6.191 2021.07.06
fixed issue string value parameter (input as file)
バージョン 6.190 2021.07.05
feature update (data environment)
several improvements
reset parameter default values
バージョン 6.112 2021.06.27
several improvements
presets update
バージョン 6.110 2021.06.25
several improvements
バージョン 6.109 2021.06.24
several improvements
バージョン 6.108 2021.06.23
several improvements
バージョン 6.107 2021.06.21
several improvements
バージョン 6.105 2021.06.20
several improvements
バージョン 6.101 2021.06.17
several improvements
バージョン 6.1 2021.06.15
several improvements
バージョン 6.0 2021.06.12
feature upgrades
reorder parameters
バージョン 5.912 2021.03.12
extended drawing functions
performance improvements
バージョン 5.910 2021.03.08
extended data functions (time range method)
バージョン 5.909 2021.03.07
several improvements
extended data functions (market profile)
バージョン 5.900 2021.03.04
several improvements
extended data functions (price zone labels)
バージョン 5.897 2021.03.02
several improvements
extended data functions (volume time statistics)
improvements strategy tester / free demo
reset parameter default values
バージョン 5.895 2021.03.01
several improvements
fixed issue drawing function (market profile - expanded structure)
presets update (example setting files)
バージョン 5.893 2021.03.01
extended data functions (time range method)
extended drawing functions (market profile - block marker)
reorder parameters
バージョン 5.845 2021.02.27
several improvements
user manual update
バージョン 5.843 2021.02.27
extended drawing functions (highlight option)
バージョン 5.842 2021.02.27
performance improvements
presets update (example setting files)
reset parameter default values
バージョン 5.839 2021.02.26
several improvements
バージョン 5.838 2021.02.26
extended data functions (session filter)
バージョン 5.833 2021.02.25
several improvements
extended drawing functions (update rates)
バージョン 5.830 2021.02.24
feature upgrade
extended data functions (volume time statistics - segment)
バージョン 5.821 2021.02.23
fixed issue drawing function (vp scale by chart)
バージョン 5.820 2021.02.23
extended drawing functions
improvements strategy tester / free demo
バージョン 5.810 2021.02.22
extended data functions (time statistics option)
バージョン 5.809 2021.02.22
several improvements
presets update (example setting files)
バージョン 5.807 2021.02.21
reset parameter default values
performance improvements
バージョン 5.806 2021.02.21
several improvements
バージョン 5.802 2021.02.19
several improvements
バージョン 5.800 2021.02.18
extended drawing functions
bug fixes and performance improvements
presets update (chart color schemes)
reset parameter default values
バージョン 5.652 2021.02.17
several improvements
バージョン 5.641 2021.02.14
extended data functions (market profile - dynamic)
presets update (built-in)
user manual update
バージョン 5.631 2021.02.12
several improvements
presets update (example setting files)
バージョン 5.622 2021.02.10
several improvements
バージョン 5.621 2021.02.10
several improvements
extended data functions (volume time statistics - segment)
バージョン 5.617 2021.02.08
several improvements
バージョン 5.614 2021.02.08
several improvements
presets update (setting files)
バージョン 5.611 2021.02.08
extended data functions (time range option)
バージョン 5.606 2021.02.06
several improvements
バージョン 5.604 2021.02.04
reset parameter default values
バージョン 5.603 2021.02.04
performance improvements
バージョン 5.601 2021.02.03
extended drawing functions (vwap)
バージョン 5.598 2021.02.03
several improvements
reset parameter default values
バージョン 5.596 2021.02.03
several improvements
バージョン 5.593 2021.02.01
several improvements
バージョン 5.590 2021.02.01
extended drawing functions (volume time statistics - mtf)
presets update (setting files)
バージョン 5.521 2021.01.28
performance improvements
バージョン 5.517 2021.01.28
several improvements
extended data functions (range bar)
バージョン 5.514 2021.01.28
several improvements
バージョン 5.510 2021.01.28
extended data functions (volume time statistics - mtf)
extended drawing functions (market profile)
バージョン 5.490 2021.01.27
extended data functions (market profile)
extended drawing functions (volume time statistics)
バージョン 5.460 2021.01.26
several improvements
バージョン 5.452 2021.01.25
several improvements
extended data functions (time range option)
バージョン 5.450 2021.01.25
performance improvements
extended data functions
バージョン 5.218 2021.01.24
several improvements
extended data functions (update rates)
user manual update
バージョン 5.208 2021.01.23
reset parameter default values
user manual update
presets update (setting files)
バージョン 5.207 2021.01.22
several improvements
presets update (setting files)
バージョン 5.206 2021.01.22
presets update (setting files)
バージョン 5.205 2021.01.22
reset parameter default values
extended drawing functions (line highlights)
バージョン 5.204 2021.01.21
extended drawing functions (mp marker block)
バージョン 5.203 2021.01.18
extended data functions (market profile - dynamic)
バージョン 5.202 2021.01.18
extended data functions (time range option)
バージョン 5.201 2021.01.17
presets update (built-in)
improvements strategy tester / free demo
バージョン 5.199 2021.01.16
user manual update
バージョン 5.198 2021.01.16
improvements strategy tester / free demo
バージョン 5.197 2021.01.16
several improvements
extended data functions (market profile)
バージョン 5.195 2021.01.15
several improvements
extended data functions (session filter)
バージョン 5.193 2021.01.13
several improvements
resources update
バージョン 5.192 2021.01.10
user manual update
presets update (setting files)
バージョン 5.191 2021.01.09
several improvements
user manual update
バージョン 5.190 2021.01.08
several improvements
reset parameter default values
presets update (setting files)
バージョン 5.163 2020.07.08
several improvements
reset parameter default values
バージョン 5.162 2020.07.07
several improvements
バージョン 5.161 2020.05.04
extended data functions
performance improvements
バージョン 5.159 2020.05.03
feature update
performance improvements
バージョン 5.152 2020.05.01
several improvements
バージョン 5.150 2020.05.01
feature upgrade
extended data functions (highlight method)
presets update (setting files)
バージョン 5.141 2020.04.30
several improvements
バージョン 5.140 2020.04.30
feature update
バージョン 5.137 2020.04.29
extended data functions (time range segmentation method)
バージョン 5.135 2020.04.28
extended data functions (time range update rate)
performance improvements
バージョン 5.134 2020.04.27
performance improvements
バージョン 5.133 2020.04.27
several improvements
バージョン 5.132 2020.04.21
several improvements
バージョン 5.131 2020.04.20
several improvements
バージョン 5.130 2020.04.20
extended drawing functions (mp marker block size scale non-uniform)
reset parameter default values
presets update (setting files)
バージョン 5.120 2020.04.18
feature upgrade
extended data functions (time range segmentation method)
reset parameter default values
presets update (setting files)
バージョン 5.118 2020.04.14
extended data functions (time range segmentation method)
presets update (setting files)
バージョン 5.116 2020.04.13
several improvements
presets update (setting files)
バージョン 5.115 2020.04.13
extended data functions (time range option)
バージョン 5.113 2020.04.10
extended data functions (time range options and update rate)
reset parameter default values
presets update (setting files)
バージョン 5.112 2020.04.04
presets update
バージョン 5.110 2020.04.03
extended drawing functions
reset parameter default values
バージョン 5.109 2020.04.02
feature update
reset parameter default values
presets update (setting files)
バージョン 5.108 2020.03.31
performance improvements
reset parameter default values
バージョン 5.107 2020.03.30
feature update
バージョン 5.106 2020.03.29
extended data functions
バージョン 5.105 2020.03.27
presets update
chart script update
バージョン 5.104 2020.03.27
several improvements
バージョン 5.103 2020.03.25
feature upgrade
reset parameter default values
presets update
バージョン 5.99 2020.03.16
several improvements
バージョン 5.98 2020.03.15
extended data functions
extended drawing functions
バージョン 5.97 2020.03.14
presets update (built-in)
バージョン 5.96 2020.03.13
several improvements
バージョン 5.95 2020.03.12
several improvements
バージョン 5.94 2020.02.17
several improvements
バージョン 5.93 2020.02.10
extended data functions
performance improvements
バージョン 5.91 2020.02.09
extended data functions
バージョン 5.90 2020.02.09
several improvements
reset parameter default values
presets update
バージョン 5.89 2020.02.08
several improvements
バージョン 5.88 2020.02.05
performance improvements
バージョン 5.87 2020.02.05
presets update (built-in)
バージョン 5.86 2020.02.05
several improvements
バージョン 5.85 2020.02.05
several improvements
reset parameter default values
presets update
バージョン 5.84 2020.02.04
several improvements
バージョン 5.83 2020.02.04
extended data functions
バージョン 5.82 2020.02.04
several improvements
バージョン 5.81 2020.02.03
feature update
extended data functions
バージョン 5.78 2020.02.01
feature update
extended data functions
extended drawing functions
reset parameter default values
presets update
バージョン 5.76 2020.01.31
several improvements
reset parameter default values
バージョン 5.75 2020.01.30
reset parameter default values
バージョン 5.74 2020.01.30
feature updates
extended data functions
extended drawing functions
reset parameter default values
presets update
バージョン 5.65 2020.01.22
feature upgrade
extended drawing functions
presets update
バージョン 5.62 2020.01.21
performance improvements
presets update
バージョン 5.61 2020.01.21
performance improvements
presets update
バージョン 5.60 2020.01.21
feature updates
extended drawing functions
reset parameter default values
presets update
バージョン 5.57 2020.01.19
several improvements
バージョン 5.56 2020.01.19
feature update
extended drawing functions
バージョン 5.54 2020.01.19
performance improvements
バージョン 5.53 2020.01.18
feature upgrade
バージョン 5.52 2020.01.18
performance improvements
バージョン 5.49 2020.01.17
several improvements
バージョン 5.47 2020.01.17
feature updates
extended drawing functions
extended data functions
performance improvements
reset parameter default values
バージョン 5.45 2020.01.16
performance improvements
バージョン 5.40 2020.01.15
feature update
extended drawing functions
reset parameter default values
presets update
バージョン 5.38 2020.01.14
feature update
extended data functions
reset parameter default values
バージョン 5.37 2020.01.13
performance improvements
バージョン 5.36 2020.01.13
feature update
バージョン 5.35 2020.01.12
several improvements
reset parameter default values
バージョン 5.34 2020.01.11
several improvements
バージョン 5.33 2020.01.10
feature upgrade
extended data functions
extended drawing functions
reset parameter default values
presets update
バージョン 5.27 2020.01.08
feature upgrade
extended data functions
extended drawing functions
reset parameter default values
presets update
バージョン 5.24 2020.01.06
feature upgrade
extended data functions
extended drawing functions
reset parameter default values
presets update
バージョン 5.22 2020.01.05
performance improvements
バージョン 5.21 2020.01.04
feature upgrade
extended drawing functions
バージョン 5.20 2020.01.04
several improvements
バージョン 5.19 2020.01.03
several improvements
reset parameter default values
presets update
バージョン 5.18 2020.01.02
several improvements
バージョン 5.17 2020.01.02
reset parameter default values
バージョン 5.16 2020.01.02
feature upgrade
extended data functions
extended drawing functions
バージョン 5.15 2019.12.30
feature upgrade
バージョン 5.14 2019.12.28
performance improvements
バージョン 5.13 2019.12.27
several improvements
バージョン 5.12 2019.12.27
feature updates
extended data functions
several improvements
reset parameter default values
バージョン 5.10 2019.12.24
explicitly set encoding for string conversion operations
バージョン 5.8 2019.12.24
feature update
reset parameter default values
バージョン 5.7 2019.12.22
feature upgrade
parameters update
バージョン 5.6 2019.12.21
feature upgrade
several improvements
reset parameter default values
presets update
バージョン 5.5 2019.12.20
extended drawing functions
reset parameter default values
バージョン 5.4 2019.12.20
extended drawing functions
バージョン 5.3 2019.08.01
feature update
extended data functions
バージョン 5.2 2019.07.20
feature update
バージョン 5.0 2019.07.19
final checks
バージョン 4.102 2019.07.11
feature update
バージョン 4.101 2019.07.09
feature update
バージョン 4.99 2019.07.08
several improvements
バージョン 4.98 2019.07.07
feature upgrade
various feature updates
extended drawing and data functions
reset parameter default values
バージョン 4.96 2019.06.20
several improvements
バージョン 4.95 2019.06.20
several improvements
バージョン 4.93 2019.06.14
feature update
バージョン 4.92 2019.06.14
several improvements
バージョン 4.90 2019.06.13
reset parameter default values
バージョン 4.89 2019.06.13
feature upgrades
バージョン 4.78 2019.06.09
various feature updates
reset parameter default values
バージョン 4.74 2019.06.07
extended drawing functions
バージョン 4.71 2019.06.06
extended drawing functions
performance improvements
バージョン 4.70 2019.06.05
feature update
バージョン 4.69 2019.06.05
several improvements
バージョン 4.67 2019.06.04
performance improvements
バージョン 4.66 2019.06.04
feature update
several improvements
バージョン 4.63 2019.06.02
several improvements
バージョン 4.62 2019.06.02
extended drawing functions
バージョン 4.61 2019.06.02
extended drawing functions
performance improvements
バージョン 4.58 2019.05.31
several improvements
reset parameter default values
バージョン 4.57 2019.05.31
feature upgrade
extended drawing functions
バージョン 4.45 2019.05.30
feature update
several improvements
バージョン 4.41 2019.05.27
various feature updates and upgrades
extended drawing and data functions
performance improvements
reset parameter default values
バージョン 4.1 2019.05.22
extended data functions
バージョン 4.0 2019.05.21
various feature updates
extended drawing functions
reset parameter default values
バージョン 3.106 2019.05.21
several improvements
バージョン 3.104 2019.05.19
feature upgrade
various feature updates
reset parameter default values
バージョン 3.98 2019.05.17
feature upgrade
バージョン 3.97 2019.05.16
several improvements
updated various parameter defaults
バージョン 3.96 2019.05.16
performance improvements
extended drawing functions
バージョン 3.95 2019.05.15
feature upgrade
バージョン 3.93 2019.05.15
various feature updates
reset parameter default values
バージョン 3.91 2019.05.14
several improvements
バージョン 3.89 2019.05.13
various feature updates
reset parameter default values
バージョン 3.87 2019.05.13
updated various parameter defaults
バージョン 3.86 2019.05.13
feature upgrade
various feature updates
reset parameter default values
バージョン 3.61 2019.05.10
several improvements
バージョン 3.59 2019.05.06
various feature updates
reset parameter default values
バージョン 3.57 2019.05.02
several improvements
バージョン 3.56 2019.04.29
various feature updates
バージョン 3.54 2019.04.29
several improvements
バージョン 3.53 2019.04.29
feature upgrade
バージョン 3.51 2019.04.26
feature upgrade
バージョン 3.48 2019.04.26
various feature updates
バージョン 3.44 2019.04.24
performance improvements
バージョン 3.43 2019.04.24
several improvements
reset parameter default values
バージョン 3.42 2019.04.23
feature upgrade
バージョン 3.36 2019.04.21
feature upgrade
バージョン 3.33 2019.04.20
performance improvements
バージョン 3.32 2019.04.20
several improvements
reset parameter default values
バージョン 3.31 2019.04.20
feature upgrade
バージョン 3.29 2019.04.19
feature upgrade
バージョン 3.28 2019.04.18
various feature updates
バージョン 3.27 2019.04.17
extended drawing functions
バージョン 3.26 2019.04.17
performance improvements
バージョン 3.25 2019.04.16
performance improvements
バージョン 3.24 2019.04.16
several improvements
バージョン 3.23 2019.04.16
various feature updates
バージョン 3.22 2019.04.15
performance improvements
バージョン 3.21 2019.04.15
feature upgrade
バージョン 3.17 2019.04.14
several improvements
バージョン 3.16 2019.04.14
various feature updates
reset parameter default values
バージョン 3.15 2019.04.13
several improvements
バージョン 3.13 2019.04.13
performance improvements
バージョン 3.11 2019.04.12
feature upgrade
various feature updates
バージョン 3.7 2019.04.10
several improvements
バージョン 3.5 2019.04.08
various feature upgrades
バージョン 3.1 2019.04.05
changed various parameter defaults
バージョン 3.0 2019.04.05
various feature upgrades
performance improvements
バージョン 2.49 2019.04.04
various feature updates
バージョン 2.44 2019.04.03
feature upgrade
バージョン 2.41 2019.04.03
feature upgrade
バージョン 2.39 2019.04.01
feature upgrade
バージョン 2.37 2019.04.01
several improvements
バージョン 2.36 2019.04.01
various feature updates
バージョン 2.34 2019.03.30
several improvements
バージョン 2.33 2019.03.29
various feature updates
バージョン 2.32 2019.03.28
several improvements
バージョン 2.31 2019.03.26
feature upgrade
バージョン 2.30 2019.03.26
several improvements
バージョン 2.26 2019.03.22
various feature upgrades
バージョン 2.24 2019.03.20
extended data functions
バージョン 2.22 2019.03.20
extended drawing functions
バージョン 2.21 2019.03.19
performance improvements
バージョン 2.20 2019.03.19
various feature upgrades
バージョン 2.18 2019.03.18
changed parameter 'Buffer Limit' default to max
バージョン 2.17 2019.03.18
several improvements
バージョン 2.16 2019.03.18
several improvements
バージョン 2.15 2019.03.17
various feature upgrades
バージョン 2.3 2019.02.26
extended drawing functions
バージョン 2.1 2019.02.24
added input parameter "Draw Height Subtract"
added input parameter "Draw Anchor, Time"
バージョン 2.0 2019.02.22
performance improvements
extended drawing functions
バージョン 1.9 2019.02.22
performance improvements
extended drawing functions
added input parameter "Border Merge"
バージョン 1.8 2019.02.21
fixed incorrect link properties
バージョン 1.7 2019.02.20
added new feature "Snap Time"
バージョン 1.5 2019.02.18
improvements strategy tester
various feature updates
バージョン 1.3 2019.02.15
stability and performance improvements
fixed issue strategy tester
バージョン 1.2 2019.02.12
updated description and link properties
バージョン 1.1 2019.02.11
stability and performance improvements
fixed issue initial drawing